DOT/USD Analysis 24/10/2021update from previous analysis:
previously we were looking at a rising wedge for DOT but a break to the upside actually looked favourable, we done exactly what I mention on all of analysis's which was a swing fail to one side before a sharp drop the other direction, I marked the bullish target on that analysis but we actually came down and perfectly met my bearish target. we have consolidated ever since, there is clearly a large amount of volume in this area.
we have formed a penant here and a breakout is inevitable, I am going to say that I actually favour the downside I think everything needs a nice sharp drop tomorrow let the RSI and MacD reset on larger timeframes like the 4hr/ daily.
I have marked notable price targets, personally I have buys starting to average in from the $41 level and more buys down to $40, I think we could possibly see 39.5 but DOT is one of the most bullish coins in crypto right now so I think the buying pressure at these levels will be insane.
Dotlong

DOTUSDT POLKADOT LONGDOTUSDT is making higher highs and higher lows and continuing its bullish uptrend in the hourly time frame. We can attempt a long with the stop loss on the higher lows i.e. stop loss 1 at 41.87 and second stop loss at 39.43

DOT/USDT did 40% profit and still $100 Potential Coin#DOT/USDT
$DOT currently trading at $43 and went upto $45.50
It’s almost did 40% profit from our Post.
Hope you enjoyed and booked profit also.
Still #DOT $100 potential coin.
DOT/USDTDOT on 12h view broke inverse H&S pattern/bullish with potencial 83% way up..target is approximately 66.8 for this pattern..cheers

DOT - READY TO BREAKOUT AND TEST/BREAK ATH!ALTS ARE LOOKING GOOD TODAY! BTC looking like its pulling back to turn previous ATH into support!
This is a perfect opportunity for alts to catch up and do their thing here!
DOT - IS LOOKING READY TO BREAK OUT AND POSSIBLY BREAK ATH VERY SOON!
BBWP FLASHED A BUY SIGNAL!
MACD looking EXACTLY how we want to see it before a pump!
This is a low risk situation IMO!
GET READY, ITS LOOKING TO BE A GOOD DAY FOR ALTS!

Polkadot Update: Buy Signal Script triggered: 45% Gain to $60Polkadot Update 19/10/21: Bullish Bias still holds! Please See Previous analysis below. Buy Signal from Script triggered on the 1st August: Fast EMA Crossover Slow SMA.
Confirmed reversal, Polkadot Buy Signal from Script triggered: EMA Crossover SMA just below the 23.60% fibonacci level, 43% gain from here to retest the 200 MA. Use buy zone to map your buys. Swing target from here is 160% gain from $18.92 to $49.75.
Current Price Targets:
127.20% Fibs @ $60.08 (45% Gain from current price level)
161.80% Fibs @ $73.59 (78% Gain from current price level)
261.80% Fubs @ $112.66 (173% Gain from current price level)
Happy Trading :)
See previous analysis below.
Polkadot (Dot) Buy opportunity! Potential 50%+ Gain to set a New ATH of $50 at the 161.8% Fibonacci Level. Dot's price soared to a high of $42 on 20/02/21. Since setting this new ATH , it has lost some momentum, retracing down to a low of $26 on the 23/02/21 after such an impulsive move, but currently it is still trading 45% above this low 4days ago on the 23/02/21.
The fundamental outlook for Dot in the long-term is great and still very much bullish , its total Market Cap is at $33.7 billion and currently ranked 6th biggest digital currency in the world after Bitcoin , Ethereum , Cardano , Binance Coin and Tether. Over the coming month we expect Dot to retest the previous ATH of $50 at the 161.8% Fibonacci extension .

DOTUSD Bullish TargetTargeting the 1.272 Fib level which is placed within a parallel channel that can be developed
DOT has been acting very bullish lately
Hence the chart

DOT Ready for new ATHThe announcement of the Polkadat parachain date has created the conditions for this cryptocurrency to experience a new ATH
breaking the 46$ resistance and then 50$ and reach a new ATH in less than a week.
I think this can happen in less than couple days

POLKADOT . DOTUSDT POTENTIAL BULISH POLKADOT . DOTUSDT POTENTIAL BULISH
Entry buy 42$ on retest resistance
target sell on 49$


DOTUSDT PRICE CHARTDOTUSDT PRICE CHART
Buy/Long area
Support 1 and supoprt 2
Short/Sell area
Resistance 1 and major resistance

DOTUSDT Broadening Wedge!DOTUSDT Technical Analysis Update
DOTUSDT currently trading at $34.55
Broadeneing Wedge
Long Entry: Above $34.70
Stop loss : 33.45
Target 1 : $35.45
Target 2 : $36.20
Target 3 : $37.00
Max leverage : 2x
Always keep stop loss

DOTUSDT , Are you ready for 2nd Target ???Hello everybody
According to our previous analysis about DOT , We shown on chart a buy zone area that 2 times came in and there is a opportunities for buying and wait until reach our Target .
As seen on chart our first Tp was reached and now we are ready for 2nd one and after we break minor resistance that shown on chart we can go and reach to the 2nd target .
Dont forget that Dot is one of the amazing project in crypto
Dont forget stop loss and money management
Being with us , follow us and share us
Previous analysis
Good Luck
Abtin

DOTUSDT , Where we are ?Hello guys
According to the chart that shown it , we are in up trend ( bullish trend ) but at this time we need Pullback to buy some dot or take long position for futures trader
We have a main zone that shown it on chart with yellow color and we shown a zone with pink color ( this pink zone its important area for the price if the price can close candle below than the pink area , the up trend can change the trend to down trend )
we think we can pull back to the red area and this is the attractive zone for buying some DOT :D
Dot is amazing and one of the Wonderful project in crypto for solving many things , we can say fundamental of project is powerful and because of that we can take more price over 100$
Dont forget Stop loss in any trading
if anyone have any question , send me messages and Ask :D :D :D :D
Good Luck
Abtin

Polkadot Incoming Breakout?DOT is coming up to test some key resistance levels at 37 and 40 respectively. If we manage to break and hold these two levels, the price will look incredibly bullish . That will lead a buy signal which could push price even higher.

DOT RUNNING! - UpdateDot has broken past the local golden pocket and the final major local resistance, and is currently pressed against the top of the major golden pocket,. which tracks back from the May - July dip.
Chart Patterns:
Dot rejected the bearish head and shoulders pattern that I had previously predicted on Sept 30th.
The Head and Shoulders pattern from September could be looked at as a symmetrical triangle with a target price the length of the tail (around $44)
The technical indicators shown:
MACD - Has turned up and is bullish green, which signals to me that DOT will break farther upwards.
RSI - Shows bullish RSI divergence moving forward. Note, I have the bearish RSI Divergence marked from April - MAY which signaled the major dump. The bullish RSI divergence SHOULD be the same, but opposite, strength as what we had in May.
Fix Range Volume indicator: Shows we have broken past the volume resistance.
ITG Scalper - Shows a buy signal from about a week ago.
My strategy:
First off, I would like to note that DOT in my opinion has been manipulated HEAVILY in the last few months and should be a top 5 project.
I closed position between 38 and 36, and started looking for a buy position when DOT bounced off of the $26 mark. I entered around the $28 mark and currently holding that position.
If we bounce off of the golden pocket with force, I will close position and look to reenter around 30, or on the break upward past the golden pocket.
If we break past the top of the golden pocket, my targets are: $44, $50 (this is ATH), $62.
Currently looking for a price target at the end of the bull run $100 by December, $250 if extended.
This is not Financial Advice.

Bu senaryo muhtemelen gerçekleşecekbitcoin sakin olursa bu savielere gala bilir her duzeltmede aliinar

DOT Great BuyThis upward cone has formed with two distinct formations within it
the first expanding, the second contracting
after these formations finish bullish action is experienced (in green)
And we have just finished the contracting formation (green)
also see chart below

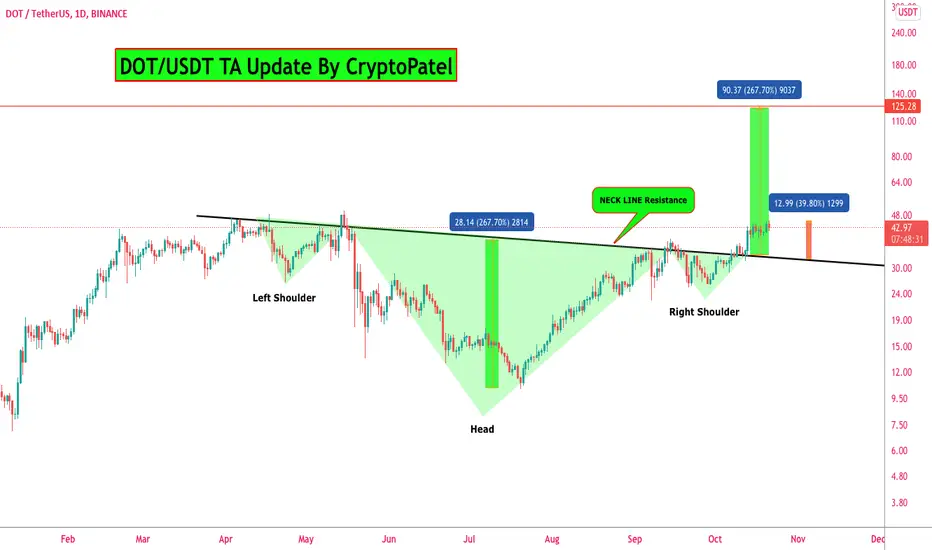
DOT/USDT $125 potential coin ..?#DOT/USDT TA Update:-
$DOT currently trading at $32.50
And Chart is looking good but $37-$38 very strong resistance.
If Breakout $37-$38 level then we can see Huge pump $DOT
After breakout my Target will be $100-$125
Support:- $26.50/$19
Resistance:- $38/$48

Polkadot ( DOT ) Looking Long - Target $35DOT is also bullish to me. The recently broken resistance zone is between $31.65 - $31.40. Although there is a weak resistance above but it should not enough to break the bullish momentum and it looks like there is no any strong upcoming resistance towards the target of $35.
Dot is expected to go back upward to around $31.50 which is a strong buy zone in the current scenario but of course you should look for any price action before opening a long position between $31.65 - $31.40 support zone. To me, the target exit point of this long trade should be $35 at least.

DOTUSDT , Exactly buy zone Hello guys
According to the last analysis about DOTUSDT we shown you the important zone for buying
Exactly from the zone market swing happend and now we are in profit and we are waiting for the first TP
Being with us and be king
Good Luck
Abtin

DOT Buy Potential ContinuesA falling wedge and a current rising megaphone
I expect .786 fib level to hold and a breakout above the megaphone will occur
0.5 showed great support

REEF and DOT - SimilaritiesSimilarities can be seen between these two coins
A flat top has formed, rejected and a recovery has now begun
The only major difference is that REEFUSD is under the 200MA while DOT is above it
A requested idea and comparison post
