✅TS ❕ DOTUSD: formed a peak✅✅DOT has formed a peak. The price turned down. I expect a drop to the support level.✅
🚀 SELL scenario: short to 8.21.🚀
----------------------------------------------------------------------------
Remember, there is no place for luck in trading - only strategy!
Thanks for the likes and comments.
DOTUSD

DotClose 50% of position in r\r2 and 50% in r\r7.You can close 50% of this with dow. When last pivot breaks.

Dot I suggest you close 50% of your positions on r\r2 and you can close 50% of your position on r\r5 or other TR target

Bears like Dot? Polkadot analysisIf open position after break SR lines you can set your target distance of TR or before of next line and you can set your stoploss under or over break candle but don't forgot a good break should don't have divergence and more than 50% break candle should influence.

DOT
#DOT $DOT
- Shark 🦈
- Daily Frame
#This is my technical opinion and not a recommendation to buy or sell

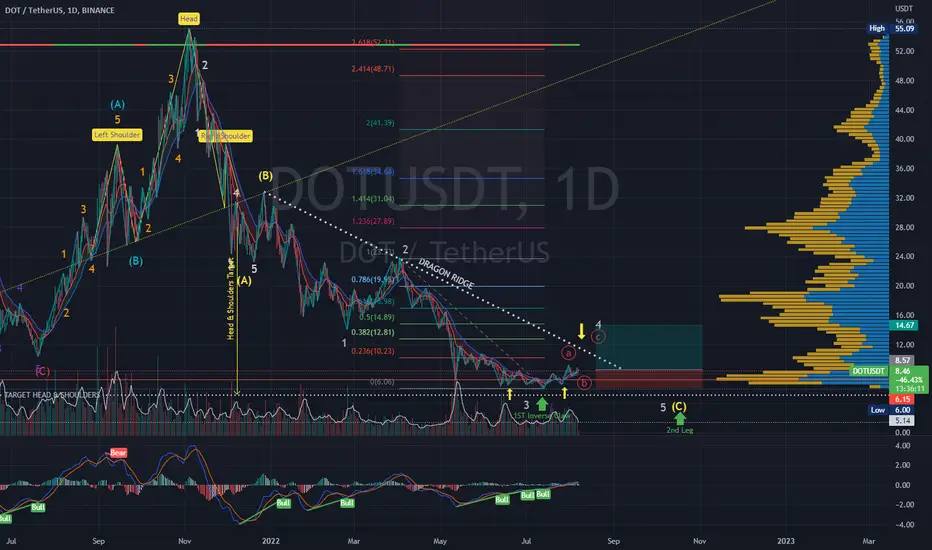
DOTUSDT | Wave Projection | Triple Bullish Divergence DragonPrice action and chart pattern trading
> Anticipating a breakout of dragon ridge or descending triangle breakout downtrend DRAGON ABC wave pattern with current Intermediate C-wave in zigzag formation
> Target @ possible making a minor 4-wave uptrend correction retracing 0.0382-0.5 previous 3-wave +50% - +70%
> Stoploss @ the lowest position of the -25 - 30% to the bottom forming the 1st claw of the dragon, relatively closed to the target of dragon main head & shoulders.
> Entry @ 1st Inverse Claw breakout
> RRR: 2.5:1
Indicator: MACD triple bullish divergence & RSI double divergence
Always trade with affordable risk and respect your stoploss
Polkadot (DOT) - August 7hello?
Welcome, traders.
If you "follow", you can always get new information quickly.
Please also click "Like".
Have a good day.
-------------------------------------
(DOTUSDT 1M Chart)
The key is whether it can be supported by rising to the 11.72-14.93 section.
(1W chart)
In order to rise to the 11.72-14.93 range, the key is whether the price can be maintained above the 7.16-7.74 range.
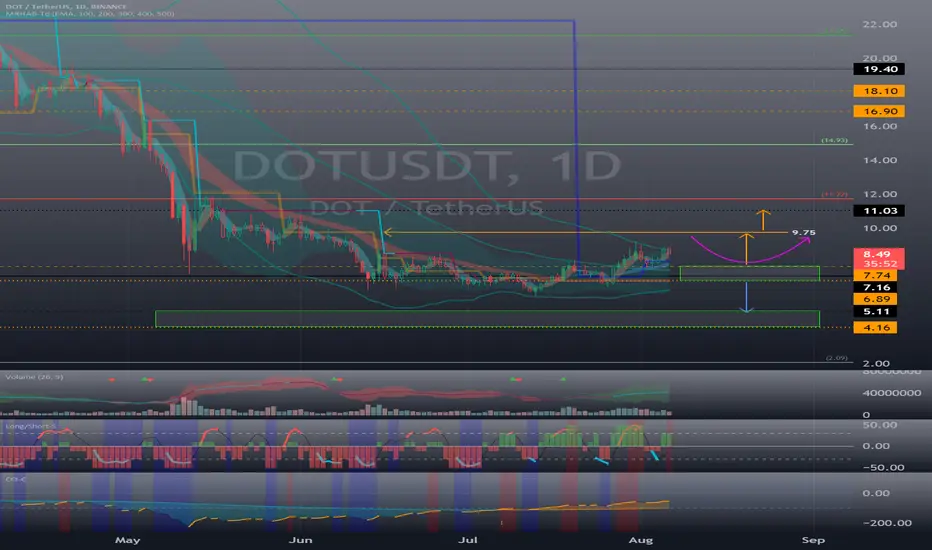
(1D chart)
Primary resistance: 9.75
Secondary resistance: 11.03-11.72
Support: 6.89-7.74
A drop near 9.75 is likely to create a pull back pattern.
At this time, you need to check if it is supported in the 6.89-7.74 section.
The 11.72-14.93 interval is the interval that determines the trend.
Therefore, if it rises to 11.72-14.93 without being supported and falls, it is necessary to stop loss to secure cash.
Therefore, when it falls below 11.03 and receives resistance, it must be Stop Loss.
If you look at the overall chart, you can see that the current price position is at a fairly low price point.
It is good to get short-term profits by investing in coins or tokens in this price range, but I think it is better to increase the number of coins (tokens) from a mid- to long-term point of view.
To do this, it is necessary to check which ecosystem the coin (token) you want to invest in belongs to and is expanding.
This is because I do not think it is good to invest only with the roadmap or future-oriented plan (?) pursued by the coin (token) in a situation that is being combined with the actual business aspect.
The time has come to examine whether the coin ecosystem of the coin (token) you want to invest in is expanding and whether it is useful in actual business.
This is because the era in which themes such as DeFi, NFT, and P2E are created, interest is received using deposit services, and value can be traded through games has begun.
Investing in active coins (tokens) rather than investing in inactive coins (tokens) will give you the strength to survive in the uncertain coin market.
------------------------------------------------------------ -------------------------------------------
** All descriptions are for reference only and do not guarantee a profit or loss in investment.
** The MRHAB-T indicator, which is inactive on the chart, contains indicators that indicate support and resistance points.
** Background color of Long/Short-S indicator: RSI oversold and overbought sections
** Background color of CCI-C indicator: When the short-term CCI line is below -100 and above +100, oversold and overbought sections are displayed.
** The OBV indicator was re-created by applying a formula to the DepthHouse Trading indicator, an indicator disclosed by oh92. (Thanks for this.)
(Short-term Stop Loss can be said to be a point where profit and loss can be preserved or additional entry through split trading. It is a short-term investment perspective.)
---------------------------------
DOT / USDT - BUY and Forget About ItDOT Polkadot Buy it while it's still cheap so you don't have to cry later like a punk.


Polkadot: 77% rally incoming.Hello all. Looking at DOTUSD on the daily chart, we see the price of polkadot inside a rising channel, and currently sitting at a point of resistance at the current $8.75 price level.
While the support of this channel is at $7.14 which is a 20% lower price, the next biggest resistance sits at $15 which is a potential 77% gain.
If the price breaks the current resistance and hits the fib golden pocket at $9 .50 I will expect a rally all the way up to $15.
Retest levels to keep an eye on: 51 Day EMA, Support of the channel at $7.14, 100% fib level at $11.9.
Thanks for reading, and stay tuned. Enjoy.

DOTUSD ❕ held above the rangePolkadot consolidated above the range.
Price entered the bullish RSI zone on the 4H Timeframe.
I think the asset is slightly overbought, so I see an entry point above the resistance level, which the DOT recently broke through. After that, I think the asset will continue to rise.

DOT preparing for PUMP are u ready? watch the reasons DOT preparing for PUMP are u ready? watch the reasons

DOT - RANGE TO PLAYDOT at big resistance. One more little push up or not and think we will have lgo down. If we lose 6.3 usd another support is around 4.6 where could be our bear market bottom.

✅TS ❕ DOTUSD: broken the structure✅✅DOT has broken the structure and has now moved into a downtrend. Now the price is making a correction, after which we can expect a fall.✅
🚀 SELL scenario: short to 7.31.🚀
----------------------------------------------------------------------------
Remember, there is no place for luck in trading - only strategy!
Thanks for the likes and comments.

DOTUSD Potential for Bearish Continuation | 2nd August 2022On the H4, with price breaking the ascending channel , we have a bearish bias that price might drop from our buy entry at 7.53, which is in line with 100% projection and 61.8% fibonacci retracement to the take profit at 6.57, which is in line with overlap support and 161.8% fibonacci projection . Alternatively, price may rise to our stop loss at 9.03, which is in line with the swing high. Take note the 8.02 could be our intermediate resistance, which is in line with the 78.6% fibonacci rertracement.
Any opinions, news, research, analyses, prices, other information, or links to third-party sites contained on this website are provided on an "as-is" basis, as general market commentary, and do not constitute investment advice. The market commentary has not been prepared in accordance with legal requirements designed to promote the independence of investment research, and it is therefore not subject to any prohibition on dealing ahead of dissemination. Although this commentary is not produced by an independent source, FXCM takes all sufficient steps to eliminate or prevent any conflicts of interest arising out of the production and dissemination of this communication. The employees of FXCM commit to acting in the clients' best interests and represent their views without misleading, deceiving, or otherwise impairing the clients' ability to make informed investment decisions. For more information about the FXCM's internal organizational and administrative arrangements for the prevention of conflicts, please refer to the Firms' Managing Conflicts Policy. Please ensure that you read and understand our Full Disclaimer and Liability provision concerning the foregoing Information, which can be accessed on the website.

DOTUSD Potential for Bearish Continuation | 2nd August 2022
On the H4, with price breaking the ascending channel , we have a bearish bias that price might drop from our buy entry at 7.53, which is in line with 100% projection and 61.8% fibonacci retracement to the take profit at 6.57, which is in line with overlap support and 161.8% fibonacci projection. Alternatively, price may rise to our stop loss at 9.03, which is in line with the swing high. Take note the 8.02 could be our intermediate resistance, which is in line with the 78.6% fibonacci rertracement.
Any opinions, news, research, analyses, prices, other information, or links to third-party sites contained on this website are provided on an "as-is" basis, as general market commentary, and do not constitute investment advice. The market commentary has not been prepared in accordance with legal requirements designed to promote the independence of investment research, and it is therefore not subject to any prohibition on dealing ahead of dissemination. Although this commentary is not produced by an independent source, FXCM takes all sufficient steps to eliminate or prevent any conflicts of interest arising out of the production and dissemination of this communication. The employees of FXCM commit to acting in the clients' best interests and represent their views without misleading, deceiving, or otherwise impairing the clients' ability to make informed investment decisions. For more information about the FXCM's internal organizational and administrative arrangements for the prevention of conflicts, please refer to the Firms' Managing Conflicts Policy. Please ensure that you read and understand our Full Disclaimer and Liability provision concerning the foregoing Information, which can be accessed on the website.

DOTUSD Potential for Bullish Continuation | 1st August 2022On the H4, with price moving along the ascending channel, we have a bullish bias that price might rise from our buy entry at 8.99, which is in line with pullback resistance to the take profit at 9.91, which is in line with overlap resistance and 161.8% fibonacci projection. Alternatively, price may drop to our stop loss at 8.18, which is in line with the 38.2% fibonacci retracement and 78.6% fibonacci projection .
Any opinions, news, research, analyses, prices, other information, or links to third-party sites contained on this website are provided on an "as-is" basis, as general market commentary, and do not constitute investment advice. The market commentary has not been prepared in accordance with legal requirements designed to promote the independence of investment research, and it is therefore not subject to any prohibition on dealing ahead of dissemination. Although this commentary is not produced by an independent source, FXCM takes all sufficient steps to eliminate or prevent any conflicts of interest arising out of the production and dissemination of this communication. The employees of FXCM commit to acting in the clients' best interests and represent their views without misleading, deceiving, or otherwise impairing the clients' ability to make informed investment decisions. For more information about the FXCM's internal organizational and administrative arrangements for the prevention of conflicts, please refer to the Firms' Managing Conflicts Policy. Please ensure that you read and understand our Full Disclaimer and Liability provision concerning the foregoing Information, which can be accessed on the website.

DOTUSDTDOTUSDT
Breakdown of the downtrend line and consolidation, possibly a trend change - short-term.
Target-price 1 - 8.40
Target-price 2 - 9.27
Target-price 3 - 10
Target-price 4 - 11

DOT/USDT SHORT SCALP!!BTC/USDT is making a bearish pattren and waves are also bearish. Looking for a short here!!. DYOR/ not a financial advice.

DOTUSD Potential for Bearish Rise | 29th July 2022On the H4, with price moving along the ascending channel, we have a bullish bias that price might rise from our buy entry at 8.00, which is in line with pullback resistance to the take profit at 8.49, which is in line with overlap resistance. Alternatively, price may drop to our stop loss at 7.50, which is in line with the 38.2% fibonacci retracement.
Any opinions, news, research, analyses, prices, other information, or links to third-party sites contained on this website are provided on an "as-is" basis, as general market commentary, and do not constitute investment advice. The market commentary has not been prepared in accordance with legal requirements designed to promote the independence of investment research, and it is therefore not subject to any prohibition on dealing ahead of dissemination. Although this commentary is not produced by an independent source, FXCM takes all sufficient steps to eliminate or prevent any conflicts of interest arising out of the production and dissemination of this communication. The employees of FXCM commit to acting in the clients' best interests and represent their views without misleading, deceiving, or otherwise impairing the clients' ability to make informed investment decisions. For more information about the FXCM's internal organizational and administrative arrangements for the prevention of conflicts, please refer to the Firms' Managing Conflicts Policy. Please ensure that you read and understand our Full Disclaimer and Liability provision concerning the foregoing Information, which can be accessed on the website.

DOT looking for a bullish continuation DOT /USDT
the price just followed my drawing in my previous idea And almost hit first resistance in my chart (TP1)
Check my previous idea here : ⬇️
Breakout this resistance will result in bullish continuation up to 12$ in short term (in long term DOT still have very big room for growth )

dot usdt daily chartdot usdt daily chart
price break the 7.4 dollar resistant so if it could hold this zone it can go higher
wait for retest and rejection or another higher high on chart

DOT preparing for pump 2 strategies for accurate entryDOT preparing for pump 2 strategies for accurate entry
