DOT/USDT 4HInterval Resistance and SupportHello everyone, let's look at the DOT to USDT chart on a 4-hour timeframe. As you can see, the price has left the local downtrend channel.
Let's start with the support line and as you can see the first support in the near future is $6.41, if the support is broken then the next support is $6.35 and $6.29.
Now let's move to the resistance line, as you can see the first resistance is $6.50, if you manage to break it, the next resistance will be $6.55, $6.62 and $6.72.
Looking at the CHOP indicator, we see that there is some energy left for further movement, the MACD indicates the maintenance of the local uptrend, while the RSI is moving in the lower part of the range with room for increases.
DOTUSDT

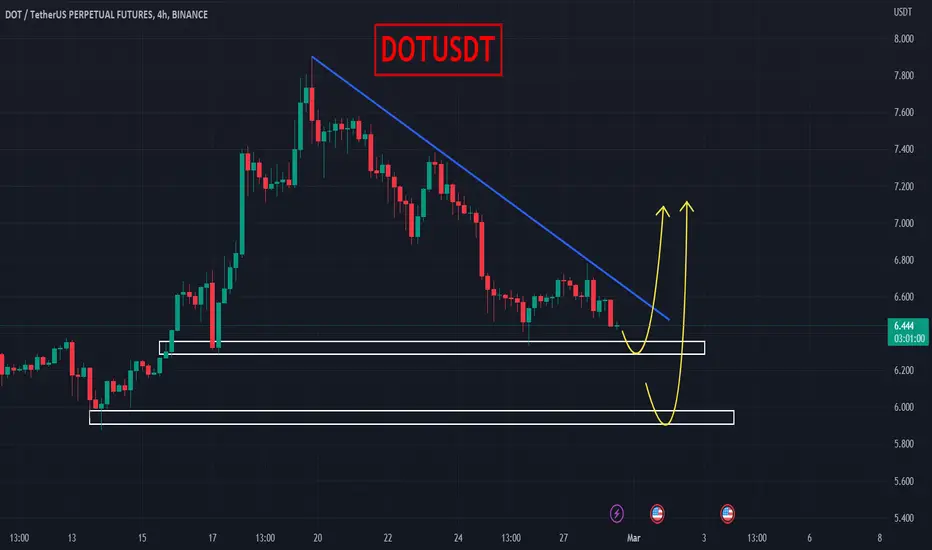
Possible Accumulation Cylinder Possible Accumulation Cylinder looking at the charts. Its hard to draw precisely so I could be well off! Worth seeing if it plays out though.

DOTUSDT. Is it heading to BULLS level ?DOTUSDT is heading towards significantly strong bulls level. The first bull region is 6.36 to 6.28 and the second strong bull region is 5.98 to 5.90.will be bulls respect these region and take the market to another direction?
DOT - false breakdown?Hello, everyone!
Now it's time to make an update on BINANCE:DOTUSDT . We can see the upward trend channed which market maker used for the manipulations.
There are 2 fake outs: one to the down and one to the upside. Now the price broke the support line again. I suppose if the price will be able to re-enter the channel we can see the scenario on the chart. But now it's bearish and we need a confirmation that the price have an intention to re-enter inside the channel.
Best regards, Ivan

Short DOT - 24% targetWe're reaching the top of a very well-respected parallel channel. This top also aligns with the Fibonacci golden pocket (in yellow), providing extra resistance. Price wicked above the golden pocket, trapping some longs. I'm expecting a reversal to the lower golden pocket (taking profit along the way).
Price and volume are diverging. This is a sign of weakness, as apparently less people are willing to trade at these higher levels. This makes a reversal even more likely.
The horizontal channel is being well-respected. The many touches of this channel validate that the channel is drawn correctly. Price is struggling to break above it, showing weakness.

DOT/USDTIn the four-hour period, it has lost the support of MA 100, but it has maintained its dynamic support.
There is a possibility that it can reach the range of 6.8 and 7.1. Of course, if Bitcoin goes up.
If bitcoin falls to 21-20 thousand dollars, this currency can correct up to 5.8-6 dollars.


DOT USDT - my thoughts on the next move 24/02/2023DOT USDT
My thoughts and prosses of planning for a potential entry.
This just to help me learn and look back at what I was thinking.

Polkadot Weekly View - February 2023Hello Guys, Weekly Analysis is on the DOTUSDT Symbol in a 4H Time frame, I Hope it Will be Useful for You, Don't Forget to Like, Follow, Comment

DOT/USDT 4HInterval Resistance and SupportHello everyone, let's look at the DOT to USDT chart on a 4-hour timeframe. As you can see, the price is moving above the local uptrend line.
Let's start with the support line and as you can see the first support in the near future is $6.89, if the support is broken then the next support is $6.65 and $6.31.
Now let's go from the resistance line, as you can see the first resistance is $7.18, if we break it, the next resistance will be $7.32, then we have a strong zone from $7.43 to $7.54 when price breaks it next resistance it's $7.70.
Looking at the CHOP indicator, we see that there is still energy to continue the move, the MACD confirms the ongoing downtrend, while the RSI has a significant rebound and we are approaching the lower limit of the range

🔥DOT IS GOING TO NEW HIGHS! READ THE DETAILED TRADING PLAN!🔥Hi, friends! As it was expected, BTC and altcoins make a pullback, so it's time for us to find the best long entry points. Why long? Because the trend is still bullish.
DOT has now almost reached my 3rd target at $8. I think it will be reached only after the pullback.
📊 TRADING PLAN FOR DOT:
🔥pullback to the 6.5-6.8 value area
🔥volume growth which confirms that retailers are scared and sell
🔥 bullish BTC is a must-have
🚩 Also, I use DOM and Footprint scalping tools, which confirm for me the presence of the big guys. They accumulate all the tokens on the pullbacks. So I can enter the long trade too.
✅ THE MAIN TARGETS FOR DOT:
1. $8 - the key level
2. $9 - the key level and even number
3. $9.68 - the key level, local high
💻Friends, press the "boost"🚀 button, write comments and share with your friends - it will be the best THANK YOU.
P.S. Personally, I open an entry if the price shows it according to my strategy.
Always do your analysis before making a trade.

🔥POLKADOT: PULLBACK TO ACCUMULATE THE POWER BEFORE PUMP🔥Hi, friends! The US Department of Justice announced today that it will take international action regarding cryptocurrencies. A lot of liquidity starts to flow into the market. Retailers start to sell their crypto on this FUD.
According to this, I make a fresh update for Polkadot. Now DOT is testing $5.73 key level which is really important support. If the price will close below this level, the road to $5.25-5.42 value area will be opened, which is also strong support.
If we close above this level, it will be good entry point with short sl below the lows.
📊 TRADING PLAN FOR DOT:
🔥 test the $5.73 key level as the support or the false breakout of this level soon
🔥 large buy orders on DOM and Footprint scalping tools which help me to identify the whale's purchases
🔥 bullish BTC
🚩 Traders, if the price reaches the $5.25-5.42 value area and successfully tests it as the support, it will be a nice chance to open a trade. In this case, the price will cool down and be ready to reach new highs.
✅ THE MAIN TARGETS FOR DOT:
1. $6.5 - the key level and local highs
2. $7.4 - the key level
3. $8 - the key level and even number
Friends, do you believe in DOT and KSM in this bull market or its already a coin with a huge cap and no growth potential? Write your thoughts in the comments!
💻Friends, press the "boost"🚀 button, write comments and share with your friends - it will be the best THANK YOU.
P.S. Personally, I open an entry if the price shows it according to my strategy.
Always do your analysis before making a trade.


DOTUSDT : Analysis , 1DHello traders, we want to check the DOTUSDT chart on the daily time frame. The price is moving in an ascending channel after breaking a range zone to the top and has reached the key price of 7.900. Expect a price correction to around We have 6.700. If the price can maintain its upward trend and can break the specified key level upwards, the next target that can be considered for the price is 9.500. Good luck.

$DOT: LEFT BEARISH TERRITORYPolkadot is a solid project but the bear market was so hard on it, anything below $5 was a good buy but If you missed it you can get in for a short term gain right now.
For risk management, I recommend these settings:
SL: $4.8
TP1: $7.5
TP2: $9

BTC/USDT : Daily : TA : 2023-02-19Support and resistance areas and trend lines are marked by several support and resistance encounters. My opinion is to correct the bit according to contractionary policies and reaching a strong resistance range, what is your opinion?
Sunday, February 19, 2023

$DOTUSDT: Weekly base...Interesting signal here in $DOTUSDT, upside is substantial and could be the start of a larger trend swing. Seems worth a shot on the long side, stop area is below $6.
Best of luck!
Ivan Labrie.

$8 range is confirmed by the Smart Money indicatorThere is further upside potential for Polkadot up to the $8.5 resistance range. Of course, this price increase will take more time because a minor resistance in the range of 7.7 to 8 dollars is standing in the way of the upward trend.
In the 4-hour time frame, we see the upward trend of DOT again.
The resistance of the $8 range is confirmed by the Smart Money indicator, which is an important range.


✴️ Polkadot Update | 3 Months High + Targets ($15 Next)Polkadot produced a bullish breakout yesterday and hit its highest level in 3 months, since early November.
While this is good, this move only confirms MA200 being conquered as resistance.
Still early when it comes to the major bullish wave, DOTUSDT has more to give and can move to $9 within weeks or days.
Additional growth is possible in the coming months, highly probable, with $12 being one of the main targets and even $15 is on the cards and more.
Namaste.

DOT - more gains ahead!Hello, traders!
As you know I expect Bitcoin a little bit higher. Anyway it should break through the $25200 resistance. At the same time DOTUSDT can show us the fantastic pump in the upcoming days.
On the 1D chart BINANCE:DOTUSDT chart we can notice that the trendline resistance was broken without retest. Moreover price formed the range and made a deviation below. Therefore, there is the high probability that PolkaDot will make the same deviation above. It would be logically also because of the ton of liquidity on this way. After that it is going to be difficult to pump, thus I expect the retest of the trendline and the bottom for this asset next to $3 .
Best regards, Ivan
________________________________________________________________________________________________
If you like my trade ideas, please smash the boost button to stimulate me make more quality analytics!

short trem dot # DOT time 1D currency analysis
The price is in the offered range of $7.2 and before this range the price was very compressed and there was a good reaction from this area, and the price returned to this area again, it is expected that the price can break this area and after breaking this level The price should be corrected. Debt and we can enter the buying position in the appropriate limits for the price target of $9, which is an important resistance zone.
If the price cannot break this resistance level, there is a possibility of falling and if you see the trigger, you can enter the position from this level.

DOT / USDT 4H CHART - Targets and Stoploss!Hello everyone, let's look at the DOT to USDT chart on a 4-hour timeframe. As you can see, the price is moving in the uptrend channel indicated by the yellow lines.
Let's start with the support line and as you can see the first support in the near future is $6.69, if the support is broken then the next support is $6.50, $6.36 and $6.21.
Now let's move to the resistance line, as you can see the first resistance is $6.69, if you manage to break it, the next resistance will be $7.14 and $7.37.
Looking at the CHOP indicator, we see that we have a lot of energy for the next move, the MACD indicates a local uptrend, while the RSI has approached the upper end of the range, which may give an impending price rebound.
