Polkadot Weekly View - February 2023Hello Guys, Weekly Analysis is on the DOTUSDT Symbol in a 4H Time frame, I Hope it Will be Useful for You, Don't Forget to Like, Follow, Comment
DOTUSDT

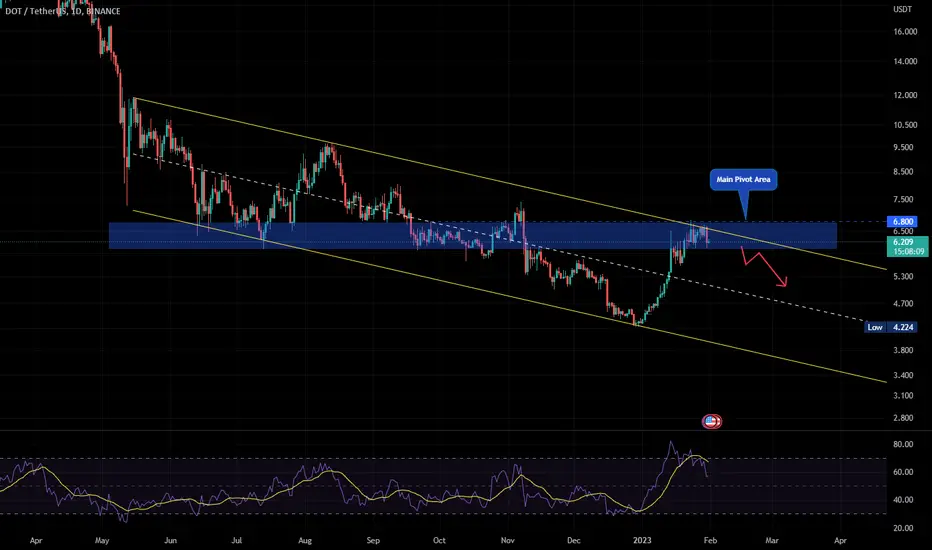
DOT / USDT 1D CHART - Resistance and SupportHello everyone, I invite you to review the DOT chart as its predecessors on a one-day interval. Please see that in this situation we can use the yellow line to mark the uptrend channel in which the price is moving.
Let's start by marking the support places for the price and we see that we have first support at $6.05, but if the price goes lower, we have another support at $5.67, then at $5.33, and another support at $5.33 $4.83.
Looking the other way, we can similarly determine the places of resistance that the price has to face. And here we see that there is a very strong resistance at $6.74, only when the price breaks it will it be able to move towards the resistance at $7.43.
The CHOP index indicates that we have a lot of energy for the upcoming move, the MACD indicates the continuation of the downtrend, while the RSI moves sideways in the middle of the range.

DOT / USDT 1H CHART - Resistance and SupportHello everyone, let's look at the DOT to USDT chart on a 1-hour timeframe. As you can see, the price is moving above the local downtrend line.
Let's start with the support line and as you can see the first support in the near future is $6.03, if the support is broken then the next support is $5.96, $5.90 and $5.84.
Now let's go from the resistance line, as you can see the first significant resistance has been broken, the second resistance is $6.36, if you manage to break it, the next resistance will be $6.65.
Looking at the CHOP indicator, we see that the collected energy is used for the current increase, the MACD indicates a local uptrend, while the RSI has approached the upper limit of the range, which may give a temporary rebound.

💡Don't miss the great buy opportunity in DOTUSDTI like to hold dot because it gives good deposit interest. Since I saw the opportunity, I wanted to share it immediately, I will do the detailed analysis in the comments. Actually the chart shows the entry, stop loss and take profit points :) Good luck.

DOT / USDT 4H CHART - Resistance and Support!Hello, I invite you to review the DOT chart in pair to USDT, on a four-hour interval. First of all, we will use the blue lines to mark the uptrend channel from which the price has gone down, while the yellow lines will mark the downtrend channel in which we are currently moving.
Going further, we can move on to marking support areas in a situation where the correction is deepened. And here the first support is at $5.91, but when we go lower, the next support is at $5.56.
Looking the other way, we see that we first have an important resistance zone from $6.21 to $6.38, only when we break through it will the next resistance be at $6.52 and then $6.66.
Please look at the CHOP index, which indicates that the energy collected is being used to correct the price, the MACD indicates that we have entered a downtrend, while the RSI has touched the lower end of the range.

Dot Long to +9Dot Long to +9 Level need to breakout 7.4 to continue higher. can go long from 6.2/6.3 until 7.4 and wait a continuation price action

Polkadot ($DOT) - Directional Control Polkadot ($DOT) - will short if we get this setup. Break of wedge, w/ bearish retest and back down to green demand level.
Directional control point below in red, bullish above that on a macro scale.
-> loss of wedge
-> loss of trend
-> rejected at resistance
-> green support on LTF below
-> must hold directional control point to remain macro bullish
Cheers

DOTUSDTDOTUSDT is in a correction phase. The price has a chance to test the support 5.0-5.8 and expects this support zone. The price will be able to rebound. Wait to buy the red zone, targets 7.0, 7.9 and 8.8 >> GooD Luck 😊

DOT / USDT 1D CHART - Resistance and SupportHello everyone, I invite you to review the DOT chart in pair to USDT, on a one-day timeframe. As we can see, the price is currently based on the downtrend line.
Going further, we can move on to marking support areas in a situation where the current correction is deepened. And here, the first support is at $6.02, then we have the support zone from $5.68 to $5.33, the next support is at $4.84, and then at $4.21, where the last low is.
Looking the other way, we see that the price must first overcome the strong resistance from $6.96 to $7.59, which has not been broken so far. Only when the price breaks through this zone will it be able to move towards $8.49 and then $9.66.
Please look at the CHOP index, which despite the correction indicates that there is a lot of energy, the MACD indicates a downward trend, while the RSI shows a further rebound, but there is still room for a larger price drop.

Significance of the 9.262-10.131 sectionHello?
Traders, welcome.
If you "Follow", you can always get new information quickly.
Please also click "Boost".
Have a good day.
-------------------------------------
(DOTBTC 1W chart)
The question is whether it can break out of the downtrend channel and rise above 0.0003 911.
Therefore, it must rise above 0.0003 911 to gain or dissipate the rising force.
---------------------------------------
------------------------------------------
(DOTUSDT 1W Chart)
The question is whether it can break out of the downtrend channel and rise above 7.530.
If not, you should check for support around 5.192.
(1D chart)
The downtrend line passing through the top is not yet accurate.
Therefore, the downtrend line is valid only when the candlestick closes with a lower candlestick this week.
In any case, it is important to see if the price can sustain itself by moving higher above the 6.208-6.440 zone.
If not, it is expected to fall below 5.674.
Depending on the movement of BTC, it is expected to touch the circle section marked on the chart.
From a mid- to long-term perspective, the important section is the 9.262-10.131 section.
If the price holds above this zone, it is expected that the mid- to long-term uptrend will begin.
DOT is one of the coins expanding the coin ecosystem.
Therefore, it is one of the coins that can be invested in from a mid- to long-term perspective.
-------------------------------------------------- -------------------------------------------
** All descriptions are for reference only and do not guarantee profit or loss in investment.
** If you share this chart, you can use the indicators normally.
** The MRHAB-T indicator includes indicators that indicate points of support and resistance.
** Check the formulas for the MS-Signal, HA-Low, and HA-High indicators at ().
(Short-term Stop Loss can be said to be a point where profit or loss can be preserved or additional entry can be made by split trading. This is a short-term investment perspective.)
---------------------------------

DOT in Pivot Daily and weekly DOT is in a Downtrend channel and as you can see rejected from upper band and also we are in pivot area in weekly and daily also div is clear on daily , if price drop below 5.9 we will go down again , as as market show us blood will be in the market ,
anyway if you are in long position suggest to close and if you want to make short position put stop above 6.82
use proper risk managment

Waiting for market action#3
Hello guys doge moving on trend line but we're optimist for up rise - always be in profit !

✴️ Polkadot 5X Lev. (500%+ Potential)Normally we do 8-10X but since the initial breakout already took place we lower the lev.
Instead of missing the opportunity all-together, we just lower the leverage and this way we can still jump in.
We like to get the support level, the bottom... Once it starts moving we like it less but still people demand the numbers and so we comply and do our best.
Keep in mind that there is a high probability of losing money in this or any trade... Be aware of the risks involved, if in doubt, skip... Leave and comeback when you feel certain.
Knowledge can help you clear any doubts.
Deep breathing and relaxation can help you make the right choices.
Always be certain yourself before taking any trades or decision.
Never hurry... If for whatever reason at any time you think that you have to "act fast", then that's the signal to slow down.
Opportunities are endless.
When one door closes, 1,000,000 doors open.
----
LONG DOTUSDT
Leverage: 5X
Buy-in: $5.250 - $5.850
Targets:
1) $6.500
2) $7.100
3) $8.200
4) $8.900
5) $10.10
6) $12.00
Stop-loss: Close daily below $4.950
Liq. price: $4.678
Potential profits: 540%
Capital allocation: 3%
----
This is not financial advice.
Leveraged trading is ultra-high risk and for experts only.
Liquidation can result in all funds lost.
We wish you the best, now and always.
We wish serenity, tranquility, prosperity and success.
Patience is key.
Consistency and persistence will produce the desired results.
Energy in, energy out.
Take your time... Put your energy into it, dedicate time into it and it will give you back whatever you gave in... Multiplied by 10 of course.
Look at my work for example... I work very hard, I am always rewarded with your amazing and continued support.
Thank you my friend.
Namaste.

DOTUSDT 15 Min Chart Demand & Supply Zones#Polkadot #DOT 15 Min #Chart Demand and Supply Levels.
Bullish Supply Range ( Go Long) - USD 6.75/-
Bearish Supply Range ( Go Short) - to USD 7.05/-
#polkadot #dot #cryptocurrency #crypto
Current Status - Movement Towards Bull Run.

DOT / USDT 4H CHART - Targets and Stoploss!Hello everyone, let's look at the DOT to USDT chart on a 4-hour time frame. As you can see, the price is moving below the local downtrend line.
Let's start with the support line and as you can see, first we have a support zone from $6.66 to $6.57, if the support is broken then the next support is $6.45 and $6.29.
Now let's move on to the resistance line, but first we have a resistance zone of $6.82 to $6.95, if we manage to break it, the next resistance will be $7.08 and $7.27.
Looking at the CHOP indicator, we see that most of the energy has been used, the MACD is close to entering a downtrend, while the RSI indicates a strong reaction, which creates room for increases.

DOTUSDTHello Crypto Lovers,
Mars Signals team wishes you high profits.
This is a one-day-time frame analysis for DOTUSDT
In this chart, R1 and R2 are our resistance areas in which the unsuccessful triumphs of price is obvious. S1 used to be a long-term resistance line. S2 used to be another resistance area in the past. And S3 is the support area with the support of price at several points. Presently, the price is fluctuating over S1 after its falling trend and we believe the price will continue its rise by having some rising signs and an increase will happen to higher amounts for the price besides the activation of the long position of the chart. But if the price is not supported at its current point, or when it reaches at R1, or even it falls below S1, definitely it would face a falling trend to lower amounts such as S2 or S3. We recommend you to have every piece of information and idea via our analyses for receiving more profitable trades.
Warning: This is just a suggestion and we do not guarantee profits. We advise you to analyze the chart before opening any positions.
Wish you luck

#Dot | #UsdtI think #Dot is billish (15m)
first position is high risk
second position is medium risk
Targets : green lines
Don't risk more than 3% of capital.


DOGE IS READY FOR FLY#2
guys everything is ready for uprising - if you see problem on chart let me know - Always be in profit !

DOT/USDT Perp, new ATL coming?? Greetings all, I am back with my analysis of DOT/USDT Perp. As the current mini bull run is reaching its conclusion, it's my belief that the bear market has not fully subsided. The current market price for DOT/USDT is $6.656. After having taken some profits from a previous long position, I think it is prudent to consider a retracement.
A close examination of the higher time frame market structure reveals that DOT/USD has yet to clear the previous November high. This is a crucial technical level, and as a result, I believe that a retracement to the $5 area is likely. In light of this, I have taken a small short position with a target of $5.5, where I plan to take profit. My invalidation level has been marked on the chart.
As always, I advise all traders to conduct their own research and manage their risk appropriately.

DOT / USDT 4H CHART - Targets and Stoploss!Hello everyone, let's look at the DOT to USDT chart on a four-hour time frame. As you can see, the price has fallen below the local uptrend line.
Let's start with the support line and as you can see the first support in the near future is $6.60, where the price is moving, the next support is $6.46 and $6.04.
Now let's move on to the resistance line, first we will mark the resistance zone from $6.85 to $7.01, if you manage to break it, the next resistance will be $7.14, $7.27 and $7.45.
Looking at the CHOP indicator, we see that the energy is currently being used for price correction, the MACD indicates a local downtrend, while the RSI has a strong rebound, which creates room for new increases.
