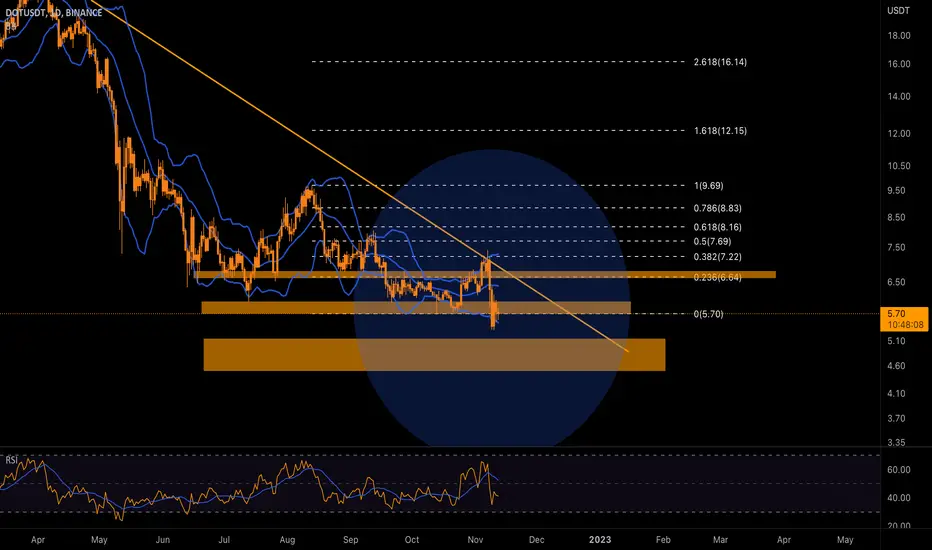
You have to wait until the price stabilizes on the levels!DOT had a sharp downtrend over the past week. The price of this currency registered a sharp decline after failing to stabilize above the resistance range of $6.6-6.8, and the selling pressure broke the support of the $5.7-6 range. This bearish trend could continue if Bitcoin breaks back below the $16,000 range, taking the price down to key support in the $4.5-$5.14 area.
Selling pressure and sellers' strength is still high, and this can be seen from the upper angle of the descending wave with the horizontal axis. To see the signs of reduction and removal of selling pressure, we can consider the positive divergence of the RSI indicator, the volume divergence, and a complete pullback to the downward trend line. With a higher probability in the channel range of $4, there is a possibility of a complete price reversal and trend change. Therefore, you should wait until the price stabilizes at the specified levels.
DOTUSDT

$DOTUSDT UPDATE!!!Hi Snipers,
Please refer to the recording for the next price levels and scenarios.
Thanks
MS

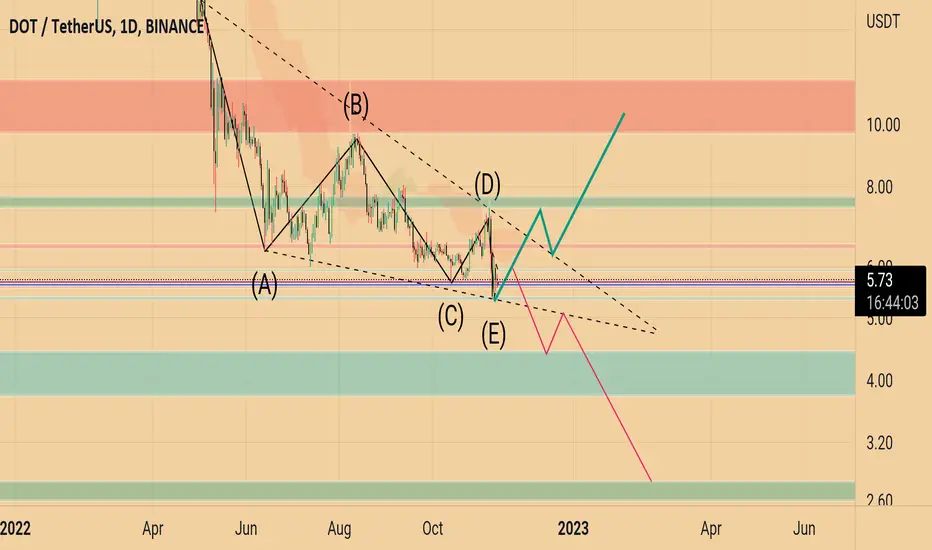
Polkadot DOT price has nowhere to fall below. It's time for longIt's been a while since we did a DOTUSDT idea, then it's time to refresh our thoughts.
As you can see from the chart, the DOT price is clearly moving from one liquidity level to another, we have marked them nicely on the chart.
So, we assume that the price of the Polkadot token will consolidate a little more, buyers will gain strength and break up from the falling channel.
Therefore, we make an assumption for ourselves about the possible movement of the DOTUSD price
Long to $6.60 - correction - long to $7.90 - correction - long to $9.50-10
_____________________
Did you like our analysis? Leave a comment, like, and follow to get more

🟢 DOTUSDT - 1D (08.10.2022)🟢 DOTUSDT
TF: 1D
Side: Long
SL: $5.4930
TP 1: $6.8478
TP 2: $7.3891
TP 3: $7.8265
Expecting big things from DOT. Which ever path it takes should lead to a break out.

DOTUSDT2 options for entry ,waiting for CHoCH on 5-15m tf and open long or short, follow the risk management and don't forget to put stop loss

Polkadot shortPolkadot broke trough the ascending trendline. Asset broke trough the support level. Bearish movement to support level at 5.75 is possible.


DOTUSDT sk analysis buying signalmarket in on the way to our pink buying area (WCL) after formation of III pink sequence also there breakout for the bullish correction LVL

Trading opportunity for long position DOTUSDTBased on technical factors there is a Long position in :
📊 DOTUSDT - Polkadot
🔵 Long Now 7.06
🧯 Stop loss 6.65
🏹 Target 1 7.70
🏹 Target 2 8.70
🏹 Target 3 10.00
💸RISK : 1%
We hope it is profitable for you ❤️
Please support our activity with your likes👍 and comments📝

DOTUSDT 145 profit potentialrecently got 22% profit
now breaks another chart in daily tf
expecting 150% bulish wave

DOT ShortShort because
- double top after a steep run up
- BTC shows weakness after run up and is about to go short- i think DOT will follow

Dot update Ill take profit in my long position at 7.88$
I bought it at 5.8 $
Was good scalping for dot around 2 weeks
Then ill sell spot at 7.88 $
To 5-4.7 $
GOOD LUCK
POLKADOT UPDATE | DOTUSDWould be great to see a breakout above the falling wedge upper line with a retest to form inverse H&S
If that happens, could easily run 50% towards $9.3-9.5 area
Things take time.

DOT/USDT - LONG 12H TF----- Welcome, dear followers! -----
- Here is my trading methodology. I trade with a normal system and analysis of resistance and support, as well as price reversal patterns.
- For the record, I do not place a stop loss within my trades. So that I only risk 1.5% of my total capital in order to support the loss due to a price reversal against me.
- If a price reversed against my expectation and touched the drawn line r3, then I transferred targets to the entry point and waited for the price to close at it with a loss equal to almost zero.
- Today's deal is shown in the chart, and here are the entry and exit points below.
-- Support me with numbers and follow up on my account for other deals in the future. Thank you for coming to this part. --
-------------------------------------------------------
⚡️⚡️ #DOT/USDT ⚡️⚡️
Client: My-Binance Futures
Trade Type: Breakout (Long)
Leverage: Cross (2X)
Entry Targets:
1) 6.9 - 100.0%
Take-Profit Targets:
1) 7.468 - 25.0%
2) 7.968 - 25.0%
3) 8.573 - 25.0%
4) 9.653 - 25.0%
Trailing Configuration:
Entry: Percentage (0.5%)
Take-Profit: Percentage (0.5%)
Stop: Breakeven -
Trigger: Target (1)


falling in DOTDue to the formation of the corner pattern, there is a possibility of falling to the specified range


DOTUSDT sk analysis crypto signal Market on the way to our yellow bc buying zone after formation of yellow sequence III and the RR 3:1

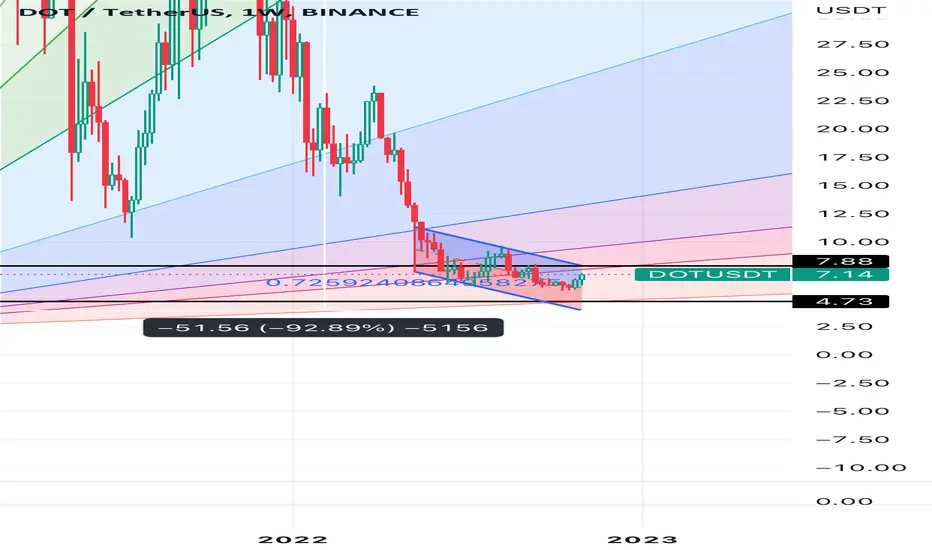
Polkadot - Market Structure Break!I got stopped out recently, but my bullish bias is still in play.
We have a bullish market structure break on the weekly with a retest of the bullish order block.

DOTUSDT - Buy setup!!DOTUSDT (1D Chart) Technical analysis
DOTUSDT (1D Chart) Currently trading at $6.4
Buy level: Above $6.32
Stop loss: Below $5.5
TP1:$6.84
TP2: $7.48
TP3: $8.1
TP4: $9.5
Max Leverage 3x
Always keep Stop loss
Follow Our Tradingview Account for More Technical Analysis Updates, | Like, Share and Comment Your thoughts
