Polkadot - Entered a LongJust entered a long on DOT.
- clear invalidation/risk (2.25%)
- clear targets above
- dotted line is where this could SFP, if that happens I may manually close
- plan to move stops up to break-even if I can
If this breaks down, it's pretty bearish so I have conviction knowing that I'm fine being wrong if the overall trend is still down, but if this continues higher it has potential
Lets go.
V
DOTUSDT

DOTUSDTHello Crypto Lovers,
Mars Signals team wishes you high profits.
This is a 4-hour-time frame analysis for DOTUSDT
There is R1 as our resistance area which includes the disability of the price to rise. S1 used to be another resistance area and S2 used to be a long-term resistance line t which the price disability to rise is clearly seen. At the moment, we have the fluctuation of price below R1 area and we predict it to continue its falling trend to reach S1. Via receiving some confirmation candles to rise, an increase is expected for it up to R1 or higher. Bear in mind that it might be possible for the price not to be supported at S1 and have more fall down to S2. Please activate your stop-loss points due to the unstable market situation.
Warning: This is just a suggestion and we do not guarantee profits. We advise you to analyze the chart before opening any positions.
Wish you luck

#Polkadot Bottoming up, DOT up 16% as Bulls Aim at $8Past Performance of Polkadot
Polkadot prices are down 30 percent from the August 2022 peaks, per the formation in the daily chart. Although the community expects DOT prices to recover after posting sharp double-digit losses from 2021 peaks, bears still have the upper hand. However, if DOT pierces above critical ceilings, the coin may surge to new Q4 2022 highs in a welcomed move.
#Polkadot Technical Analysis
Buyers are in control, and every low is an opportunity to accumulate. After sinking to register new 2022 lows in October, bottoming up from $5.74, the coin has since rallied 16 percent. At spot rates, there are bullish bars along the upper BB, pointing to solid upside momentum and support by traders. The spark is because of the wide-ranging bull bar of October 22 that pushed the coin above the resistance line, the middle BB, with expanding volumes. Even though the current coin's trade ranges are comparatively low to then, bulls have been resilient. Therefore, as long as DOT is above the middle BB and $6.28, the coin may race to September highs at around $8.
What to Expect from #DOT?
Buyers are bullish, and DOT is breaking out--a net positive. Prices are still within a bullish breakout formation as buyers press on. Since DOT is above the middle BB and $6.28 support, traders can target new Q4 2022 highs at $8 or better.
Resistance level to watch out for: $8
Support level to watch out for: $6.28
Disclaimer: Opinions expressed are not investment advice. Do your research.

Polkadot (DOT) - November 1Hello?
Welcome, traders.
By "following", you can always get new information quickly.
Please also click "Boost".
Have a good day.
-------------------------------------
(DOTUSDT 1W Chart)
It is important to be able to rise above the 11.72-14.93 section.
To do that, we need to see if we can sustain the price above 7.74.
(1D chart)
The key is whether it can be supported in the 6.28-6.60 section or higher.
If not, you need to make sure it is supported at 5.96 or higher.
If support is found above 6.60, it is expected to lead to an attempt to move above 7.16.
------------------------------------------------------------ -------------------------------------------
** All descriptions are for reference only and do not guarantee a profit or loss in investment.
** If you share this chart, you can use the indicators normally.
** The MRHAB-T indicator contains indicators that indicate support and resistance points.
** HA SRRC indicators are expressed as StochRSI(line), RSI(columns), CCI(bgcolor).
** CCI indicator is expressed as overbought range (CCI > +100) and oversold range (CCI < -100).
(Short-term Stop Loss can be said to be a point where profit and loss can be preserved or additional entry through split trading. It is a short-term investment perspective.)
---------------------------------

DOT | Ready for Massive Breakout..!!
#DOT Looks Promising here 🧐
- Forming Falling Wedge in 3-days TF Chart.
- RSI is Printing Bullish Divergence.
- Massive Buying Volume Coming in.
In Case of Wedge Upside Breakout, Expecting +300-360% Bullish Wave in Midterm.
Please like the idea for Support & Subscribe for More ideas like this and share your ideas and charts in Comments Section..!!
Thanks for Your Love & Support..!!

DOTUSDT4 options for entry ,waiting for CHoCH on 1-15m tf and open long or short , follow the risk management and don't forget to put stop loss

PolkaDot - A huge breakout or a trap?
Please do not buy DOT. There are many, many better coins. This analysis is for you if you want to get out of DOT or if you want to buy DOT.
This altcoin looks really bad. I would not buy it. But, it looks like we will have a relief uptrend.
I think we can definitely reach at least the 0.382 FIB retracement of this downtrend wave. This wave should be completed and we are looking for a bullish correction.
We have a descending parallel channel that has been destroyed by the bulls recently. So the bears should pause for a while.
As per my Elliott Wave analysis, there is an impulse wave, which is a great sign of weakness. This is probably not the bottom!
I expect a huge bear market after the retracement, so be careful with this altcoin.
Look at my ideas about APT, ETH, BTC, and inflation in the related section down below.
For more analysis, hit "Like" and "Follow"!

DOT DOT needs couple more weeks before hitting the targets above after or once finishing the ABC correction
peace :)

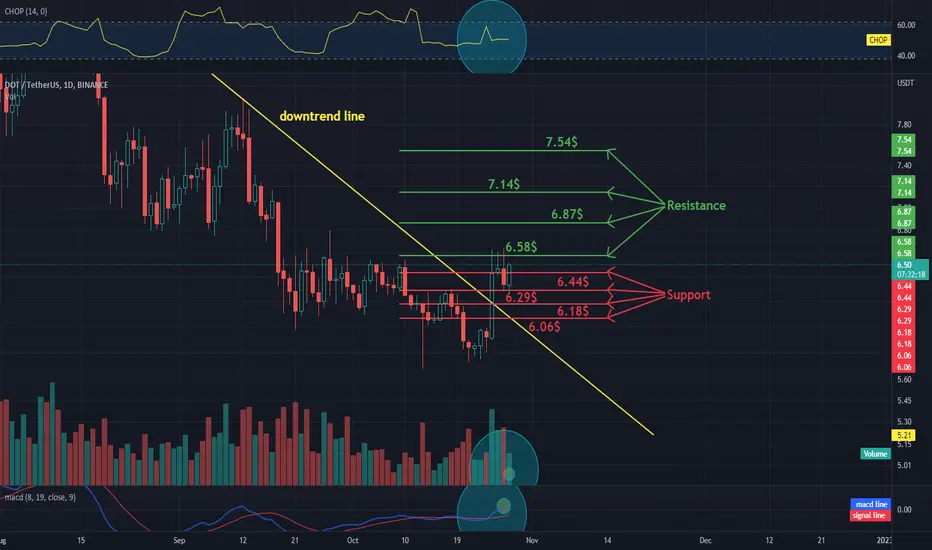
DOT / USDT 1DAY CHARTHello everyone, let's take a look at the DOTUSDT chart on the 1D interval, As you can see the price has broken the downtrend and is currently moving above it.
Let's move on to the designation of maintenance, and as you can see, the first maintenance is six dollars forty-four cents, the second is six dollars twenty-nine cents, the next six dollars eighteen cents, and six dollars six. cents.
In the same way, we will determine the resistance points that price has to overcome. The first resistance is six dollars fifty-eight cents, the second is six dollars eighty-seven cents, the third is seven dollars fourteen cents, and the fourth is seven dollars fifty-four cents.
Please look at the CHOP index which indicates we have some energy left, the MACD shows a local uptrend and we have a rising green candle in volume overnight.
DOTUSDT TRADING PLAN!!DOTUSDT has reversed making new LLs.
price can drop further more to 6.
i will open short in highlighted zone and exit at 6.2.

DOT is going to reach 4.9$ or 7.7$DOT is in a Descending Channel. The Price Right now is at the Top of the channel, which means The Price would Touch the Bottom of the channel. If that Happens,Price will reach around 4.9$. there is a little chance that a Bullish Break out Happens and the Price would reach 7.7$
-Dot is in a Descending Channel
-Price is at the top of the channel
-It will reach 4.9$ or Do a Break out to reach 7.7$ (Little Chance)
_ _ _ _ _ _ _ _ _ _ _ _ _ _ _ _ _ _ _ _ _ _ _ _ _ _ _ _ _ _ _ _ _
🌍Thank you for seeing idea .
Have a nice day and Good luck

DOTUSDT (sudden change)As we all seen “yesterday” candle stick momentum. And the direction the down trend has took. If price break the 6.79 price zone completely (50MA) support. Support could possibly hold, making DOT great for Buys.

DOT/USDT - LONG 1D TIME FRAME----- Welcome, dear followers! -----
- Here is my trading methodology. I trade with a normal system and analysis of resistance and support, as well as price reversal patterns.
- For the record, I do not place a stop loss within my trades. So that I only risk 1.5% of my total capital in order to support the loss due to a price reversal against me.
- If a price reversed against my expectation and touched the drawn line r3, then I transferred targets to the entry point and waited for the price to close at it with a loss equal to almost zero.
- Today's deal is shown in the chart, and here are the entry and exit points below.
-- Support me with numbers and follow up on my account for other deals in the future. Thank you for coming to this part. --
-------------------------------------------------------
⚡️⚡️ DOT/USDT ⚡️⚡️
Exchange: Binance Futures
Trade Type: Breakout (Long)
Leverage: Cross (2.0X)
Entry Orders:
1) 6.348 - 100.0% (239.575 USDT)
Take-Profit Orders:
1) 7.468 - 75.0%
2) 7.968 - 15.0%
3) 9.174 - 9.998%
Trailing Configuration:
Stop: Breakeven -
Trigger: Target (1)

DOTUSDT Long Setup!DOTUSDT Technical analysis update
Buy zone : $6.15 - $6.27
Stop loss : $5.70
TP 1 : $6.70
TP 2 : $7.40
TP 3 : $8.00
TP 4 : $9.00
Always keep stop loss

DOT DOT / USDT
Price is breaking out falling wedge
I marked the most important resistances in my chart
Crossing any resistance mean a strong potential visit to the next one
Best of wishes

Sign of Massive Volatility AheadHi, folks!
It´s been a very long time since my last post, as there have been very little few concrete signs of any direction.
Now, however, my hypothesis is that we´ll see large bouts of volatility in the time to come - where my bias leans towards a long position:
- Bollinger bands are the tightest we have seen since the beginning of the covid rally in 2020
- We seem to have solid support around the 18-19k level
- The long-term trend line since the beginning of the crash crosses the support line around this time
- We have had three consecutive volume-based buy signals that did not trigger a bounce
- Prices are now @ the lower bolliger band in the very tight channel
- We see a massive bullish divergence in 1D for both MACD and RSI
I am placing a long position, but remember that none can predict the future.
NFA.
DYOR.
Never take advice from someone without skin in the game - and never take the advice of others as given.
I wish you all well!

DOT Trading Range 4H (short)as you can see dot is near the Supply zone, you can short from here and I think our demand zone will break and we will go down,
remember to use stop in your trades,
I am in a short position, you can make your decision by chart and your analysis.

Dot LongDOT/USDT Long 10x
5.94 DCA 5.843
Tp1: 6.057
Tp2: 6.188
Tp3: 6.292
S/L: 5.7
Do you own Research. I am Not Financial Advisor

Polkadot (DOT) - October 25Hello?
Welcome, traders.
By "following", you can always get new information quickly.
Please also click "Boost".
Have a good day.
-------------------------------------
(DOTUSDT 1W Chart)
Whether or not it can move higher than 7.16 is the key.
(1D chart)
In order to get out of the mid- to long-term investment area, it should rise more than 7.16-7.74.
To do this, it is necessary to check whether it can be supported in the 6.28-6.60 section or higher.
------------------------------------------------------------ -------------------------------------------
** All descriptions are for reference only and do not guarantee a profit or loss in investment.
** If you share this chart, you can use the indicators normally.
** The MRHAB-T indicator contains indicators that indicate support and resistance points.
** SR_R_C indicators are displayed as StochRSI(line), RSI(columns), CCI(bgcolor).
** CCI indicator is expressed as overbought range (CCI > +100) and oversold range (CCI < -100).
(Short-term Stop Loss can be said to be a point where profit and loss can be preserved or additional entry can be made through split trading. It is a short-term investment perspective.)
---------------------------------

All eyes on DOTHey, DOT trading at critical level - interesting opportunity ahead... what do you think?

Dot (polkadot) No. 1 on development this year .
One on crypto that have a large market cap , with great value and staking rewards
Same of BTC CHART , but it is an alt so dont expect to be better .
At 5 $ it can be a good price to me .
GOOD LUCK
DOT :: Support/Resistance Levels :: 1DDOT price is hugging the resistance line trying to break through.
If successful and makes it support -- the next resistance line up is the major target.

DOT / USDT 4H CHART - Resistance and SupportHello everyone, let's take a look at the DOT to USDT chart over the 4 hour timeframe. As you can see, the price is moving above the local downtrend line.
Let's start with the designation of the support line and as you can see the first support in the near future is $ 5.75, if the support breaks down, the next support is 5.67, $ 5.60 and $ 5.53.
Now let's move from the resistance line as you can see the first resistance is $ 5.87, if you can break it the next resistance will be $ 5.96, $ 6.03 and $ 6.10.
Looking at the CHOP indicator, we can see that in the 4-hour interval we have a lot of energy, and the MACD indicator shows a local upward trend.
