#DOT/USDT#DOT
The price is moving in a descending channel on the 1-hour frame and is expected to continue upwards
We have a trend to stabilize above the moving average 100 again
We have a descending trend on the RSI indicator that supports the rise by breaking it upwards
We have a support area at the lower limit of the channel at a price of 4.50
Entry price 4.60
First target 4.72
Second target 4.85
Third target 4.99
DOTUSDT

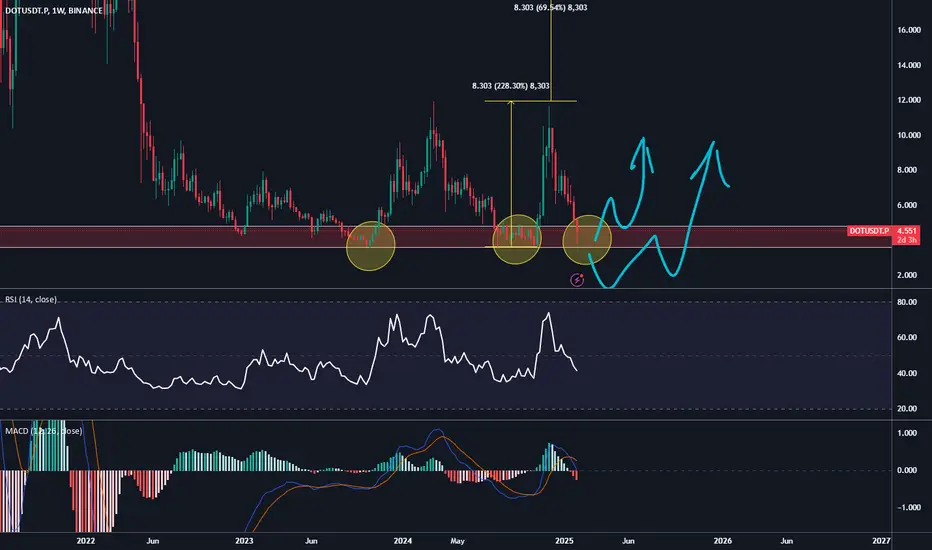
Polkadot 2025 Bull-Market: Long-Term Accumulation Zone ActiveThis is one of the easiest trades to take.
Polkadot (DOTUSDT) is now activating a long-term, bottom range, support and accumulation zone. Each time this price range becomes active what follows is a bullish breakout.
Here is the interesting part. This zone was first activated in late 2022, as part of the previous bull-market correction or bear-market.
In 2023 we had the recovery year so the growth period was very small compared to 2021. 2024 is the same, the "initial bullish breakout" and this is very small compared to 2021 and what happens now, 2025.
2025 is different. 2025 is bull-market year and goes in the same proportion with 2021 but much higher.
Why would 2025 end up producing much higher prices compared to 2021 rather than the same levels? Because the market is bigger now. Because the market is evolving and everything that is related to Cryptocurrency is being globally accepted. There are so many positive developments that it is hard to mention but let's give it a try.
The USA is now favorable towards the Cryptocurrency market. This might be the biggest development of all. Other countries that were unfavorable are following the USA and changing their policies.
Many countries are considering a "Bitcoin reserve." Unique dynamics developing now.
There are many new companies, many new projects and global adoption continues to expand. Crypto is now mainstream and legal all across the world.
This can make the 2025 bull-market the biggest bull-market in the history of Crypto. If it doesn't, well, prices are going up and that's more than enough for us to be bullish and to go LONG.
Polkadot is now going bullish. Prices will go literally off this chart.
We will visit the 2025 ATH potential in a new publication.
If you want the information now, you can always visit my profile and type DOTUSDT.
Thanks a lot for your continued support.
Let's trade together long-term.
Namaste.

dotMy personal opinion is to buy in the specified area below. It should be reviewed according to market conditions.

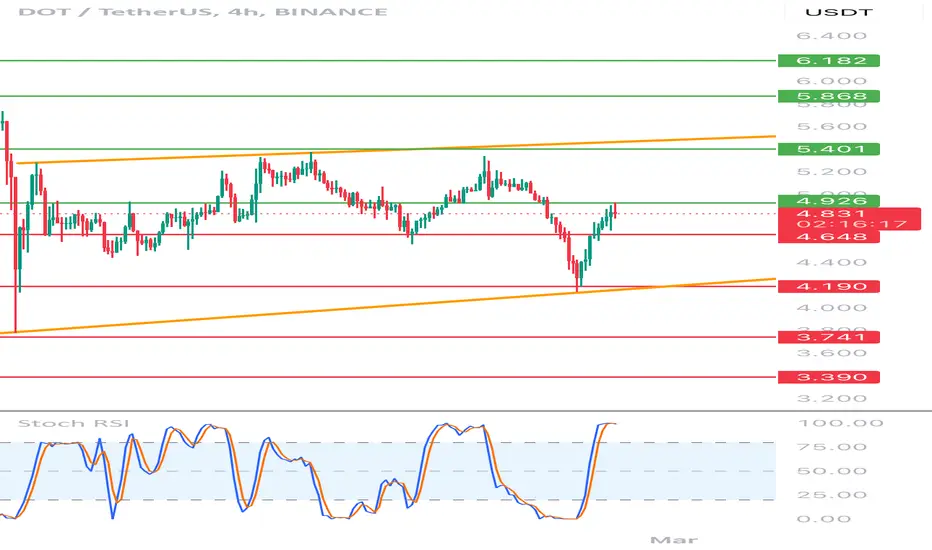
DOT/USDT 4H chart reviewHello everyone, let's look at the 4H Dot chart to USDT, in this situation we can see how the price moves in the local growth trend channel. However, let's start by defining goals for the near future the price must face:
T1 = $ 4.93
T2 = $ 5.40
Т3 = $ 5.87
T4 = $ 6.18
Let's go to Stop-Loss now in case of further declines on the market:
SL1 = 4.65 $
SL2 = 4.19 $
SL3 = $ 3,74
SL4 = $ 3.39
Looking at the RSI indicator, you can see the traffic above the upper limit of the range in the place where the price relief could be observed earlier.
PolkaDot DOT Needs To Crash More Hello, Skyrexians!
As you know, globally we are very bullish on BINANCE:DOTUSDT and our previous analysis on the weekly time frame is still valid, but locally it still has not reached the bottom. Current value of fear and greed index is extreme fear and it will not allow DOT to drop immediately, some bounce is anticipated, but after that bears can take control again.
Let's take a look at the daily chart. We can suggest you this Elliott waves counting, may be it's not 100% correct, but the only one thing we need to know. The drop, which we have seen on February 3 was the wave 3 according to minimum Awesome Oscillator value. While it has not crossed zero line price is in wave 4. Yesterday we had a chance to finish this night mare, but price is pumping again and it looks like it's going to reach $5.50 max and then continue printing wave 5 to the final target $1.9-$3.2. The key points for reversal is the appearing of green dot on Bullihs/Bearish Reversal Bar Indicator and divergence on AO.
Best regards,
Skyrexio Team
___________________________________________________________
Please, boost this article and subscribe our page if you like analysis!

DOT Eyes 170% Breakout as Nasdaq Sets to List Grayscale PolkadotPolkadot (DOT) is on the verge of a massive breakout as institutional interest in altcoin-based exchange-traded funds (ETFs) gains momentum. With Nasdaq officially submitting a filing to the U.S. Securities and Exchange Commission (SEC) to list and trade shares of the Grayscale Polkadot Trust (DOT), the stage is set for DOT to witness significant capital inflows, potentially driving a 170% rally.
Nasdaq Files to List Grayscale Polkadot ETF
The cryptocurrency investment landscape is undergoing a major shift as traditional financial institutions increasingly embrace digital assets. In a recent filing, Nasdaq submitted Form 19b-4 to the SEC, requesting approval to list and trade shares of the Grayscale Polkadot Trust. If approved, this move will provide investors with a regulated and institutional-grade avenue to gain exposure to DOT.
Grayscale Investments, the asset management firm behind the proposed ETF, has been aggressively expanding its crypto product offerings. Alongside the Polkadot ETF, the firm has filed for a spot Cardano ETF and an XRP Trust conversion. Other potential digital asset ETFs, including those tracking Solana (SOL), Dogecoin (DOGE), and Litecoin (LTC), are also being considered.
This filing follows a broader trend of growing institutional interest in crypto ETFs. In late January, asset manager 21Shares also applied for a spot Polkadot ETF, signaling heightened confidence in DOT’s long-term potential. The SEC now has 45 days to review Nasdaq’s application, after which it can approve, deny, or extend the decision-making process.
Technical Indicators Signal a 170% DOT Breakout
As of the time of writing, Polkadot is trading at $4.40, up 1.4% on the day. The technical outlook for DOT presents a highly bullish scenario, with the asset forming a textbook falling wedge pattern—a historically reliable setup that has preceded major upward price movements.
A closer examination of DOT’s price action reveals striking similarities to its March 2024 trading pattern, where the token surged 170% following a breakout from a similar wedge formation. Historically, DOT has exhibited a strong tendency to rally after breaking out of falling wedge patterns, making this a key inflection point for traders.
Momentum indicators further reinforce the bullish outlook. DOT’s Relative Strength Index (RSI) currently sits at 37, indicating that the asset remains in oversold territory with significant upside potential. With buyer accumulation increasing and selling pressure waning, DOT appears poised to capitalize on this dip before an explosive breakout takes place.

Polkadot - Macro VisionAs you can see, we have a macro range in construction.
The new Higher was very little low from the previously, but the good think its the Lower its higher from the recent one, so about this we have good and bad signs.
In that case, we need to wait for mor clarification, 1st that we need its a new Higher High on 4h tf, until that, we can retest demand zone like in 4 november, ant thats not good at all beacause will be to much pressure for the buyers , they acctually stressed a lot because a lot of them, didnt sell what they'v accumulated in the first Low from last year so, they are kind of desperate now for the liquidity and a new low can activate them to sell in loss , also because under 3.5 , there is a chance to visit 1.8 , and that means another -50% for their bags.
Offcourse, this is the bearish scenario.
The bullish one is that we have on daily a rejection from demand zone, this zone was bought very fast from buyers so , we need to see a recovery, a fast one to add optimism in market. Also , everyone , one month ago said that February its a bullish month , and this time looks different so, many of theese investors, now , are confused a lot. A bullish weekly close can activate them again , but until then, they will be very precaute.
My case: Im bullish bettwen 3.5 and actual price for accumulaton on SPOT.
On trading , i will not do nothing for now.

DOT ANALYSIS📊 #DOT Analysis : Update
✅There was a formation of Falling Wedge Pattern on daily chart🧐
We could expect a bounce from its major support zone.
👀Current Price: $4.930
🚀 Target Price: $6.400
⚡️What to do ?
👀Keep an eye on #DOT price action and volume. We can trade according to the chart and make some profits⚡️⚡️
#DOT #Cryptocurrency #TechnicalAnalysis #DYOR

DOT - Time to buy again!The price has formed a Triangle on the 4h time frame, and if it breaks out, it can drive the price up to around $6 .
Give me some energy !!
✨We spend hours finding potential opportunities and writing useful ideas, we would be happy if you support us.
Best regards CobraVanguard.💚
_ _ _ _ __ _ _ _ _ _ _ _ _ _ _ _ _ _ _ _ _ _ _ _ _ _ _ _ _ _ _ _
✅Thank you, and for more ideas, hit ❤️Like❤️ and 🌟Follow🌟!
⚠️Things can change...
The markets are always changing and even with all these signals, the market changes tend to be strong and fast!!

Last Shakeout Has Happened For PolkaDot DOTHello, Skyrexians!
We have seen many negative reactions on our recent analysis on XRP where we pointed out that it it in the distribution zone. We don't understand the sense t hold such overbought asset. Even if growth continues the potential is very low. It's much better to take a look at assets which are still at the bottom, like $BINANCE:DOTUSDT.
On the weekly time frame we can see that DOT tested the support level again and formed the confirmed green dot on the Bullish/Bearish Reversal Bar Indicator . This is the strong signal for the corrective global wave 2 finish. The next target is 1.61 Fibonacci extension at $88 at least. The maximal target is much higher at 2.61.
Best regards,
Skyrexio Team
___________________________________________________________
Please, boost this article and subscribe our page if you like analysis!

DOTUSDT SLIGHT BULISH"After a few days, I can see a bullish movement in DOTUSDT for the short term.
This analysis is based on recent candles, and the targets are close together, making them achievable in the short term.
Note: Please pay close attention to the danger zone and stop loss levels to manage your positions effectively.
Note: My ideas are not intended for any type of scalping or scalpers!
You can find the full list of my ideas here: www.tradingview.com
Here are some of my ideas:

DOT Holding Strong – A Rally to $11 Incoming?DOT has been consolidating within a well-defined range between support zone Green a $3.499 - $3.852 and the resistance zone Blue at $10.203 - $11.090 for an extended period. Recently, the price rebounded from the lower boundary of this range, signaling potential upward momentum. If bullish strength persists, in the coming days, DOT is expected to move toward the upper resistance marked in Blue, provided the bullish momentum continues.

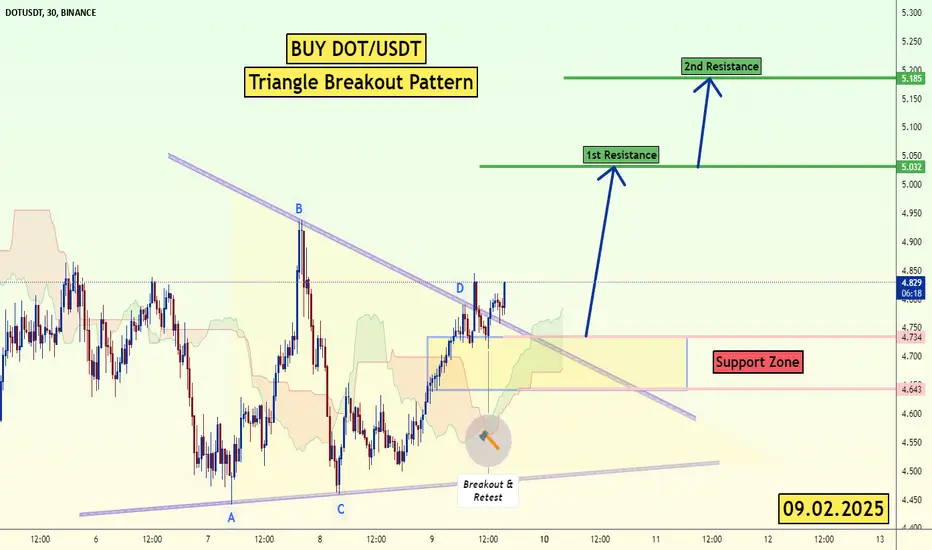
DOT/USDT Triangle Breakout (9.02.25)The DOT/USDT pair on the M30 timeframe presents a Potential Buying Opportunity due to a recent Formation of a Triangle Breakout Pattern. This suggests a shift in momentum towards the upside and a higher likelihood of further advances in the coming hours.
Possible Long Trade:
Entry: Consider Entering A Long Position around Trendline Of The Pattern.
Target Levels:
1st Resistance – 5.03
2nd Resistance – 5.18
🎁 Please hit the like button and
🎁 Leave a comment to support for My Post !
Your likes and comments are incredibly motivating and will encourage me to share more analysis with you.
Best Regards, KABHI_TA_TRADING
Thank you.
Be careful with DOT !!!The price has formed a bullish wedge on the 1h time frame, and if it breaks out, it can drive the price up to around $5.
Give me some energy !!
✨We spend hours finding potential opportunities and writing useful ideas, we would be happy if you support us.
Best regards CobraVanguard.💚
_ _ _ _ __ _ _ _ _ _ _ _ _ _ _ _ _ _ _ _ _ _ _ _ _ _ _ _ _ _ _ _
✅Thank you, and for more ideas, hit ❤️Like❤️ and 🌟Follow🌟!
⚠️Things can change...
The markets are always changing and even with all these signals, the market changes tend to be strong and fast!!

Will Dot break the barrier of the inheritance channel?Hello everyone, let's look at the 1D Dot chart to USDT, in this situation we can see how the price moves in a local strong tendu inheritance channel.
However, let's start by defining goals for the near future the price must face:
T1 = = $ 5.31
T2 = = $ 6.14
Т3 = 6.70 $.
T4 = $ 7.63
Let's go to Stop-Loss now in case of further declines on the market:
SL1 = $ 4.47
However, we still have a very strong support zone that has repeatedly maintained the price from a further correction zone from $ 3.95 to $ 3.56.

Alt season could already be here, only is winter seasonThe Crypto Market at a Crossroads: What’s Could Next for Bitcoin and Altcoins?
The cryptocurrency market is at a critical juncture, and the narratives being pushed by crypto influencers might not be telling the full story. Over the next weeks and months, the altcoin landscape could undergo significant changes, and there are signals emerging that few are discussing. In this post, I’ll analyze Bitcoin, altcoins, and Bitcoin dominance and what I expect in the coming months.
Bitcoin’s Current Position: Are We Near the Top?
When analyzing Bitcoin, it’s crucial to zoom out and assess the bigger picture. On a weekly chart, Bitcoin’s price action suggests that we might be nearing a top. While some argue that the peak has already occurred, the current structure indicates that Bitcoin could enter a sideways/ downward movement like we saw last year.
If Bitcoin continues to move sideways, altcoins are likely to follow suit. However, during these phases, some altcoins may experience brief runs, especially if Bitcoin dominance starts to decline.
But here’s the catch: Bitcoin dominance has been steadily rising since Bitcoin’s bottom, which is unusual. Typically, during the late stages of a cycle, Bitcoin dominance drops as altcoins surge. This time, however, the landscape seems different.
Altcoin Season: A Muted Rally?
The idea of a massive altcoin season, where all altcoins surge simultaneously, might be a thing of the past. While some coins like BINANCE:SOLUSDT have already seen significant runs (from nearly $80 to $300 top in one year), the broader altcoin market has not experienced the same explosive growth. Instead, only a select few altcoins made significant moves.
This doesn’t mean that altcoins are dead. There will still be opportunities, but they will likely be more selective. Coins that have already made substantial gains, like Solana, may have already topped out.
Going forward the key should be to focus on coins that show strong volume breakouts and price action, rather than holding onto underperforming assets.
Bitcoin Dominance and the Changing Landscape
Bitcoin dominance has been on an upward trajectory, which is unusual for this stage of the cycle. Historically, Bitcoin dominance falls as altcoins begin to rally.
However, this time, the dominance chart suggests that the market dynamics are shifting. While a drop in Bitcoin dominance is still possible, it may not be as pronounced as in previous cycles.
This changing landscape could be due to the sheer number of altcoins in the market. With thousands of coins vying for attention, there simply isn’t enough liquidity to pump all of them. This dilution effect means that only a handful of coins will likely see significant gains, while the majority will continue to underperform.
The Role of Meme Coins and Newer Projects
One of the standout trends in this cycle has been the rise of meme coins and newer projects. Coins like BINANCE:SUIUSDT , which launched during this cycle, have already broken their all-time highs. However, even these newer coins may be entering a bear market phase.
The market is saturated, and without a significant influx of liquidity, it’s unlikely that we’ll see another massive altcoin season.
Meme coins, in particular, have been a double-edged sword. While they’ve provided some of the most explosive gains, they’ve also drained liquidity from the broader market.
This extraction of value has made it harder for other altcoins to gain traction, further complicating the market dynamics.
The Bigger Picture: A Potential Bear Market
Looking at the broader market, there’s a growing possibility that we could be entering a bear market.
The sheer number of coins in the market, combined with the lack of liquidity, suggests that the crypto space is due for a significant shakeout.
Coins like BINANCE:DOTUSD , CAPITALCOM:FILUSD and even BINANCE:ADAUSDT , which have been in a bear market since 2021, are a prime example of this trend.
Many altcoins are already down 80-90% from their all-time highs, and the chances of them recovering are slim.
This is why it’s crucial to focus on coins that have already established a bull trend and are hovering around their support zones, as they have a higher probability of breaking out and continuing their upward trajectory.
Key Takeaways and What to Watch For
1. Bitcoin’s Sideways Movement: Bitcoin is likely to move sideways or slightly downward in the coming weeks, which could create opportunities for select altcoins.
2. Selective Altcoin Runs: Not all altcoins will rally. Focus on coins with strong volume breakouts and price action.
3. Bitcoin Dominance: Keep an eye on Bitcoin dominance. A drop could signal a brief altcoin rally, but it may not be as significant as in previous cycles.
4. Meme Coins and Newer Projects: While meme coins and newer projects have seen gains, they may be entering a bear market phase. Be cautious with these assets.
5. Long-Term Bear Market : The crypto market could be entering a bear market. Focus on preserving capital and avoid holding onto underperforming assets.
Final Thoughts:
The crypto market is at a crossroads, and the next few months could be pivotal. While there will still be opportunities, they will likely be more selective and harder to come by.
By focusing on strong projects with solid fundamentals and avoiding the hype, you can navigate this changing landscape more effectively.
Remember, the key to success in crypto is not just about making money—it’s also about avoiding losses.
Best of Luck!
Mihai Iacob

DOT/USDT Weekly Analysis🔹 Key Resistance & Spot Trigger:
The chart indicates a major resistance level around $10.465, where the price previously faced rejection. This zone acted as a spot trigger, leading to a sharp decline in price.
🔹 Price Action & Trend:
After the rejection at the resistance, the price dropped significantly, aligning with the downward movement of the orange moving average. Currently, the market is testing a key support zone between $3.90 - $4.50.
🔹 Volume Analysis & Sales Pressure:
The increase in sales volume suggests that sellers are still in control. However, if the price finds strong support in the highlighted box, we may see a potential reversal or accumulation phase.
🔹 Future Outlook:
📉 If the support fails, further downside towards lower historical levels is possible.
📈 If buyers step in, a recovery towards the $6 - $7 resistance zone could be expected.
💡 Trading Plan: Watch for bullish signals within the support area before entering a position. Confirmation via volume and candlestick patterns will be crucial.

We are so close!I love Polkadot and community of this coin. We all know BINANCE:DOTUSDT made huge impulse about a year ago and still consolidating around it. Checking 4.5 area is crucial for BINANCE:DOTUSDT , because that means it is triple bottom which is a huge reversal pattern. If we ever see candle below 3.5 that is the point we consider Long-term long position in either Spot or Futures. Also MACD and RSI making divergence in 1W timeframe.
I will be taking profits at 20, 24, 32, 55 ( ATH ).
TradeCityPro | DOTUSDT Weekly Range Boxes of Altcoins👋 Welcome to the TradeCityPro channel!
Let’s analyze DOT, one of the popular cryptocurrencies, and identify its potential entry points.
🌐 Overview Bitcoin
Before diving into the DOT analysis, let's check Bitcoin on the one-hour timeframe. Due to today's NFP news, Bitcoin has experienced volatility and once again got rejected from the critical $100,000 psychological resistance.
This rejection has led to selling pressure, pushing Bitcoin back toward the 96,445 support, which now has a higher probability of breaking due to this rejection. Additionally, Bitcoin dominance remains within the defined range, showing a slight upward bias.
If we see a correction, altcoins are likely to experience further declines, and I don't expect any major movements until the end of the week.
🕵️♂️ Previous Analysis
In our previous DOT analysis, we expected a decline after breaking $6.554, leading to a test of the daily range high. However, recent market conditions caused DOT to wick down as low as $3.743, which is its strongest support level.
📊 Weekly Timeframe
DOT remains inside its weekly range, and despite its 170% range, it is still considered ranging rather than trending.
I've previously discussed "money traps", and this applies here too. You can buy at $3.719, but without momentum, your capital could remain stuck in this asset for a long time. Who knows—could DOT be the next LUNA?
Considering these factors, I prefer either a strong reaction at $3.719 or a breakout above $10.309 before entering a position. I’d rather focus on coins that confirm a breakout before entering**, like Jasmy, which recently provided a 400% gain.
For exiting, if $3.719 support breaks, it's better to accept the loss and exit. Later, if a buy signal reappears, you can re-enter using the same USDT amount, instead of holding and losing more DOT.
📈 Daily Timeframe
On the daily timeframe, DOT faced a strong rejection at $10.725, forming consecutive lower highs and lower lows. However, recent selling pressure appears to be weakening, and we are currently sitting on the $4.626 support.
Additionally, a trendline is forming, and if DOT rejects from it in the future, this would indicate continued bearish momentum, providing an opportunity to keep short positions open from higher levels.
I personally believe DOT may enter a range for some time, allowing traders who made emotional decisions due to FOMO and market volatility to reassess. For now, I expect the $3.719 support to hold.
That doesn’t mean we should buy immediately. Our strategy is clear , buy after a breakout above $10.725 , Wait for an accumulation range to form or Look for a sharp upward move, retest a key trigger level, and confirm a breakout before entering.

My Insight on DOT came True! what's next?BINANCE:DOTUSDT
as I expected, Dot reached the support level I mentioned before!
Now I expect it ascend from here and reach around 6.3!
⚠️ Disclaimer:
This is not financial advice. Always manage your risks and trade responsibly.
👉 Follow me for daily updates,
💬 Comment and like to share your thoughts,
📌 And check the link in my bio for even more resources!
Let’s navigate the markets together—join the journey today! 💹✨

#DOT/USDT#DOT
The price is moving in a descending channel on the 1-hour frame and is adhering to it well and is heading to break it upwards strongly
We have a bounce from the lower limit of the descending channel, this support is at a price of 4.10
We have a downtrend on the RSI indicator that is about to be broken, which supports the rise
We have a trend to stabilize above the moving average 100
Entry price 4.60
First target 5.40
Second target 6.02
Third target 6.80

DOTUSDT 1WDOT ~ 1W Analysis
#DOT This is the lowest support for now. Buy from here if you still have a Conviction on this coin with a minimum target of 20%+

