DOTUSDT

DOT/USDTFalling Wedge
A falling wedge is always a bullish pattern. By definition, a falling wedge always follows a major rising trend and has 3 stages: major rising trend, correction, and continuation of a rising trend.
This pattern is appropriate in denoting a bullish momentum in the market in the future.

DOT - We are about to break 44 DAYS old trendline!Reasons to take long:
⭐️ BTC bullish
⭐️ Trendline is 44 days old
⭐️ Trendline is clean
⭐️ In the end of local formation
⭐️ Slowly squeezing to the trendline
⭐️ 4th touch
⭐️ 35 ATR
⭐️ Over VWAP
Will enter when price squeezes to the trendline on 5m timeframe, the base will form and the tape will get faster.
If you don't understand the previous sentence, just use swing stop-loss 3-5%
Fix profit by parts:
1% - 1/3
2% - 1/3, stoploss to breakeven
What's left, hold to the maximum
What do you think of this idea? What is your opinion? Share it in the comments📄🖌
If you like the idea, please give it a like. This is the best "Thank you!" for the author 😊
P.S. Always do your own analysis before a trade. Put a stop loss. Fix profit in parts. Withdraw profits in fiat and reward yourself and your loved ones

Polkadot Bullish Divergence Bull Div forming here on the daily and 3 touches of LL's in price and HL's in RSI.
Could see some nice relief soon if the market allows it and bitcoin chills.

Polkadot longPolkadot broke trough the descending trendline. Asset broke trough the resistance level. Bullish movement to resistance level at 7.345 is expected to happen.

DOT - Falling WedgePolkadot has formed a falling wedge on this four hour timeframe
Falling wedges are a bullish pattern and dot if a break out occurs will act bullishly

DOT bouncing off support and in descending wedge DOT is bouncing off the lower blue support line that I have (picture below)
This is a very strong support level, and on top of that it is doing this in a descending wedge pattern, which is a special bullish pattern.
HOWEVER, this coin has NOT BROKEN THE WEDGE YET.
That means, wait for the break, then go long.
First resistance would be red line,
second resistance is around $16.

DOTUSDT short term biasKeeping in view the situation of the BTC and bearish cycle on macro-level, DOT is poised to fake out or fake impulse towards upside, which will trap the bulls and it will suddenly break down and take a dip. Rate hikes and inflation will have its effect on the BTC so as on the ALTS.
Areas to keep in my mind for shorting are 8.4 and 7.6. I
t might drop from the current price as well. More confirmation for short entries can only be taken on lower time frames if some one wants to take short positions.

DOT/USDT 4h Update!!Dot/usdt is making brodening wedge pattren below the decending triangle . We have a strong support at 6$ thts why decending triangle is not gonna play out. Dot have to break the uper trendline to gain some power.

DOTUSDT 4h : Short or What?Hello Everyone :)
As you can see the price is at the support zone and if its break this support i will open a short position ...
⚠️ This Analysis will be updated ...
📅 07.12.2022
⚠️(DYOR)
❤️ If you apperciate my work , Please like and comment , It Keeps me motivated to do better ❤️

DOT/USDT SHORT RISKY 15MI looking bearish trend in 15 minutes time frame found hanging men on top
entry
stop loss
take profit mentioned in chart

DOT-USDT chart analysisPolka DOT is forming a descending Broadening pattern in the 1 hourly time frame.
In Short term expect DOT to have a come down before having a lag up toward main resistance

dotusdtYou can open a short or long position by breaking and stabilizing the price after each of the lines.
Be a little cautious about the long position.
Do not enter before the candle closes and manage your risk.

DOTUSDTHello Crypto Lovers,
Mars Signals team wishes you high profits.
This is a 4-hour-time frame analysis for DOTUSDT
As we analyzed on July 5, we predicted a rising trend and now you observe that the price faced a rise in the days after that date. Now we have R3 and R1 which used to be support areas. R2 is a resistance line and the disability of the price to rise is clear. And S1 is our support area that includes the support of the price since the past. At the present, we have the fluctuation of the price over S1 and we predict it will rise to R1 and then it may be rejected and fall to S1. In case we receive confirmation candles over R1 and the price is able to fix itself, then a rise would be waiting for it.
Warning: This is just a suggestion and we do not guarantee profits. We advise you to analyze the chart before opening any positions.
Wish you luck

DOTUSDT 3D Medium-term trade with P/L = 10/1Today we will look at the global chart of the DOTUSDT trading pair on a 3-day time frame.
The last global idea on DOTUSDT we published 8 months ago, then the downward trend began, which continues to this day.
At that time, DOT buyers were very determined to continue the growth, because on 11.11.2021, the first parachains in the Polkadot ecosystem were to be launched.
But the situation on the Dotusd chart that we saw suggested that the price will soon begin to decrease, from $50 at least to the $14-18 zone.
Of course, we were criticized then in the comments under the idea, that we do not understand what we are writing, only growth and nothing more wrote users TW...
But what do we see now? The DOT price is 2 times lower than our pessimistic forecast from the previous idea.
Now DOT buyers are trying not to let the DOTUSDT price fall below the liquidity level of $6.50
Not bad conditions to try a medium-term trade for a small part of the deposit:
Entrance $6.50-6.70
Stop $6.365 (-5%)
Take $9.95 (+48.5%)
The profit/loss ratio is 10/1
Below $6.36, it is most likely not worth holding DOT, because then fall can continue to $5-5.20 area
_______________________________
Since 2016 , we have been analyzing and trading the cryptocurrency market.
We transform our knowledge, trading moods and experience into ideas. Each "like under the idea" boosts the level of our happiness by 0.05%. If we help you to be calmer and richer — help us to be happier :)

Polkadot (DOT) - July 11Hello?
Traders, welcome.
By "following", you can always get new information quickly.
Please also click "Like".
Have a good day.
-------------------------------------
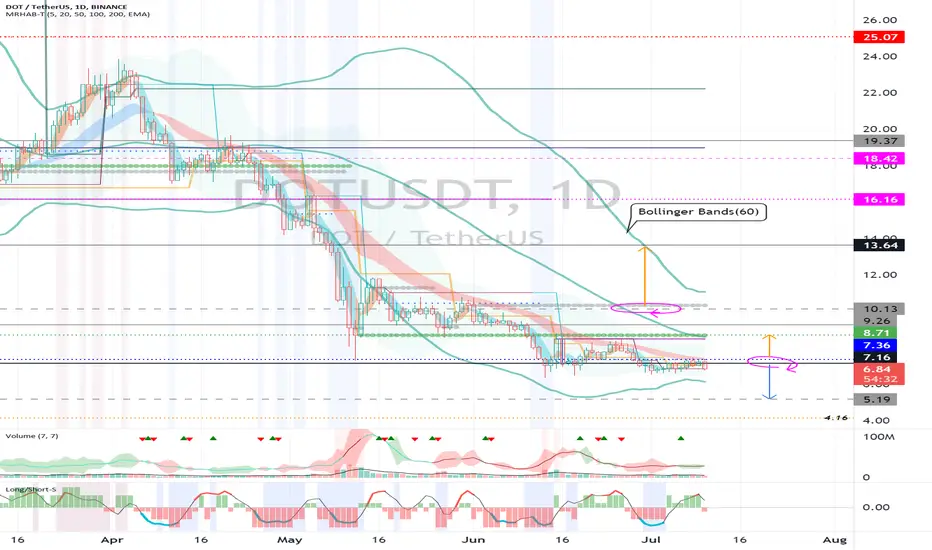
(DOTUSDT 1W Chart)
Below 10.13 is likely to be a mid- to long-term investment area.
In particular, 7.16 and below are likely to be long-term investment areas.
Therefore, it is important to know whether it can move higher than 7.16.
(1D chart)
The contraction period of the Bollinger Bands (60) is short.
Therefore, a trend is expected to form in the near future.
It is expected that the period from the decline of 7.16 to the vicinity of 5.19 until it rises again to the vicinity of 7.16 is expected to be short.
Therefore, if you fail to overcome the psychological burden and make a stop loss when it leads to a further decline, there is a high possibility of a double loss.
Therefore, it is recommended to create room to buy when the price is falling.
The market can be very volatile if the BTC dominance declines while the BTC price is still in a downtrend.
It can be characterized by repeated short-term spikes and dips.
You need to think about whether you can't take advantage of it with your trading skills.
You should try to earn cash income by short-term trading coins (tokens) that you currently have or increase your holdings.
Otherwise, starting an investment in a new coin (token) may require a long period of time to turn into a profit even if the coin market turns upward as the dispersion of funds accelerates.
------------------------------------------------------------ -----------------------------------------------------
** All indicators are lagging indicators.
Therefore, it is important to be aware that the indicator moves accordingly with the movement of price and volume.
However, for the sake of convenience, we are talking in reverse for the interpretation of the indicator.
** The MRHAB-T indicator used in the chart is an indicator of our channel that has not been released yet.
** The OBV indicator was re-created by applying a formula to the DepthHouse Trading indicator, an indicator disclosed by oh92. (Thanks for this.)
** Support or resistance is based on the closing price of the 1D chart.
** All descriptions are for reference only and do not guarantee a profit or loss in investment.
(Short-term Stop Loss can be said to be a point where profit and loss can be preserved or additional entry can be made through split trading. It is a short-term investment perspective.)
---------------------------------