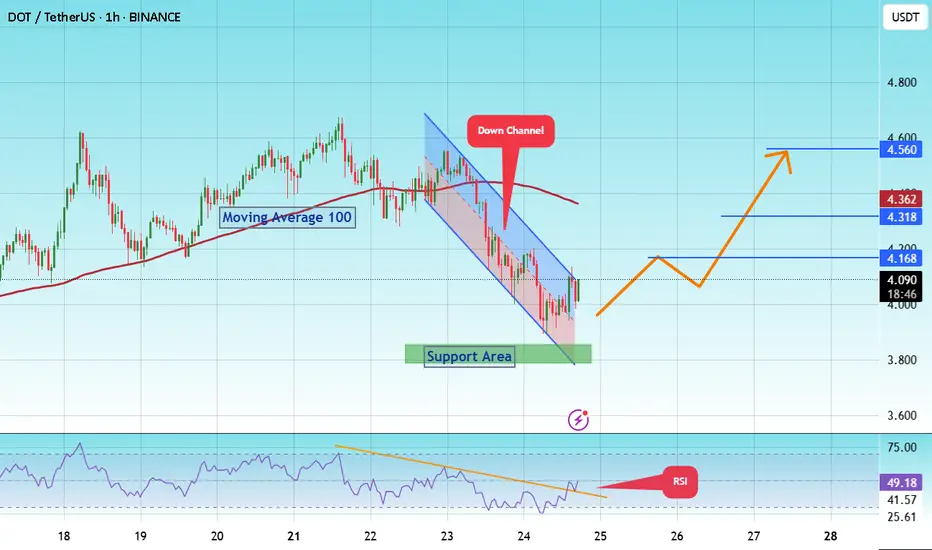
#DOT/Eyes 15% Rally, Targeting Key $ 4.560 Resistance Level#DOT
The price is moving within a descending channel on the 1-hour frame and is expected to break and continue upward.
We have a trend to stabilize above the 100 moving average once again.
We have a downtrend on the RSI indicator that supports the upward break.
We have a support area at the lower limit of the channel at 3,870, acting as strong support from which the price can rebound.
We have a major support area in green that pushed the price higher at 3,800.
Entry price: 4.084
First target: 4.168
Second target: 4.318
Third target: 4.560
To manage risk, don't forget stop loss and capital management.
When you reach the first target, save some profits and then change your stop order to an entry order.
For inquiries, please comment.
Thank you.
Dotusdtshort
#DOT/USDT#DOT
The price is moving within a descending channel on the 1-hour frame, adhering well to it, and is heading towards a strong breakout and retest.
We are experiencing a rebound from the lower boundary of the descending channel, which is support at 4.120.
We are experiencing a downtrend on the RSI indicator, which is about to break and retest, supporting the upward trend.
We are heading towards stability above the 100 Moving Average.
Entry price: 4.170
First target: 4.220
Second target: 4.246
Third target: 4.323

#DOT/USDT#DOT
The price is moving within a descending channel on the 1-hour frame, adhering well to it, and is heading towards a strong breakout and retest.
We are seeing a bounce from the lower boundary of the descending channel, which is support at 4.05.
We have a downtrend on the RSI indicator that is about to be broken and retested, which supports the upward trend.
We are looking for stability above the 100 moving average.
Entry price: 4.08
First target: 4.10
Second target: 4.15
Third target: 4.20

#DOT/USDT#DOT
The price is moving within a descending channel on the 1-hour frame, adhering well to it, and is heading for a strong breakout and retest.
We are seeing a bounce from the lower boundary of the descending channel, which is support at 4.22.
We have a downtrend on the RSI indicator that is about to be broken and retested, supporting the upward trend.
We are looking for stability above the 100 Moving Average.
Entry price: 4.30
First target: 4.37
Second target: 4.46
Third target: 4.57

#DOT/USDT#DOT
The price is moving in a descending channel on the 1-hour frame and is adhering to it well and is heading to break it upwards strongly
We have a bounce from the lower limit of the descending channel, this support is at a price of 4.10
We have a downtrend on the RSI indicator that is about to be broken, which supports the rise
We have a trend to stabilize above the moving average 100
Entry price 4.60
First target 5.40
Second target 6.02
Third target 6.80

DOTUSDT 1WDOT ~ 1W Analysis
#DOT This is the lowest support for now. Buy from here if you still have a Conviction on this coin with a minimum target of 20%+

#DOT/USDT Ready to go higher#DOT
The price is moving in a descending channel on the 1-hour frame and sticking to it well
We have a bounce from the lower limit of the descending channel, this support is at 6.60
We have a downtrend on the RSI indicator that is about to be broken, which supports the rise
We have a trend to stabilize above the moving average 100
Entry price 7.00
First target 7.30
Second target 7.83
Third target 8.43

#DOT/USDT#DOT
The price is moving in a descending channel on the 1-hour frame and sticking to it well
We have a bounce from the lower limit of the descending channel and we are now touching this support at 0.400
We have a downtrend on the RSI indicator that is about to be broken, which supports the rise
We have a trend to stabilize above the moving average 100
Entry price 1.10
First target 4.26
Second target 4.40
Third target 4.62

#DOT/USDT#DOT
The price is moving within a descending channel pattern on the 12-hour frame and is expected to break upwards
We have a downtrend on the RSI indicator that has been broken upwards and we have a tendency to stabilize above it
We have a major support level in green at a price of 4.20
We have a tendency to stabilize above the moving average 100 which supports the rise
Entry price 4.67
First target 5.40
Second target 6.02
Third target 6.70

#DOT_#CRYPTO_#BEARISH_ShortScript still not gettng momentum after continually trading inside the parallel channel, it finally break down and printed new lower lows. Still the momentum is week and looks like it will soon test the levels marked on the chart.
#DYOR (Do your own research)

This is in resistance (DOT)❤️❤️Thanks for boosting 🚀 and supporting us!
📈we are in big renge in daily and sell in ressistance.
📊 (sell) : 7.313
🔴 Stop Loss : 7.960
🎯 Take Profit : 6.558 - 5.968
🔗 For more communication with us, In the footnote and send a message in TradingView.
👨🎓 Experience and Education: Our trading team has five years of experience in financial markets, especially cryptocurrencies.

Polkadot - $3 Looms as Sellers DominateHi Traders, Investors and Speculators of Charts📈📉
Polkadot is currently trading 93% under it's ATH. Although this is bad news for most bag holders, the good news is that the bottom is either in - or very close.
There's no doubt that a bullish cycle is overdue, but not just yet. Technical indicators on lower timeframes show bears are still dominating, and there's a chance the price could fall lower once more before the accumulation phase finishes.
Incase you missed yesterday's update on Bitcoin, find it here 📈
_______________________
📢Follow us here on TradingView for daily updates and trade ideas on crypto , stocks and commodities 💎Hit like & Follow 👍
We thank you for your support !
CryptoCheck
BINANCE:DOTUSDT BINANCE:DOTUSD

DOTUSDT likely heading down for daily support around 5.55The price has close below the weekly support which is not a good sign. It might reclaim it this week if it is still bullish but from probability point of view the price seems to be going lower from here. I expect the price to reach to the next weekly support which is sitting around 4.5 zone but there is a daily support in between which may hold the price. Therefore, let us focus on the daily support as a target first and then reevaluate the weekly support target. The daily support is sitting around 5.55.

DOTUSDT at resistance, likely to retrace to 5.848The price is currently at resistance and a short is favorable. I believe the price can reach to the range low at 5.83.

DOT/USDT Perp, new ATL coming?? Greetings all, I am back with my analysis of DOT/USDT Perp. As the current mini bull run is reaching its conclusion, it's my belief that the bear market has not fully subsided. The current market price for DOT/USDT is $6.656. After having taken some profits from a previous long position, I think it is prudent to consider a retracement.
A close examination of the higher time frame market structure reveals that DOT/USD has yet to clear the previous November high. This is a crucial technical level, and as a result, I believe that a retracement to the $5 area is likely. In light of this, I have taken a small short position with a target of $5.5, where I plan to take profit. My invalidation level has been marked on the chart.
As always, I advise all traders to conduct their own research and manage their risk appropriately.

"DOTUSDT" SHORT NEXT MOVE!!!!!!!!!Here we can see that "DOTUSDT" in 1 day time frame has a RESISTANCE at the zone at "6.363" and it can take REJECTION from that zone. And it take correction to the zone "5.024" as there is a 0.6 fibbonachi level.
ENJOY!!!!!!!!!!!!

DOTUSDTDOT was performing in a really good manner but somehow failed to gain more up moves due to recent rising wedge pattern formed and I believe it will gain more volume to grow more when it reaches the $5 support because it is in falling wedge pattern in 1D timeframe which possibly may give us more upside movement in mid & long term. I will keep updating you.
I hope you will like this idea. Please don't forget to like and follow for more upcoming ideas :)
PLESAE NOTE: Kindly manage your risk! This analysis is based on the chart trend, pattern, EMA & RSI . This is only for the education purpose.

DOTUSDTwaiting for CHoCH on 5-15m tf and open short, follow the risk management and don't forget to put stop loss

DOTUSDT2 options for entry ,waiting for CHoCH on 5-15m tf and open long or short, follow the risk management and don't forget to put stop loss

DOTUSDT4 options for entry ,waiting for CHoCH on 1-15m tf and open long or short , follow the risk management and don't forget to put stop loss

DOTUSDT TRADING PLAN!!DOTUSDT has reversed making new LLs.
price can drop further more to 6.
i will open short in highlighted zone and exit at 6.2.

DOTUSDT3 options for entry ,waiting for BOS and open short or long , follow the risk management and don't forget to put stop loss

DOTUSDTPERPETUAL TRADE IDEAIdea is written on the chart.
Idea is written on the chart
Idea is written on the chart
Idea is written on the chart
Idea is written on the chart
Idea is written on the chart
