SPX | 108D | KING PUMPLow volume, high spot in the sky. mmmm... and plus the slicer! something has to give. Will be playable only on Jun 1st 2019.
Cheers,
Keops
Double

CADJPY BEARISH MOVE AFTER A POSSIBLE DOUBLE TOP CADJPY POSSIBLE DOUBLE TOP FORMATION RESPECTING A RESISTANCE LEVEL

UK oil ShortThe position to be immediately executed is short UKOIL due to the fact it is trading near a previous resistance level which is seeming to be a good market structure level to enter from. The RSI again is not very helpful in conformation but the MA shows us that the price is trading above and therefore price could potentially need to let off steam before continuing up. In addition if we use the bodies of the candles focus of our analysis rather than the wicks it could be said that a double top is forming and for that reason we would want to set a TP near the region the price came from. The wicks can be used as SL areas to give a good Risk to Reward 3:1 in addition further moves south will be captured by the pending order which was placed earlier.


ZCASH/BTC AnalysisZCASH/BTC:
1) Falling wedge breakout
2) Possible double bottom
3) Both RSI and MACD bullish on the daily
4) Volume picking up, still lacking though.
5) Keep your eye on bitcoin as it influences the entire market.

2019 S&P 500 Death Cross (34 wk SMA cross 340 wk Double Hull )2015 S&P 500 Death Cross (34 wk SMA cross 340 wk Double Hull )

2015 S&P 500 Death Cross (34 wk SMA cross 340 wk Double Hull )2015 S&P 500 Death Cross (34 wk SMA cross 340 wk Double Hull )

Bitcoin WEDGE Rising wedgeHey all. Bitcoin is currently trading inside a bearish rising wedge with bearish divergence. I think we could do one more push towards $4180 before I expect this pattern breaking down again. The success-rate of this pattern is high. I am still waiting for a new low below 3k, and I am short from $4170 with my long hedge from $3300.

PKG ShortSPY breakdown leading to overall downtrend, PKG seems to have fizzled out of its ER catalyst cannot hold these levels I predict its going lower.
Strike $85 $2.4 Stop at 1.2
May go lower if spy continues

XLF Double Top?Seems like we're done with another real estate and stock market bubble, could be a double top on XLF.

BTC BUY RETEST OF INVERSE HEAD AND SHOULDER/DOUBLE BOTTOM8 minutes ago
btc still oversold on daily
buy retest of inv hands
7 minutes ago
Comment: DOUBLE BOTTOM TOO
TARGET MATCH

SPX500 | 3H | DOUBLE ELLIPSE SETUPPrice captured by downward ellipse.. looks like market participants is slowly realizing that the punch bowl will not be refilled..
Busting 2nd ring is not a positive indicator..
Cheers,
Keops

falling wedge or bearflag? dead cat or possible double bottominside what started out looking like a descending triangle bearflag we have developed a small falling wedge(bullish)on the 1hr chart...shown here is the 4hr chart. The initial 4 hour descending triangle we have already broken below but the whales seem to be holding things above 4k thus no breakdown was triggered casting much doubt on tis being a descending triangle....this could lead to a potential double bottom with 4050 and 4090 however it could still end up breaking below for now it slightly favors the upside temporarily but since that probability is only slight..this idea will remain neutral...this is more or less a no trade zone until it chooses a clear path.


Price Action Video - Trading Setup #4 -S&R and FibonacciHello Traders,
Find out my thought process when I look for trades.
This video covers patterns, fibs and S&R levels.
Enjoy!
Kaetea Ng

Possible Double TOP ???DXY have bounced off from the top resistance trend line before and I am looking out for a double top to form another rejection of trend line again...

BCCash's double bottom has triggered!As I had predicted in my previous bit coin cash idea on here we reached the neckline of the double bottom on BCash and have finally triggered the breakout...the price target I have listed here is a great palce to limit sell, although we may run into decent resistance at the 1 day 200ma(in blue). We may also start to wick down just before this target too so a pip ro 2 below it as a limit sell isnt a bad call either...of course there's also a chance that fomo could allow us to send a bull wick a couple pips above this target as well. Whether or not your limit sell triggers as long as you got into this trade near the neckline a market sell will still get you plenty profit. *not financial advice*
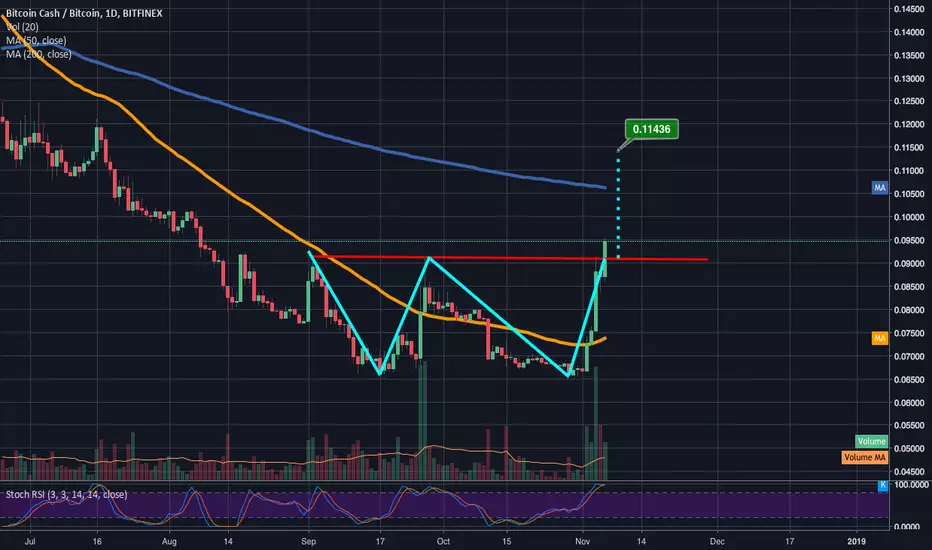
BCH on a bullish rampage should reach well above 1day 200ma… BCH on a bullish rampage should reach well above 1day 200ma before any sort of major correction. Even when we get there the correction could be quite mild before another leg up we will have to assess the overall confluence of indicators once we get there. However if one were to put a limit sell somewhere it would be at that target point, a pip or 2 below to ensure your tatget is met or even you're fomohunting a pip or 2 above for the riskier types. Of course this is just hypothetical though as this is not financial advice. Cheers!

USDCHF 2 Days Pinbar Near Daily Resistant
There are 2 pinbars in D1 candle chart.
The position of this pinbars near resistant area.
In Asia Session I believe the price will goes up little bit.
The strong move usually will come in cross London and New York session.

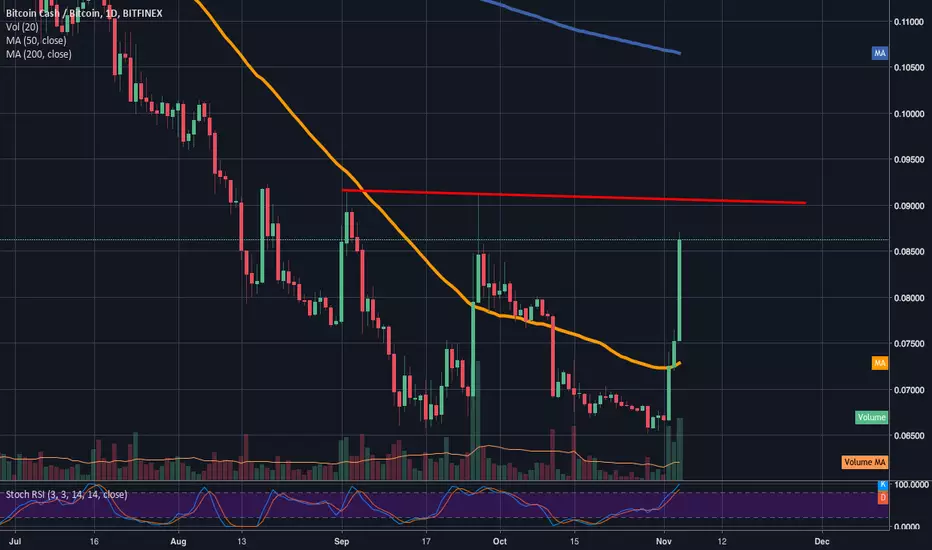
Bitcoin Cash Eyeing a potential Double Bottom breakout. Something has lit a fire under bcash's ass and sent it launching upwards....I was lucky to have gotten on right at the breakout but I took my profits slightly early at .0792 sats. Now I'm contemplating re entering but am expecting bch to have a slight retracement before it shoots for the enckline of the double bottom. It ay not though at this rate....I anticipate it breaching the neckline within the next 3 1 day candles and either doing a temporary fakeout or ust triggering the breakout right away...if it does trigger then BCH will be making its way all the way to the 1 day 200ma in blue. I ahve a feeling November 5th may be a bullish day.

TSLA | D | DOUBLE ELLIPSE SETUPIntroducing you the double harmonic ellipse setup ! Incoming edge bouncing.. maybe will go a bit lower around 259-253 range to find support base then bounce time !
Cheers,
Keops
