Play On LevelsRetested the Breakout Level around 180 - 185 &
Closed just above a Very Important fib level around
188.
But, 188 - 195 is Very Important Resistance as of now.
If 195 is Crossed with Good Volumes, 212 - 215 can be
touched initially.
Couple of Positive Weekly Candles with comparatively good
volumes may confirm HL on Monthly basis.
On the flip side, 175 - 184 is a Support Zone & also Double
Bottom around 175 - 176, so Short Term Traders may
expect a bounce from this level.
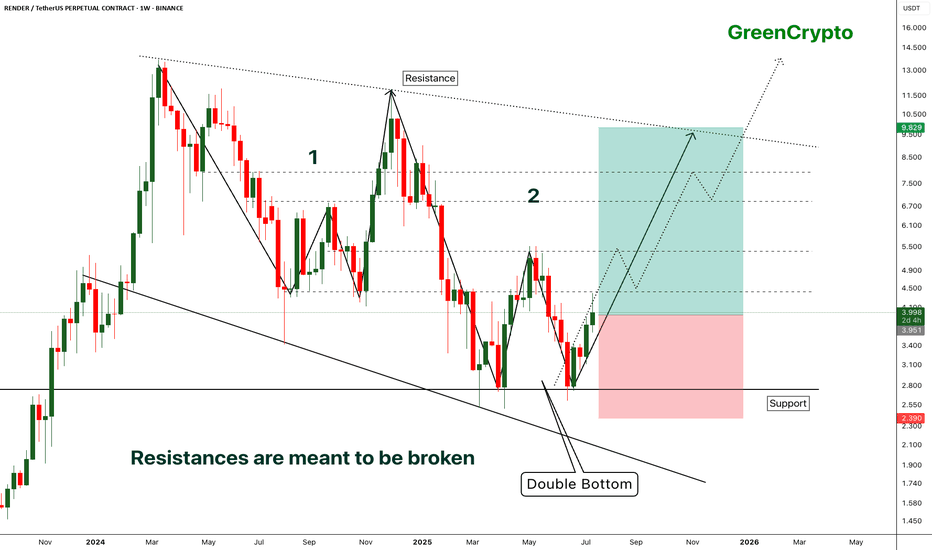
Double Bottom
EUR/GBP Weekly Forecast: Double Bottom Pattern, Bullish ReversalOverview of the Chart
This is a EUR/GBP daily chart, showcasing a Double Bottom Pattern, which is a classic bullish reversal formation in technical analysis. The pair has been in a downtrend for several months, but recent price action indicates a potential shift in momentum.
The double bottom pattern consists of two distinct lows (Bottom 1 & Bottom 2) at nearly the same level, forming a W-shaped structure. This suggests that sellers attempted to push the price lower twice but failed both times due to strong buying pressure at the support zone.
As the price starts to rise from the second bottom, the neckline resistance becomes a crucial level to watch. A confirmed breakout above this neckline would validate the pattern and signal a potential bullish rally.
Chart Breakdown & Key Components
1. Double Bottom Pattern Explanation
The first bottom formed in December 2024, marking the lowest price point where buyers stepped in.
The second bottom formed in March 2025, confirming strong demand in the support zone.
The pattern suggests bearish exhaustion, as sellers were unable to push the price lower.
The neckline at ~0.84778 acts as a key breakout level. Once price moves above it, the bullish reversal is confirmed.
🔹 Why is this pattern important?
It signals a trend reversal from bearish to bullish.
It attracts buying interest as traders recognize the formation.
The measured move suggests a potential target of 0.87307, aligning with previous resistance levels.
2. Key Support & Resistance Zones
✅ Support Zone (0.82249 - 0.82458)
This level has been tested twice, making it a strong demand area.
Buyers aggressively defended this zone, preventing further downside.
A break below this level would invalidate the bullish setup.
✅ Neckline Resistance (~0.84778)
This is the breakout level that confirms the double bottom pattern.
A strong bullish daily candle closing above 0.84778 would indicate a trend shift.
The price may retest this level after breaking out, offering a second entry opportunity.
✅ Major Resistance & Target Areas
0.86251 → The first major resistance zone, where price may face some selling pressure.
0.87307 → The final target based on the pattern projection, aligning with historical resistance.
3. Trading Setup & Execution Plan
🔹 Entry Strategy (Breakout Confirmation)
Enter a buy position after the price breaks and closes above the neckline (~0.84778).
A retest of the neckline provides a second chance to enter at a better price.
Look for high volume confirmation on the breakout for additional confidence.
🔹 Stop Loss Placement (Risk Management)
Place the stop-loss below 0.82249, just under the support zone.
This ensures protection against false breakouts.
Avoid placing the stop too tight, as price fluctuations can trigger early exits.
🔹 Take Profit Levels (Reward Calculation)
First Target: 0.86251 (Intermediate Resistance Level)
Final Target: 0.87307 (Measured Move Projection)
Partial profits can be taken at 0.86251, while runners target 0.87307.
🔹 Risk-Reward Analysis
Entry near 0.84778, stop loss below 0.82249, target at 0.87307.
This setup offers a risk-to-reward ratio (R:R) of over 3:1, making it a highly favorable trade.
4. Market Sentiment & Potential Scenarios
Bullish Scenario (High Probability) ✅
Price successfully breaks above the neckline at 0.84778.
Retests the neckline and holds as new support, leading to strong bullish momentum.
Moves toward 0.86251 first, then extends to 0.87307.
This scenario aligns with technical confirmation & volume breakout strategy.
Bearish Scenario (Low Probability) ❌
Price fails to break the neckline and faces rejection.
The pair revisits the support zone (0.82249 - 0.82458) for a third test.
If the support breaks, it could invalidate the bullish setup, leading to continued downtrend.
5. Final Thoughts & Summary 🎯
✅ Pattern Identified → Double Bottom, signaling bullish reversal.
✅ Breakout Level → Watch for confirmation above 0.84778.
✅ Risk Management → Stop loss below 0.82249.
✅ Profit Target → 0.86251 (Partial Profit), 0.87307 (Final Target).
✅ Trade Plan → Buy on breakout, retest entry for better positioning.
🔥 This is a high-probability bullish setup! Watch for breakout confirmation before entering a trade.
Double Bottom on USD/CHF @ W1This double bottom pattern has formed on the weekly chart of the USD/CHF currency pair following a downtrend that had been active since October 2022. It can be used as an upside breakout setup. The two bottoms are marked with the lower yellow line; the neckline is marked with the upper yellow line. My potential entry level is at the cyan line (10% of the pattern's height above the neckline). My potential take-profit level is at the green line (100% of the pattern's height above the neckline). My potential stop-loss is not shown on the chart and will be set to the low of the breakout candle or to the low of the preceding candle if the breakout one trades mostly outside the pattern's borders. I won't be trading a bearish breakout from this trend-reversal pattern.
EUR/GBP Chart Analysis – Double Bottom Reversal & Breakout Setup1. Market Structure & Context
The EUR/GBP daily chart presents a well-defined double bottom reversal pattern, indicating a potential trend shift from a prolonged downtrend to an uptrend.
The pair has been in a bearish phase, as reflected by the descending trendline.
However, price action suggests a possible trend reversal, as buyers are stepping in near a key demand zone.
A successful neckline breakout would confirm the bullish reversal, potentially leading to significant upside movement.
2. Key Chart Patterns & Technical Levels
A. Double Bottom Formation (Bullish Reversal Pattern)
The double bottom is a powerful reversal pattern, often signaling the end of a downtrend. It consists of two similar low points, forming a "W" shape.
Bottom 1: The first low was established around 0.8200 - 0.8250, where buyers initially stepped in to push prices higher.
Bottom 2: Price retested this demand zone, but sellers failed to push it lower, confirming a strong support level.
Bullish Significance: The inability of sellers to break below the support zone suggests the exhaustion of selling pressure and increasing buy-side interest.
B. Neckline Resistance & Potential Breakout Zone
The neckline resistance is drawn around 0.8450 - 0.8500, a key level where previous price rallies were rejected.
A breakout above this zone, ideally with strong bullish volume, would validate the double bottom pattern and trigger a bullish breakout trade.
C. Descending Trendline Breakout Attempt
The long-term downtrend resistance (trendline) has been holding since mid-2024.
Price is currently testing this trendline; a clear breakout and retest would add further confidence to the bullish bias.
3. Trade Setup & Execution Plan
A. Entry Strategy
There are two possible entry strategies, depending on risk appetite:
Aggressive Entry: Buy immediately upon a breakout above 0.8500, anticipating a strong rally.
Conservative Entry: Wait for a breakout + retest of the neckline before entering, ensuring confirmation.
B. Stop Loss & Risk Management
Stop Loss (SL): Placed below the recent swing low at 0.82029.
This level acts as the last line of defense for bulls; if price drops below it, the bullish thesis is invalidated.
C. Take Profit (TP) Targets
TP1: 0.86122 (first resistance zone, a previous swing high).
TP2: 0.87284 (higher resistance level, next supply zone).
These levels serve as potential profit-taking areas where sellers may re-enter the market.
4. Additional Technical Confluences Supporting Bullish Bias
✔ Key Support Zone Holding Strong – The price has bounced twice from the demand zone (0.8200 - 0.8250), confirming strong buyer interest.
✔ Volume Confirmation Needed – A breakout with high volume increases the probability of sustained bullish momentum.
✔ RSI & Momentum Indicators – If RSI crosses above 50, it would further confirm bullish momentum, supporting the breakout trade.
✔ Favorable Risk-to-Reward Ratio (RRR) – A well-defined stop loss & take profit strategy ensures an optimal trade setup.
5. Summary & Final Trading Plan
Current Market Bias: Bullish if neckline breaks (Double Bottom Confirmation).
Entry Confirmation: Look for a breakout above 0.8500 with strong volume.
Profit Targets:
TP1: 0.8612
TP2: 0.8728
Stop-Loss Level: Below 0.8202 to protect against fake breakouts.
🚀 Final Tip for Traders:
Monitor price action & volume closely. A breakout without volume may lead to a false move. Confirmation with bullish momentum is essential for a high-probability trade setup.
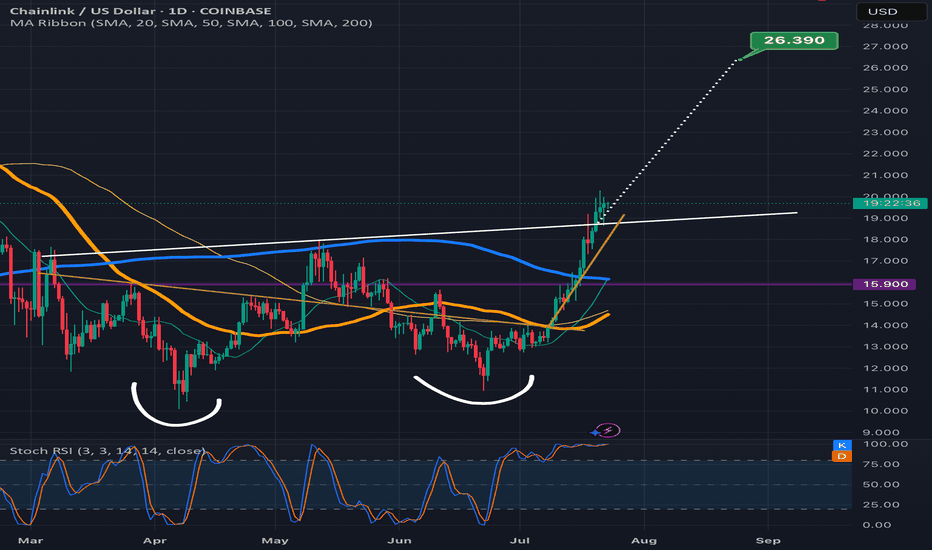
Cat's in the CradleHey Guys!! Here's one for you that you are going to Like
Let's Aim for a ~50% profit, on This one...
($22---->30 )
double-bottom,Trend Channel
Clearly defined Support-and-resistance Touch points.
Cheers!
And the cat's in the cradle and the silver spoon
Little boy blue and the man on the moon
"When you comin' home, Dad?"
"I don't know when, but we'll get together then
You know we'll have a good time then"
ELPI (VCP - 26W 14/4 3T)Position update: March 25, 2025.
Key factors:
1. Confirmed stage 2 uptrend.
2. A textbook double bottom with VCP characteristics.
3. Has gone through its majority line of supply.
4. Moving on its own drummer, the stock consolidates while the index suffers a terrible decline.
5. High relative strength.
6. Volume dries up as less supply coming to the market.
7. Strong fundamentals, with consistent year-over-year earnings growth.
Considerations: Despite these strengths, the broader market remains in a bearish phase, down over 20% from its all-time high. Geopolitical risks, persistent net foreign selling, declining investor confidence, and concerns over the government downplaying the stock market's significance continue to contribute to an unstable market environment.
CHF/USD – Double Bottom Reversal Setup - Trading SetupComprehensive Analysis of CHF/USD 4-Hour Chart
The CHF/USD 4-hour chart presents a technical trading setup based on a Double Bottom reversal pattern, combined with trendline support and key resistance levels. This pattern suggests a potential bullish breakout if key resistance is cleared. Below is a professional breakdown of the chart, covering the market structure, pattern formation, and a strategic trading setup.
1️⃣ Market Structure & Trend Analysis
The overall market structure suggests that CHF/USD has been in an uptrend, as indicated by the ascending trendline that has consistently provided support. The price has recently tested a key support zone twice, forming the Double Bottom pattern, which is known for signaling a trend reversal or continuation of an uptrend.
The dashed trendline connecting higher lows confirms the bullish momentum.
As long as the price stays above this trendline support, the bullish bias remains valid.
A break below the trendline would indicate a possible reversal or a deeper retracement.
The most critical observation here is that the price is respecting both the trendline and horizontal support zone, which increases the likelihood of a breakout in the upward direction.
2️⃣ Double Bottom Pattern Formation
The Double Bottom pattern is clearly formed at a strong demand zone, reinforcing the idea that buyers are stepping in to prevent further declines.
The first bottom was formed after a rejection from the 1.1250 - 1.1290 support zone.
The price then attempted to recover but faced resistance at 1.1350 - 1.1400, which now acts as the neckline of the pattern.
The second bottom was formed at approximately the same price level as the first, confirming the validity of the pattern.
A Double Bottom pattern is considered bullish, but confirmation is required through a breakout above the neckline resistance (1.1350 - 1.1400). If the price successfully breaks this level, it will indicate that buyers have regained control and the price is likely to move higher.
3️⃣ Key Support and Resistance Levels
In this setup, there are three crucial price zones: support, resistance, and the target area.
The support zone, located around 1.1250 - 1.1290, is where buyers stepped in to push the price higher. This level is crucial because it provided strong demand during the formation of the Double Bottom.
The resistance level at 1.1350 - 1.1400 serves as the neckline of the pattern. A breakout above this level would confirm the bullish trend continuation, while rejection could lead to another retest of support.
The target area is projected around 1.1500 - 1.1550, based on the measured move of the Double Bottom formation. This is the price level where traders may start taking profits if the bullish breakout occurs.
4️⃣ Trade Execution Plan
To take advantage of this potential setup, traders should focus on three key aspects: entry, stop-loss placement, and take-profit levels.
Entry Strategy
Aggressive traders can enter a long position above 1.1350, anticipating an immediate breakout.
Conservative traders may wait for a break and retest of the 1.1350 - 1.1400 zone, which would act as a confirmation for a sustained bullish move.
Stop-Loss Placement
A logical stop-loss should be set below 1.1138, which is beneath the Double Bottom formation and trendline support.
If the price drops below this level, it would invalidate the bullish setup and signal a potential trend reversal.
Profit Targets
The first target zone lies around 1.1450 - 1.1500, where traders may consider securing partial profits.
The extended target zone is 1.1550, which aligns with the expected measured move of the Double Bottom pattern.
5️⃣ Risk Management & Final Considerations
Since this setup is based on a strong trendline support and bullish pattern, risk management is essential to protect against fake breakouts or sudden trend reversals.
Traders should monitor price action near the 1.1350 - 1.1400 resistance zone. A strong bullish candle closing above this area increases the likelihood of a successful breakout.
If the price fails to break out and starts moving lower, it may indicate that sellers are still in control, which could lead to a deeper correction toward 1.1200 or lower.
6️⃣ Summary & TradingView Idea
This CHF/USD 4-hour chart presents a high-probability bullish setup based on a Double Bottom reversal at a strong support zone. The key confirmation level to watch is 1.1350 - 1.1400, which, if broken, will likely push the price toward 1.1500 - 1.1550.
Entry: Buy above 1.1350 or after a breakout retest.
Stop Loss: Below 1.1138 to avoid false breakouts.
Take Profit: First target at 1.1450 - 1.1500, extended target at 1.1550.
This setup provides a favorable risk-to-reward ratio, making it a strong potential trading opportunity. However, traders should always wait for confirmation signals before entering a position. 🚀
EUR/JPY – Double Bottom Breakout & Trendline Retest, Trade Setup📊 Chart Type: 1-Hour (H1)
💹 Asset: EUR/JPY
📈 Technical Patterns: Double Bottom, Trendline Breakout, Retest
📌 Overview of the Chart
The EUR/JPY chart showcases a bullish reversal setup, characterized by a Double Bottom pattern, a trendline breakout, and a successful retest. This combination suggests a potential continuation towards higher price levels, making it an ideal setup for traders looking for breakout entries.
The price action initially followed a downtrend, but buyers stepped in at key support zones, leading to the formation of a strong reversal pattern. Now, the price is testing a key resistance level, and if it breaks out, we could see a significant upward move.
🟢 Key Technical Analysis Breakdown
1️⃣ Double Bottom Formation – A Bullish Reversal Signal
🔹 The Double Bottom is a classic reversal pattern that forms after an extended downtrend.
🔹 In this case, price found strong support at 160.139, forming two lows (Bottom 1 & Bottom 2), indicating buyer dominance.
🔹 The confirmation of the pattern comes with a break above the neckline at around 162.000, suggesting a shift from bearish to bullish momentum.
2️⃣ Trendline Breakout & Retest
🔹 A descending trendline had been acting as dynamic resistance, pushing prices lower.
🔹 Recently, the price broke above the trendline, signaling a potential trend shift.
🔹 Now, price is retesting the trendline, which is a key factor in confirming whether the breakout is valid.
🔹 If the retest holds, it could trigger a strong bullish move towards the next resistance zone.
📍 Support & Resistance Zones
🔹 Support Level (160.139):
The lowest point in the chart, where price tested twice and formed the Double Bottom.
Buyers stepped in aggressively at this level, preventing further decline.
Stop Loss Placement: Below this support zone for long trades.
🔹 Resistance Zone (163.725 - Target Level):
The previous swing high and a major supply zone.
A breakout above this area could lead to further bullish momentum.
📈 Trading Strategy – How to Trade This Setup?
✅ Bullish Trade Setup (Breakout & Retest Confirmation)
This setup is ideal for traders looking to capitalize on breakout and retest strategies.
📌 Entry:
Wait for a strong bullish candle to confirm the retest of the trendline.
A break above the 162.500 level could be a good entry confirmation.
📌 Target:
First target: 163.725 (Resistance Zone).
If momentum continues, the next upside target could be around 164.500.
📌 Stop Loss:
Below 160.139 (previous support level) to minimize risk.
Alternatively, place it below the trendline retest zone if entering aggressively.
📌 Risk-to-Reward Ratio (RRR):
This trade offers a strong RRR, as the downside risk is limited, while the upside potential is higher.
🔴 Bearish Scenario – What if the Retest Fails?
While the bias is bullish, traders must be prepared for a fake breakout scenario. If price fails to hold above the trendline and neckline, the structure might break down.
📌 Bearish Entry:
If price rejects the retest zone and closes back below 161.500, it could indicate a false breakout.
📌 Target:
160.139 (Support Level).
📌 Stop Loss:
Above the trendline retest zone to protect against unexpected bullish moves.
🔎 Key Takeaways & Final Thoughts
✅ The Double Bottom pattern signals a potential trend reversal.
✅ The trendline breakout & retest adds further confirmation to the bullish bias.
✅ A breakout above 162.500 could accelerate buying pressure toward 163.725.
✅ Risk management is essential: A well-placed stop loss below the support level ensures minimal downside risk.
✅ If price rejects the retest zone, traders should be prepared for a possible bearish reversal.
📌 Overall Bias: Bullish ✅
📌 Trade Confirmation: Needs trendline retest hold + bullish breakout 📈
📌 Key Level to Watch: 162.500 (Breakout Confirmation Zone) 🔥
💡 Pro Tip : Always wait for confirmation before entering a trade. A strong bullish candlestick pattern (e.g., engulfing candle) on the H1 or H4 timeframe could provide extra confidence in the setup! 🚀
BTC/USD Trading Analysis – Double Bottom & Rising Wedge BreakoutThis BTC/USD 4-hour chart showcases a potential bullish breakout setup based on technical patterns, key support and resistance levels, and price action analysis. The chart suggests a trend reversal following a downtrend, with signs of bullish momentum building up.
Let's break down the full technical analysis, covering the chart structure, key levels, price patterns, and trading strategy.
1. Market Structure & Identified Patterns
A. Double Bottom Reversal – Strong Bullish Signal
A double bottom pattern has formed, which is a bullish reversal signal that indicates the end of a downtrend.
This pattern consists of two significant low points (Bottom 1 and Bottom 2) near the $80,000 - $81,000 support zone.
The pattern confirms strong buying interest at this level, preventing further price drops.
A breakout above the resistance level would confirm the pattern’s validity, signaling a move toward higher targets.
B. Rising Wedge Formation – Potential Bullish Breakout
The price action is consolidating in a rising wedge, forming higher highs and higher lows within a narrowing range.
A rising wedge often suggests a potential breakout.
Since this wedge forms after a double bottom, the breakout is expected to be bullish, rather than a bearish breakdown.
If the price breaks above the wedge’s upper trendline, it will confirm a strong upward momentum.
2. Key Support & Resistance Levels
Support Levels:
Major Support Zone (80,000 – 81,000):
This level has been tested twice, confirming buyer strength.
It serves as the foundation for the double bottom pattern.
Stop Loss Level (72,921):
If the price drops below this level, it would invalidate the bullish setup.
This level is strategically placed to manage risk and protect against potential downturns.
Resistance Levels:
First Resistance Zone (95,000 – 100,000):
This is a critical level, as the price has faced multiple rejections here.
A breakout above this zone would confirm a strong bullish trend continuation.
Take Profit Targets:
TP1 (108,481): The first take-profit target aligns with previous highs and is a logical point for partial profit booking.
TP2 (114,372): This is the second profit target, calculated based on Fibonacci extensions and historical price movements.
3. Trading Strategy & Execution Plan
A. Entry Strategy
To execute a successful trade, we need to wait for confirmation of the breakout.
Ideal Entry: After a strong breakout above 95,000 – 100,000, indicating bullish momentum.
Confirmation Factors:
Increased trading volume → Signals strong buying interest.
Candle close above resistance → Confirms breakout.
Retest of broken resistance as support → Strengthens bullish continuation.
B. Risk Management
Stop Loss Placement: Below 72,921, ensuring limited downside risk.
Risk-to-Reward Ratio: The trade setup aims for a 1:3 or better risk-to-reward ratio.
C. Potential Scenarios
✅ Bullish Breakout:
If BTC breaks and holds above 95,000 – 100,000, we can expect a rally toward 108,481 (TP1) and 114,372 (TP2).
❌ Bearish Rejection:
If BTC fails to break resistance, it could retest 80,000 or drop lower, invalidating the bullish setup.
4. Final Thoughts – What to Expect?
This BTC/USD 4-hour chart analysis provides a high-probability bullish trade setup, supported by:
✅ Double Bottom Formation → Strong Reversal Signal
✅ Rising Wedge Breakout Potential → Momentum Building
✅ Key Resistance Breakout Levels Identified
📌 Conclusion:
If Bitcoin breaks above 95,000 – 100,000, expect a major bullish move toward 108,481 and beyond. However, if resistance holds, we might see a retest of lower support levels. Risk management is essential for a successful trade execution. 🚀
EUR/JPY Chart Analysis - Falling Wedge Target with Bullish SetupThis EUR/JPY 1-hour chart reveals a well-defined falling wedge pattern, which is a bullish reversal formation. Additionally, we see key support and resistance levels, a double bottom, and a breakout potential that traders can use to plan an entry. Let’s dissect this chart in a professional and detailed manner to understand the trade setup and market psychology.
🔹 Market Trend & Structure Analysis
The market was previously in an uptrend, making higher highs and higher lows, until it faced strong resistance at the 163.500 level. Upon reaching this zone, the price reversed downward, forming a series of lower highs and lower lows, which resulted in a falling wedge pattern.
This downward movement was accompanied by a trendline break, signaling a shift in momentum. The price has since reached a strong support level and is showing signs of potential bullish reversal.
🔹 Key Technical Patterns & Indicators
1️⃣ Falling Wedge Pattern (Bullish Reversal Signal)
A falling wedge is a pattern characterized by two downward-sloping trendlines that converge, indicating that selling pressure is weakening. This pattern is considered a bullish signal because:
✔️ The declining price movement shows exhaustion of sellers.
✔️ Volume typically decreases as the wedge forms, indicating a breakout is coming.
✔️ Once price breaks out of the wedge, a strong bullish move often follows.
The key here is to wait for a breakout above the upper trendline, which will confirm the bullish momentum.
2️⃣ Double Bottom Formation at Support (Reversal Confirmation)
The price tested the 160.500 support level twice, forming a double bottom pattern. This is another bullish sign, as it indicates:
✔️ Buyers are actively defending this level.
✔️ There’s strong demand around this price zone.
✔️ If price breaks above the wedge resistance, it could trigger a significant rally.
🔹 Key Support & Resistance Levels
Identifying support and resistance is crucial for defining entry and exit points.
✅ Support Levels:
160.500 – Strong horizontal support (Price tested this twice).
158.982 – Stop-loss level (Below this, the bullish setup is invalid).
✅ Resistance Levels:
163.500 – Major resistance (Previous high and supply zone).
165.090 – Final target (Key breakout level).
If the price successfully breaks out of the wedge, it has room to rise significantly, with 163.500 as the first target and 165.090 as the ultimate goal.
🔹 Trade Setup & Execution Plan
🎯 Bullish Breakout Trade Strategy
Since this setup signals a potential reversal, here’s how traders can execute a high-probability trade:
🔹 Entry Points:
✅ Aggressive Entry: Enter as soon as price breaks above the wedge resistance.
✅ Conservative Entry: Wait for a breakout and a retest of the resistance-turned-support before entering.
🔹 Target Levels:
🎯 First target: 163.500 (Previous resistance level).
🎯 Final target: 165.090 (Major resistance zone).
🔹 Stop-Loss Placement:
❌ Place the stop loss below 158.982, as a break below this level would invalidate the bullish setup.
🔹 Risk-Reward Ratio & Trade Justification
📈 Why This Trade Has a High Potential Reward?
Low-risk, high-reward: The stop loss is tight, while the upside potential is large.
Confluence of bullish signals: Falling wedge + Double bottom + Strong support.
Institutional interest likely: Buyers are stepping in at key levels.
A proper risk-to-reward ratio (RRR) for this trade would be at least 1:3, meaning for every 1% risk, there’s a 3% profit potential. This makes it a great swing trading setup.
🔹 Market Psychology Behind the Setup
The falling wedge represents a market correction after a strong bullish trend.
The double bottom shows that sellers are exhausted and buyers are gaining control.
If price breaks out, many traders will enter, triggering a strong upward rally.
This bullish breakout setup aligns with the smart money concept, where institutions accumulate positions before a big move.
🔹 Final Thoughts & Trade Outlook
This EUR/JPY setup presents a high-probability trade opportunity with a bullish breakout scenario. The combination of:
✅ Falling Wedge Pattern (Bullish reversal)
✅ Double Bottom at Support (Buyers stepping in)
✅ Key Resistance Targets (Clear trade exit points)
…creates a great trading setup.
📌 Trading Plan Summary:
✔️ Buy on breakout above the falling wedge.
✔️ Target 163.500 & 165.090 for profits.
✔️ Stop-loss below 158.982 for risk management.
🚀 If executed correctly, this trade has the potential for strong bullish momentum. Would you like a real-time update once the price confirms the breakout? Let’s keep an eye on this trade! 📊🔥
EUR/GBP - Double Bottom Reversal Setup | Trendline BreakoutThis EUR/GBP (Euro to British Pound) daily chart presents a textbook double bottom reversal pattern, signaling a potential trend reversal after a prolonged downtrend. Additionally, a trendline breakout further strengthens the bullish outlook.
The market structure suggests that buyers are regaining control, and a breakout above the neckline resistance zone (0.84500 - 0.85000) could trigger a significant upward move. Let's break down this setup in detail.
📊 Technical Breakdown of the Chart
1️⃣ Double Bottom Formation – A Strong Reversal Signal
🔹 The double bottom is a powerful bullish reversal pattern that forms after an extended downtrend, indicating that selling pressure is fading and buyers are stepping in.
🔹 First Bottom: Established in December 2024, where the price reached a key support level (~0.82453) before bouncing back.
🔹 Second Bottom: Formed in March 2025, confirming the validity of the support level and creating a solid demand zone.
🔹 The neckline resistance (0.84500 - 0.85000) is the key level that price must break to confirm the reversal.
2️⃣ Trendline Breakout – Shift in Market Sentiment
🔹 The market has been in a downtrend, as shown by the descending trendline acting as resistance for several months.
🔹 Recently, the price broke above this trendline, indicating that bearish momentum is weakening and a potential trend reversal is underway.
🔹 This breakout adds confluence to the double bottom pattern, reinforcing the bullish bias.
3️⃣ Key Support & Resistance Levels to Watch
📌 Support Zone (Bottom Area) – 0.82453:
✅ This level has been tested twice (December & March), confirming it as a strong demand zone.
✅ Price consistently rebounded from this level, showing buyers’ dominance.
✅ This is the ideal stop-loss level to protect against downside risks.
📌 Resistance Zone (Neckline) – 0.84500 - 0.85000:
✅ A breakout above this neckline resistance is necessary for a bullish continuation.
✅ If price breaks and retests this level as support, it will confirm a high-probability buy setup.
📌 Target Level – 0.87394 (Projected Move)
✅ This is calculated using the measured move technique, where the distance from the bottom to the neckline is projected upwards.
✅ This level coincides with a previous resistance zone, making it a realistic target.
📈 Trading Strategy – How to Trade This Setup
🎯 Entry Plan for Long Position (Buy Setup)
1️⃣ Breakout Entry:
Enter a long position after a confirmed breakout above 0.85000.
Watch for strong bullish candles with volume confirmation.
2️⃣ Retest Entry (Safer Option):
If price breaks above resistance, wait for a pullback and retest of the 0.84500 - 0.85000 level.
If price holds this zone as new support, it strengthens the bullish confirmation.
📉 Stop-Loss Placement (Risk Management)
✅ Place a stop-loss just below the support zone (0.82453) to protect capital.
✅ This level is strong because price has bounced off it twice, confirming buyer strength.
🎯 Profit Target (Take Profit)
✅ The projected target is 0.87394, aligning with previous resistance.
✅ This offers a high reward-to-risk ratio (RRR), making the trade worth taking.
⚠️ Risk Management & Market Outlook
✅ Bullish Bias – Price action suggests uptrend continuation after breaking out of the trendline.
✅ Confirmation is Crucial! – Enter only after a clear breakout and retest.
✅ Watch for Fakeouts – If price fails to hold above the neckline, it could be a false breakout.
✅ Fundamental Factors – Keep an eye on economic data and central bank policies (ECB & BoE) that may impact the GBP & EUR.
📢 Final Thoughts – Why This Trade is High-Probability
🚀 Double Bottom + Trendline Breakout = Strong Bullish Signal
🚀 Neckline Breakout Above 0.85000 = Confirmation of Trend Reversal
🚀 Targeting 0.87394 with a Favorable Risk-Reward Setup
If price successfully breaks and holds above resistance, we could see a strong rally toward 0.87394 in the coming weeks.
📌 Monitor price action carefully and wait for confirmation before entering the trade.
🔔 Like & Follow for More Trading Setups! 🚀📈
USDCHF Correction Due To Produce A Reversal Pattern?OANDA:USDCHF has been in a Correction Wave since the beginning of January and we now see that Price may have finally found Support at the 1.809 Fibonacci Extension Level of the Correction Wave.
With both Lows in March finding Support at the 1.809 Fibonacci Extension Level, Price is beginning to form what looks like a Reversal Pattern, the Double Bottom!
** Confirmation of Pattern will come when Price Breaks and Closes Above .8863, then we will be looking for a Long Opportunity to present itself as a Break and Retest Set-Up. The Retest will Validate the Trade Idea!
If we take the height of the Pattern and apply it to the Break of Confirmation, this puts the Potential Target at Previous Area of Support of the Correction Wave ( Point A ) in the .8975 area.
Fundamentals seem to Support the Bullish Idea with:
SNB Cutting Interest Rates by 25 Basis points from .5% to .25%
FED Holding Interest Rates @ 4.5% due to "Economic Uncertainty"
Unemployment Claims for USD came in as expected with no surprise and even 1K below Forecast ( Actual 223K / Forecast 224K )
Also Positive Outlook from Philly Fed Manufacturing Index and Existing Home Sales see USD rise.
Next Weeks Final GDP on Thursday, March 27th will be the next big News Event to bring some light to how the economy is doing and if USD will continue strengthening!
Re-Testing of Breakout Level around 520.Re-Testing of Breakout Level around 520.
If Weekly Candle Closes above 520 - 521, we may
expect an Upside towards 550.
Also there is Bullish Divergence so we may
expect that it will play this time & push the price upside.
On the flip side, 500 - 504 is the Channel Bottom.
and Remember, Once 650 is Crossed with Good Volumes,
it may expose New Highs targeting around 700.
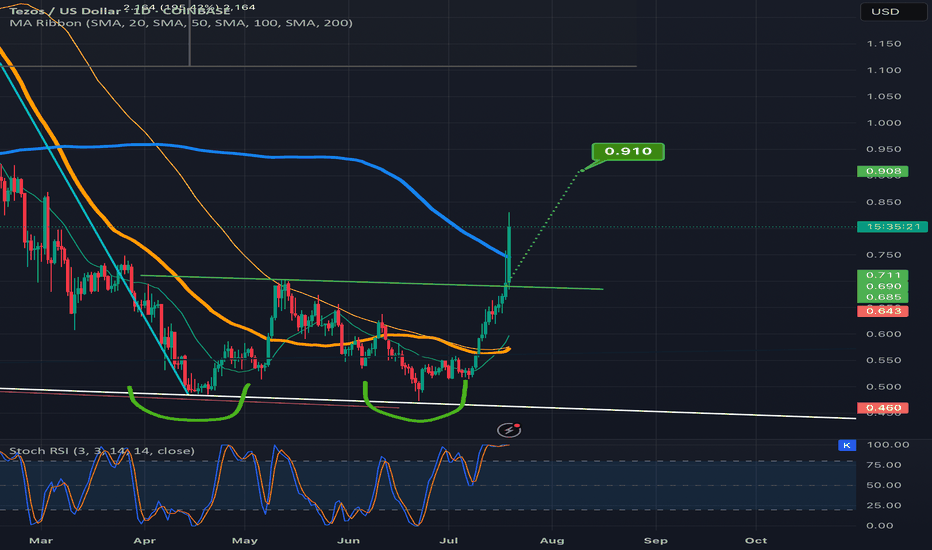
Double Bottom pattern: A bullish reversal signal The Double Bottom pattern is a classic reversal formation that signals a potential trend change from bearish to bullish. It occurs after a prolonged downtrend when price forms two distinct lows at a similar level, indicating strong support.
How to Identify:
✔️ Two Lows: Price touches the same support level twice, forming a "W" shape.
✔️ Resistance Breakout: The neckline (resistance level) marks the breakout zone.
✔️ Trend Reversal Confirmation: Once price breaks above resistance, momentum shifts bullish.
Interpretation:
In this chart, we see a clear bearish trend, followed by two attempts to break below the same support level.
After failing to break lower, buyers regained strength, pushing price above resistance, confirming the bullish reversal.
Once resistance turns into support, traders often enter long positions, targeting higher levels.
What’s Next?
A sustained breakout could fuel further upside momentum. However, watch for potential false breakouts and retracements back to support before continuation.
ASAL : DOUBLE BOTTOM FORMATIONThe Stock of NSE:ASAL is forming a double bottom after the aggressive downtrend in the stock.
1)Breakout Level - 535
2)Targets - 635-639
3)Stop loss - 421 -425
Trade can be taken above the breaking of neckline.
Disclaimer - This is just an analysis and not a buy recommendation for the stock.
$BTC Trading Idea – Short-Term BounceCRYPTOCAP:BTC Trading Idea – Short-Term Bounce
Pattern: #BTC is forming a double bottom, indicating a potential trend reversal.
RSI Divergence: Clear bullish divergence on RSI confirms buying momentum.
Target Levels:
First target: $89,000
Second target: $91,000
Third target: $93,500
Outlook: Expecting a short-term bounce before a potential correction. Monitoring price action closely for confirmation.
This setup suggests a high-probability move to the upside in the near term.
ETH/USD - Technicals and Fear Index Point to Upside!Welcome to another Wolf of Blockstreet analysis where I take a look on ETH/USD!
On the weekly timeframe, we can observe a significant market structure since the last low in September 2024. ETH in 2024 underwent an ABC correction into a strong support zone, followed by a massive wick up. This was followed by two bullish weeks, establishing a higher high, and then a wick fill down that set up a double bottom pattern.
This could be happening again. Additionally, we see a long-term support trendline in play here, reinforcing the bullish setup.
At the same time, the Fear and Greed Index is at a historically low level, signaling extreme fear in the market. As of February 27, 2025, the index stands at 10, which is even lower than the fear levels seen during the FTX crash in November 2022.
Historically, extreme fear in the market has often represented one of the best times to buy, as it tends to be followed by a recovery and upward movement in prices. The double bottom pattern on ETH/USD, combined with the extreme fear indicated by the Fear and Greed Index, could signal a potential reversal to the upside.
My key area to look for long-term buying opportunities lies in the $2000-$2200 range. This zone provides strong support and could serve as an ideal entry point for those looking to accumulate ETH for the long run. However, this idea would become invalid if we see a weekly candle close below this range, indicating a potential shift in market dynamics.
While both the technical analysis and market sentiment suggest a bullish reversal could be on the horizon, we need to see confirmation here and the cryptocurrency market remains highly volatile. Investors should conduct thorough research and be aware of the inherent risks before making any trading decisions.
For more updates you can follow me on X: @PuppyNakamoto
LONG ON USOILOil is currently rising from a major demand zone.
It has broken out of a nice double/triple bottom and a downtrend line.
I expect price to tap into the demand zone as a pullback from its recent break of a high and then continue to rise.
I am buying oil and expecting it to rise to the next supply level for just about 200 pips or a $2 move on.
ETHUSD and Crypto Signaling Risk On?So typically for equities I use the one hour, but when it comes to crypto being that a trading day is 4x a typical day for equities, I use the 4 hour. The one thing about my momentum indicator, is that forward testing has indicated that the longer a trade survives, the more likely it is to win! This one looks like we have a double bottom in the works as it approaches the neckline. If it can breakout, instead of testing that take profit, we are likely to smash thru it. I guess patience pays...
The signal was created by the King Trading Momentum Strategy combines the 5 EMA crossing above the 13 EMA, RSI strength, favorable momentum as measured by ADX plus evaluating recent volume changes and even something that measures breakout momentum called Beta for some equities! ETHUSD and over 100 equities are built into this script, as well as, BTCUSD and SOLUSD with optimal backtest take profits and stop losses and can be toggled on by simply checking a box (default they are turned off). I always enable Using Bar Magnifier and On Bar Close in Properties.