SWDY Double Bottom AnalysisSWDY stock has rebounded back from the resistance line of 81.97, to reach the support line at 81.163. It shows that the double bottom wasn't a true sign to encourage a bullish reversal pattern.
Double Bottom

LIGHTBRIDGE BREAKING out from a DOUBLE BOTTOMDYOR on the fundamentals.
This idea share is solely based on the chart.
Which exhibits a beautiful double bottom breakout.

USOIL - Bullish Double BottomHello Traders !
The USOIL price formed a double bottom pattern.
Currently, The neckline is broken !
So, I expect a bullish move🚀
_______________
TARGET: 63.49🎯

DB patternhi traders,
Here is an opportunity to grab 500 to 600 pts in Nifty.
A DB pattern in daily timeframe has formed, if the neckline breaks buy nifty.
Neckline level : 25116.25
Target : 25759.95
SL : 24462.40

Double Bottom + Bullish Divergence.2280 - Closed at 51.80 (26-05-2025)
Double Bottom + Bullish Divergence.
Channel Bottom & respecting Trendline so far.
Crossing 53.20 with Good Volumes may
result in reaching 55 - 56.
50.30 should be the SL.

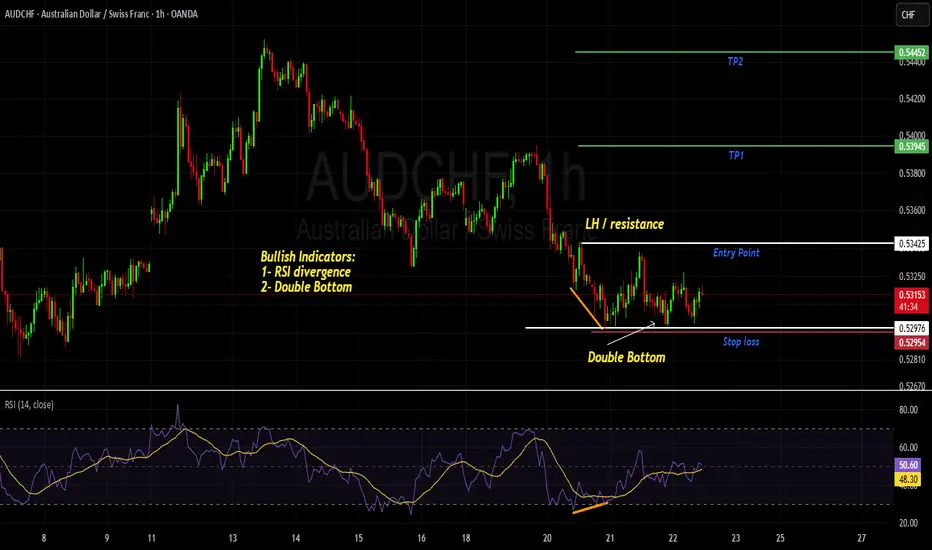
AUDCHF- BUYCALL - RSI divergence and Double Bottommarket has formed Bullish divergence on Bearish trend followed by Double Bottom formation. This indicates that market will now reverse the trend and we can expect bullish trend.
Entry will be taken after breakout of resistance level which is also a LH and TPs will be 1:1 and 1:2 accordingly. SL is placed slightly below the Double Bottom.
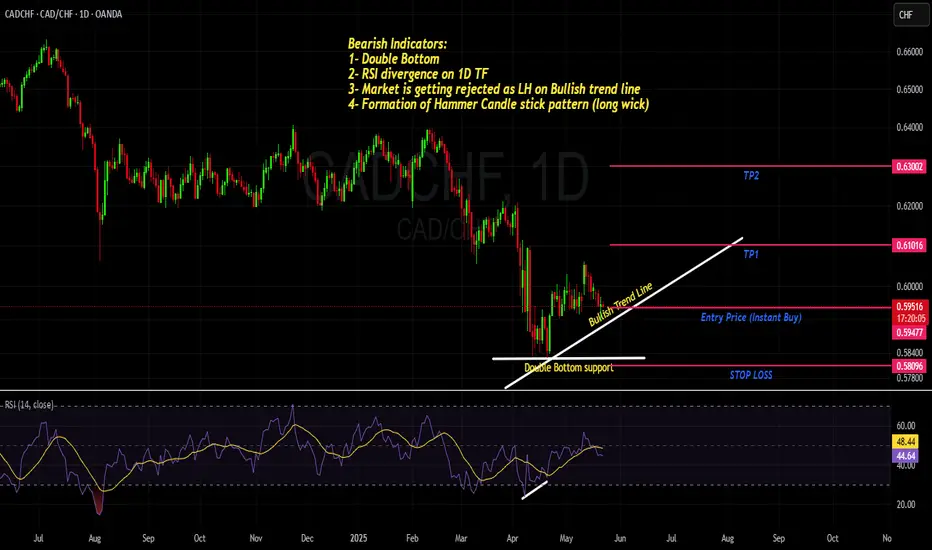
CADCHF- Another way to Look at BULLISH BIAS - 5 Strong Reasons Strong confluences on 1D time frame for the Bullish BIAS on this pair.
1- RSI divergence
2- Formation of HH and HL
3- Bullish Trend Line
4- Hammer Candle stick pattern formation
5- Double Bottom
we anticipate the market to remain in Bull phase.
Entry point is market with TP1 and TP2 as R:R of 1:1 and 1:2 respectively. Keep you Stop loss slightly below the Double Bottom (Support line)
Can $AMC come back to life again? NYSE:AMC is showing some good TA on the weekly and daily chart. We are visiting lows from the past, which reminds me of when I played NYSE:AMC and it visited the COVID lows.
On both the Weekly and Daily we have the MACD in GREEN, RSI crossing MA which the weekly is showing downtrend being broke.
Daily chart Is almost or is right on the 8 day crossing the 21 day EMA. Daily is also breaking the downtrend of ~$4.40 along with breaking the 100 day SMA. Holding VWAP form the low of $2.45 on 4/4/2025.
NYSE:AMC Price as of 5/15/2025: $2.81
Need to see continuation out of the downtrend with volume
Break the resistance level of $2.81 - $2.85, which has the 100 Day SMA around the $2.83 that needs to be cleared.
Then $2.90 - $3.00 and we'll follow the Fib Levels and mark support/resistance levels as we go.
This could get spicy so buckle up knuckleheads!
NYSE:AMC Daily
NYSE:AMC Weekly

AUDJPY - Bullish Double BottomHello Traders !
On Tuesday 6 May, The AUDJPY reached the support level (92.222 - 91.978).
The price formed a double bottom pattern.
At the moment, The Neckline is broken !
So, I expect a bullish move🚀
_______________
TARGET: 94.240🎯

SONIC | (Previously Fantom) | HUGE BULLISH PatternFTM has now officially been replaced on most exchange and is now trading as Sonic.
At first we saw an initial drop, typical "sell the news" actions, but now there is a bullish pattern forming in the 4h timeframe.
SONIC is bullish because:
✅ Upwards trendline trading
✅ Higher Lows
✅ Bullish chart pattern: W-Bottom
_______________
BYBIT:SONICUSDT

Double bottom and Demand on RIOT! OptionsMastery:
🔉Sound on!🔉
📣Make sure to watch fullscreen!📣
Thank you as always for watching my videos. I hope that you learned something very educational! Please feel free to like, share, and comment on this post. Remember only risk what you are willing to lose. Trading is very risky but it can change your life!

Still a Good Buy but with proper Stoploss.Still a Good Buy but with proper
Stoploss.
Immediate Resistance is around 134 - 135
Crossing it may take the price towards
140 - 144 initially. & then the Double Bottom
will play and may hit 160+


Formed Strong Double bottom around 40.Formed Strong Double bottom around 40.
Immediate Resistance is around 46 - 47
Crossing this level & sustaining with good volumes
may witness 48.50 - 49.
On the flip side, 44 - 44.50 seems to be a Good Support.

BITCOIN - Bullish Double BottomHello Traders !
The BTC price formed a double bottom pattern.
Currently, The neckline is broken !
So, I expect a bullish move🚀
______________
TARGET: 88700🎯

Double Bottom formed around 164 - 165.
Double Bottom formed around 164 - 165.
Crossing & Sustaining 179 may lead it
towards 190 - 193.
For a Bullish Momentum, it needs to Cross
195 atleast.

Cat's in the CradleHey Guys!! Here's one for you that you are going to Like
Let's Aim for a ~50% profit, on This one...
($22---->30 )
double-bottom,Trend Channel
Clearly defined Support-and-resistance Touch points.
Cheers!
And the cat's in the cradle and the silver spoon
Little boy blue and the man on the moon
"When you comin' home, Dad?"
"I don't know when, but we'll get together then
You know we'll have a good time then"

LONG ON GBP/CHFGBP/CHF Has a Perfect Double bottom pattern at a major demand area.
Price has broken the neckline of the double top and is currently pulling back to sweep liquidity and balance out price at any FVG's (Fair Value Gaps)
Liquidity sits behind the 2 wicks on the double bottom, so price may sweep that BEFORE rising.
Must give you stop loss space behind the wicks to survive the trade.
I have a buy limit order setup to take advantage of the pullback which will place me in the trade at discount price.
From there im looking to catch 300 pips to the previous swing high.

BULLISH PRESSURE US30All details are in the picture itself. If you have any questions feel free to message me.

ATOM: Double Bottom Confirmed – Gap Fill to $10 in Sight#ATOM nailed the perfect bounce from the $3.611 support, confirming a clean double bottom pattern. The structure looks strong, and the next major target is the $10 level for a potential gap fill.
Follow me to catch more plays like this in real time. 🚀
Entry: 4.2
TP: 10
SL: 3.3

ELPI (VCP - 26W 14/4 3T)Position update: March 25, 2025.
Key factors:
1. Confirmed stage 2 uptrend.
2. A textbook double bottom with VCP characteristics.
3. Has gone through its majority line of supply.
4. Moving on its own drummer, the stock consolidates while the index suffers a terrible decline.
5. High relative strength.
6. Volume dries up as less supply coming to the market.
7. Strong fundamentals, with consistent year-over-year earnings growth.
Considerations: Despite these strengths, the broader market remains in a bearish phase, down over 20% from its all-time high. Geopolitical risks, persistent net foreign selling, declining investor confidence, and concerns over the government downplaying the stock market's significance continue to contribute to an unstable market environment.

LONG ON GOLD (XAU/USD) GOLD Has given a nice pullback to a supply area and has also given us bullish divergence.
I will be buying gold looking to make over 1000 pips.

EUR/GBP Analysis Double Bottom Breakout Toward TargetOverview of the Chart
This chart displays a EUR/GBP daily timeframe setup, highlighting a Double Bottom Pattern, a well-known bullish reversal formation. The pattern consists of two consecutive lows at a similar price level, followed by a breakout above a key resistance zone. This setup suggests a potential trend reversal from bearish to bullish.
Technical Analysis Breakdown
1. Double Bottom Formation (Reversal Signal)
Bottom 1: The first low was established after a prolonged downtrend, where the price found support and bounced higher.
Bottom 2: Price revisited the same support area but failed to break lower, indicating that sellers are losing strength and buyers are stepping in.
A double bottom pattern signals that the asset is forming a strong base and is likely to move higher after breaking the neckline (resistance level).
2. Support and Resistance Levels
Support Level (~0.8322):
This level acted as a demand zone, preventing further downside.
It marks the price area where buyers accumulated positions, leading to a reversal.
Resistance Level (~0.8500):
This level previously acted as a supply zone, where sellers controlled the price.
A breakout above this level is crucial to confirm the bullish trend continuation.
3. Breakout Confirmation & Retest Expectation
The price successfully broke above the resistance zone, confirming a bullish reversal.
A potential retest of the broken resistance (now turned support) could occur before further upside movement.
Traders often wait for this retest to confirm that the breakout is genuine before entering a position.
4. Price Target Projection
Based on the measured move strategy, the expected target is calculated by measuring the height of the double bottom pattern and projecting it above the breakout zone.
Target Price: 0.8742, aligning with historical resistance levels.
5. Stop Loss Placement
Stop loss at ~0.8322 (below the double bottom support).
This ensures risk is managed in case of an invalid breakout or a false move.
Trading Plan & Execution Strategy
📌 Entry Strategy:
✅ Breakout Entry: Buy after the breakout above resistance.
✅ Retest Entry: Wait for a pullback to the previous resistance (now support) before entering.
📌 Risk Management:
🔹 Stop Loss: Placed below the recent support at 0.8322 to limit downside risk.
🔹 Take Profit: First target at 0.8742 based on the double bottom structure.
📌 Market Outlook:
A successful breakout and bullish momentum could push prices toward the target.
If the price fails to hold above the breakout zone, a deeper retracement could occur before continuing higher.
Conclusion
The EUR/GBP pair has formed a bullish double bottom reversal pattern, signaling a potential uptrend continuation. The key levels to watch include 0.8500 (resistance turned support) and 0.8742 (target projection). Traders should monitor price action around the breakout zone for confirmation and consider risk management strategies before entering a position.
