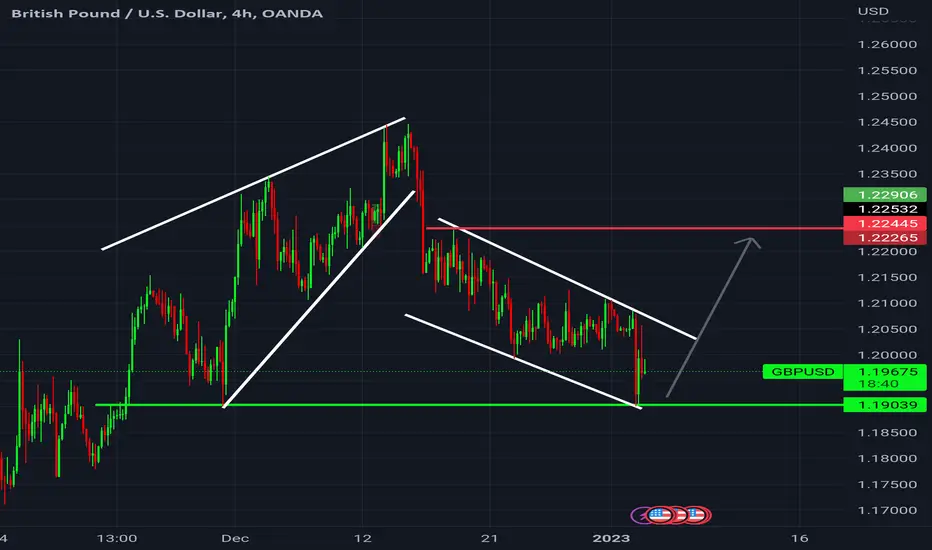
GBPUSD a Buy?Looking at GU for potential buy. Double bottom on 200ema support. Price crossed over and retested 50 ema as a support. Risky buy, but I am in and will see how it plays out
Double Bottom

HINDUSTAN COPPER LTD - Keep an Eye + Double Bottom Pattern 📊 Script: HINDCOPPER (HINDUSTAN COPPER LIMITED)
📊 Nifty50 Stock: NO
📊 Sectoral Index: NIFTY METAL
📊 Sector: Commodities Metals & Mining
📊 Industry: Non - Ferrous Metals Copper
Time Frame - Daily
Script is forming Double Bottom Pattern as shown in a chart.
Key highlights: 💡⚡
📈 Script is trading at upper band of Bollinger Bands (BB) and giving breakout of it.
📈 MACD is giving crossover.
📈 Double Moving Averages also giving crossover.
📈 Volume is increasing along with price which is volume breakout.
📈 Script may give breakout of Double Bottom Pattern.
📈 Current RSI is around 65.
📈 One can go for Swing Trade ONLY ABOVE 125.
BUY ONLY ABOVE 125
⏱️ C.M.P 📑💰- 123.40
⚠️ Important: Always maintain your Risk & Reward Ratio.
⚠️ Purely technical based pick.
✅Like and follow to never miss a new idea!✅
Disclaimer: I am not SEBI Registered Advisor. My posts are purely for training and educational purposes.
Eat🍜 Sleep😴 TradingView📈 Repeat🔁
Happy learning with trading. Cheers!🥂

The Doube Bottom Pattern - Bullish PatternThe **Double Bottom** is a price action pattern that is indicative of a trend change once activated. Price needs to establish a bearish expansion towards the lows before reversing with an impulse. The impulse then needs to get sold into; this will create a retest of the previous low that must hold. Price action will establish a “W” structure which become a sign of demand that leads to a bullish expansion.
Key Characteristics of the **Double Bottom**
- Price Action must first establish a bearish expansion
- The retest of the previous low most hold
- A ‘W’ like formation will confirm demand at the lows

Double Bottom on USD/CHF @ D1This double bottom pattern has formed on the daily chart of the USD/CHF currency pair after a long downtrend. It is now providing a potential bullish breakout opportunity. The two bottoms are marked with the lower yellow line; the neckline is marked with the upper yellow line. My potential entry level is at the cyan line. My potential take-profit level is at the green line. A stop-loss (not shown on the chart) can be set to the low of the breakout candle or to the low of the preceding candle should the breakout one appear mostly outside the pattern's borders. I will ignore bearish breakouts from this trend-reversal pattern.

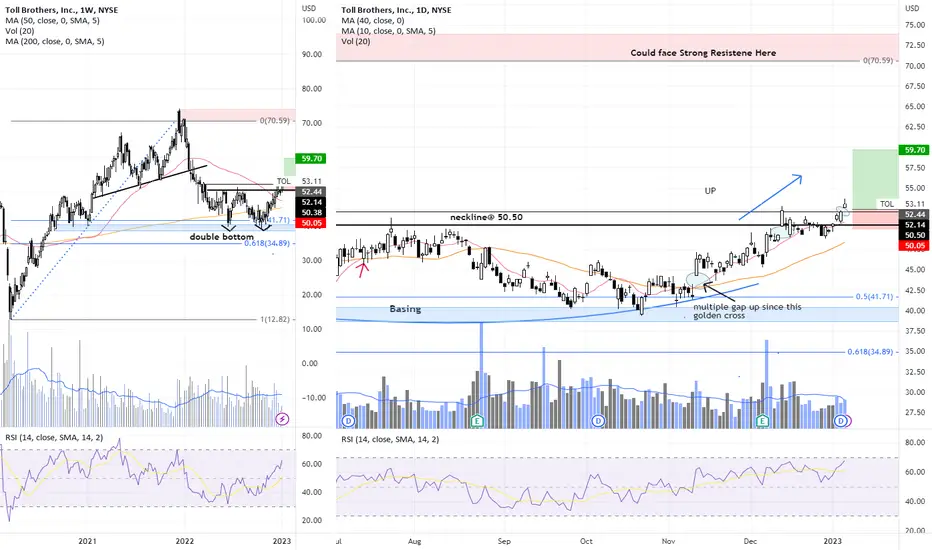
TOL - Buy the dipsHome builders had a steep fall in the 1st half of 2022 and had been building a base in the 2nd half. They have now emerged from the base and appear to be on the slow path to recovery.
TOL has seen at least 3 gap ups since it's last golden cross on 8 Nov22. A sign that moemntum has been building since this golden cross. There was an attempt to break above it's neckline @ 5.50 on 13 dec but soon dips below again (a shallow dip though) until it propelled above the neckline again at the start of this year.
Any near term dip would be a low risk opportunity to long with initial stops just below $49.
Disclaimer: Just my 2 cents and not a trade advice. Kindly do your own due diligence and trade according to your own risk tolerance and don't forget that money management is important! Take care and Good Luck!
GOING LONG IN GBPNZDDouble Top Formation indicates the trend reversal in 30 min TF
Higher Highs and Lows
Bullish Divergence found


Ford(F) - Double Bottom - BullishOn the chart of Ford, we can see a forming double bottom pattern on a daily timeframe.
A double bottom pattern may suggest a bullish reversal. When the price reaches and breaks out of the neckline a long position can be taken. But first we have to be patience and wait for the price to reach and test the neckline.
All further details are shown on the chart.
Goodluck!

EURUSD Idea 1/4/2023Trading is all about patience. If you’re not patience, the probability of failing is very high. Here is my thoughts of EURUSD
Simply break and retest. Looking for short positions to next area of interest. (1.04500 )
Look at smaller time frames for patterns such as double tops and double bottoms for more confirmation.
Remember to trade responsible. This is not a signal at all, just my thoughts.

GBPUSD, will the weakness of DXY cause a Reversal?Price action is indicating a reversal may be coming soon. Currently we are moving within a descending channel approaching a double bottom area which we may get a buy opportunity if confirmation is met.
Thanks
Trade Safe
crypto harm reduction plan (trade boomer commodities instead)hi, hope all is well and you are all taking care of yourself
*boomer rant incoming*
the crypto market is the worst of all corners of the internet and finance. a bloodthirsty chimera of all our traps and shortcomings on the designer steroids of tech. "the crypto space" is designed to make you miserable, alone, addicted, ashamed...in a state of mind that makes you more susceptible to the loss chasing it's manipulated to push you into. bleeding out your already serotonin and dopamine-starved brain, and making you feel like you have something to prove the deeper you go. to yourself, to your ideals, to your desperation over the financial system and debt-based USD hegemony. farming misery to steal yr coins. don't fall for it. you are fearfully and wonderfully made. position yourself to succeed. everyone says to take breaks but we all know how hard that is with a 24/7 market when we can't live a minute without our phones anyway
/boomer rant (and possible crypto bottom signal, i know ;-) actually still thinking crypto will bounce soon)
the good news is i've had much more success trading this gold range and i feel much better mentally, physically, and spiritually
market closes an hour a day and on the weekends, highly recommend. (absolutely medical advice)
(fib spirals made from double bottoms as per usual, different orientations visually fit til one emerges victorious as s&r...important to remember they are just s&r's. they are just curved trendlines with acceleration and decay, they can break and they are not 100% precise...always manage risk. and lock your scale. mine is 1:1 here, and lately i've been trying to use multiples or factors of 10 (10, 100, 0.1, 0.01) depending on what looks best with the timeframe)
not sure when/where the range would top out, just been trading it smallest possible positions for now. rewiring my brain. if ihs plays out looking at 1920-1930, which would also jibe with the highest resistance spiral. still working out timefibs
sacredtraders.com
sacredtraders.com
both have amazing free vids on youtube, jenkins' www.youtube.com is really all you need, watch at 0.5x speed over and over again
take care, and always remember money aint shit. It's all God's anyway

MINA - DOUBLE BOTTOMI bought my position today
The reasons:
1. Low-risk entry
2. The stock has a classic double-bottom pattern
3. The second leg (Y) undercuts the first (W)
4. It has the handle offering the low-risk pivot area
5. Brokeout with huge volume

CADCHFDue to the lack of ability to break the support and the confirmation of entry into the long trade, a suitable opportunity for trading has been created.
Stay with me to get more analysis after following me by sharing with friends and leaving a comment.
According to my risk and capital management system, the risk of each trade is one percent per position.
What do you think about this analysis and other analyses?
What symbol would you like me to analyze for you?

2023 New Year Long Opportunity - $BABAI'm looking for a long opportunity on NYSE:BABA in 2023.
Before 2022, it's all-time low was $57.20, and it tested and closed above this level in the fourth quarter of 22'.
This leaves me to believe, $BABA will be a good long-term opportunity for this year.

USDJPY IN CHANNEL DECISION TIMELooking at USDJPY I see only two options for this week ahead. We can either double bottom here where it reversed last and test the channel again or we continue down in the Channel and find support at the lower Channel trend line.
- watch out for reject and double bottom here
-if no rejection buy setup on the lower channel but also sell set up if we turn support into resistance
- Follow the DXY see how it reacts

USDJPY, Short term growth for USD.HTF Bullish
LTF Bullish
Double Bottom, Descending channel.
Looking to see how price reacts at the double bottom level to give a buy opportunity.
Thanks
Trade Safe

EURNZD Idea 12/29/2022 Trading is all about patience. If you’re not patience, the probability of failing is very high. Here is my thoughts of EURNZD
I am currently 150 pips in profit. I am now looking for an additional entry. Lets see price go back up to 1.68250 and look for exhaustion, double tops, bearish engulfing on the smaller time frames for confirmation to go downwards some more.
Look at smaller time frames for patterns such as double tops and double bottoms for more confirmation.
Remember to trade responsible. This is not a signal at all, just my thoughts.

JOE/USDT BINANCE SPOT LONG IDEA 🚀🚀Hi guys
Joe is about breaks downtrend if breaks then when we can see the price at 0.18$++
Please check my previous given signals if I am wrong then don't follow me
Please like my idea and follow me for more strong signals

USDCHF analyseDouble bottom pattern realized. The price will go up. You can check...
Entry price: 0.93680
TP: 0.94558
SL: 0.93330

✅USD_CHF BULLISH BIAS|LONG🚀
✅USD_CHF broke the falling resistance
So after the pullback and retest
A move up is to be expected
To retest the level above
LONG🚀
✅Like and subscribe to never miss a new idea!✅

ATA/USDT LONG IDEA BINANCE SPOT As you can see in the chart that there's 2 pattern has been formed
Double bottom and falling wedge
It's a spot trade

ETH/USD Daily Levels — December 21st, 2022Looking at Ethereum on the 12-hour time frame we see the bounce from the $1,161 level which could’ve just formed the local bottom for this next swing upwards.
1st target I’m aiming for is $1,287 and then we’ll re-evaluate from there, but huge capitulation move down in November, so would expect the same set of volatility to reclaim back on the upside.
Trade is invalidated with a close underneath $1,161, from there, looking at $1,110. As of now, price action is looking good.
As always please do your own research, I am not a financial advisor.

COMPUSDT is creating a double bottomThe price is testing the demand zone on the daily timeframe where the market is creating a double bottom.
How to approach it?
IF the price is going to grab new liquidity, we could see a pullback untile 0.5, 0.618 Fibonacci level, so According to Plancton's strategy , we can set a nice order
–––––
Keep in mind.
🟣 Purple structure -> Monthly structure.
🔴 Red structure -> Weekly structure.
🔵 Blue structure -> Daily structure.
🟡 Yellow structure -> 4h structure.
⚫️ black structure -> <= 1h structure.
–––––
Follow the Shrimp 🦐
