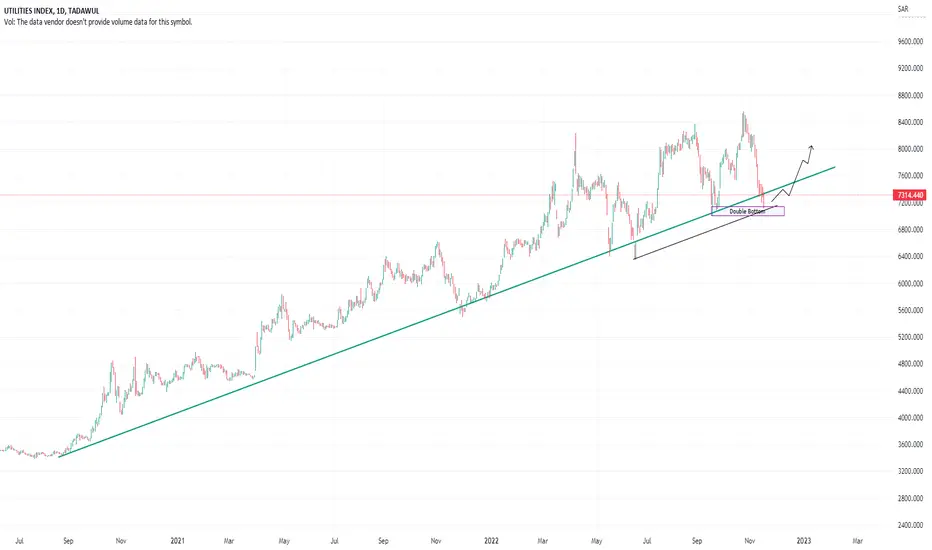
TUTI: UTILITIES INDEXIndex is continuously in Bullish trend within Ascending Parallel Channel
Recently Channel bottom seem to be broken, however, confirmation is needed for either false breakdown (as in recent past) or downtrend.
Double Bottom is observed and expected to take an upside movement.
Check individual stocks in the sector for entry with proper stop loss.
Double Bottom
AAVE (AAVEUSD) Bottom forming?!As we look at the hour chart of AAVE, I am seeing a little more downside, which hopefully we finish off today and look for a sharp rally above the $70's. I will be keeping an eye on this crypto as it continues its last decline.

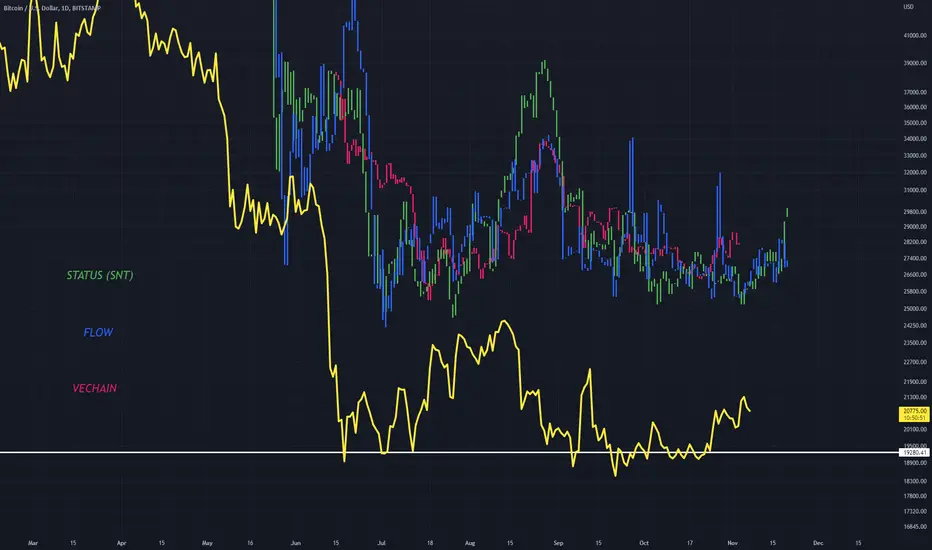
BTC !! Fantastic & life-changing opportunity or lower pricesI'm looking at 30D chart adding 2 customized indicators which show amazing history data)):
Red columns on first indicator show BTC bottoming process in a bear market and when green color flashes after red new uptrend / bull run starts/.
When green columns appears on 2d indicator it means BTC has already bottomed and when white color follows green column, it marks a new uptrend/bull run/ start.
Be smart and make life-changing decisions.
Don't miss such kind of fantastic opportunity.
To tell the truth I don't expect lower prices.
Based on my analyses new uptrend starts in December 2022:
My worst case scenario is 13.7-14K - 25-30% probability and new uptrend from this point with double bottom 70-75% probability.
People think BTC broke 17.5-18.5K support and expect lower prices, But I think this is one of the biggest bear traps/fake break down/ in BTC history and expect lower prices like 12-14K or even lower 8-10K.
But BTC will surprise everybody like it did in 2021 November when everybody expected 100K + $ BTC, now when everyone is waiting lower prices BTC will pump with double bottom pattern as it dumped from 69K making double top.
If you like my ideas , don't forget to follow me please. I will appreciate a lot.

BTC Bullish idea !Description
Hy Guys My Name is Harmain Welcome To My Trading View Ideas Page !
Here is a Analysis of BTCUSDT in 4H Time Frame
Trade Plan
(Entry Setup)
Acording to Bullish Senerio BTC Accumalated Current Bullish Order Block + BTC Creating Double Bottom and W Pattren + in 4H Price is Acting as a Dynamic Support of 21 EMA + POC Level
(Target Setup)
Maybe Price Reached The Value Area High(VAH) + Price Filled the Imbalance (IMB) or Fare Value Gap (FVG) + Eat The Bearish Order Block
Thanks For Visiting Cryptologic Bulls

LONG ON USD/CADPrice has been falling on this pair for some time but now it is coming up from a oversold state on the rsi with divergence.
Price also created a double bottom at a major support level/key area.
I expect price to rise to the next resistance level.
Here is the play i will be taking on this pair:
Entry - 1.33066
SL - 1.32596 47 PIPS
TP - 1.35383 231 PIPS

Calling bottom fpr pbhPotential double bottom, hammer candle to give some reassurance. Will be interesting to see what happens here, history shows it can run good when they take the brakes off.

BTC! Where is a real Bottom of BTC bear market?I'm looking at weekly timeframe of BTC chart. I'm comparing 2021 Bull market top with 2022 bear market bottom.
Call me crazy but I think a real bottom of BTC bear market was in June 2022/at 17.5K/ as BTC real top of Bull run was in April 2021/at 65K/
Nov 2022 bottom is a bear trap and fake break down like Nov 2021 top which was bull trap and fake break out.
I incline to think BTC bottom was at 17.5K on 18.06.2022 as I mentioned in my previous analyses coz I trust all my previous and current analyses , all history data, super powerful indicators which flashed BTC bottom only 3 times in BTC whole history and more than 20 powerful charts and analyses I have done since June 2022.

DXY attempting a double bottom breakout.We just achieved a higher high on the daily time frame with DXy’s price action. Considering how long the history of the chart covers (several decades) the larger weekly and monthly time frames lower high/lower low & higher high/higher low sequences are probably more important for bull and bear trends than the 1 day is. So even with a higher high on DXY’s 1 day chart it will still just be another lower high on the weekly and monthly charts unless price action can get above this top green horizontal at $121. So even if DXY were to trigger this double bottom breakout and hit it’s full target of $117 it would still technically be a lower high on the macro timeframes unless it kept going and made it above $121. The current macro chart has been in a lower high/lower low bear pattern since the 70s if not much earlier. Considering the dollar has lost 97% of its purchasing power over the years and we just printed a ton of money and will likely continue to do so with inflation continuing to fly more and more out of control…it seems more likely that DXY’s price action does not get above $121 and instead forms yet another macro lower high before it turns back around. If we do trigger this double bottom pattern however then crypto will likely continue to see prices drop while it heads toward the double bottom target, since the DXY and crypto seem inversely correlated. *not financial advice*

Gold $1680 ShortWe had a higher time frame Inside bar print last week.
Today the PA has pushed through the high of that IB and is now flirting with the idea of coming back into the range.
If successful the bears should target the double bottom and all the buy stops down there.

USDJPY: BUY for continouation of yesterday's upmoveUSDJPY is testing yesterday's resistance zone at 145.90-146.10 that now turned to support. We will buy at this area with stops below 145.60.
Targets 146.75 and 147.10

Perfect double bottom?Bitcoin may be forming a perfect double bottom pattern such as the one we saw in the 2014 bear-market:

XAU GOLD Trade Review | 5000 PIPS!Hello fellow traders, Nick here from CoinTraders Daily testing out TradingView as a content platform =)
This gold setup ended up being our biggest winner of the year so far and I would love to share it with you guys.
We had major confluence between our momentum indicators , structure levels and fundamentals for a huge move.
For now the double bottom neckline has been broken thus confirming the bullish chart pattern.
However, we have a big fundamental week upon us with midterm elections and inflation data.
Ill be uploading a followup analysis for the next longing opportunity, so stay tuned for that =)
I hope this post has earned your thumbs up, and that you have enjoyed it or learned something new.
As always, stay safe, manage risk and I'll catch you on the next one.
Much love and good luck!
#gold #xauusd #forex #swingtrading

Common Double Bottom StructuresShowing double bottom structures that can be seen across the board, with Bitcoin being in yellow.
Its interesting because these altcoins are heavily following BTC which in the past hasn't always been the case.
I have listed three for example however there are definitely many more I have came across.
I wonder how the bullish reversal (consequent of double bottom) will play out :0
UJ Double BottomUJ is sitting at a key demand zone. We may see a double bottom materialize and revisit market structure.

Aditya Birla Capital Double bottoms formation*Aditya Birla Capital*
Time Frame: Daily
Observation:
* Double bottoms formation
* Swing High Break
Resistance/Target: 129 139 151 159
Support: 108 103

ETHWUSD: Bullish Shark at .236 and Support Confluence AreaETHW sits at a Support Zone and above the .0.236 from High to Low at the PCZ of a Bullish Shark. It is bottoming out for the second time while showing extreme amounts of Bullish Divergence on the second Bottom. If this plays out i think it can atleast rise up to the .886 from here.

BTCUSD: Hit our TARGET! What are the next key points to watch?• BTC hit the target we mentioned yesterday, as it triggered our Double Bottom chart pattern. The link to my previous analysis is in the link below this post;
• Now, BTC shows some exhaustion, but it is still bullish in the short/mid-term, as it is doing higher highs/lows and it is above its 21 ema;
• There’s no clear bearish top sign yet, and BTC would only trigger a sharper correction if it loses the dual-support area made by the 38.2% retracement + 21 ema in the daily chart;
• In fact, if it closes above the $20,800 in the daily chart, it’ll trigger another bullish pivot point;
• For now, let’s keep our eyes on these key points. I won’t set any other public target on it for now, but I’ll keep you guys updated on this.
Remember to follow me to keep in touch with my analyses!

Speculative double bottom on digibyteDigibyte has done nothing to show that its about to reverse its downtrend yet, however we are starting to see the inklings of a possible double bottom forming. This is still so early in the pattern that its almost pure speculation on my part at this point. You should never try to trade a pattern until it has confirmed either a breakout or a breakdown. Although this could easily end up a fakeout that sends digibyte lower continuing its downtrend, with so many alts recently seeing bullish surges there is certainly a chance this double bottom could end up playing out. If it were to it would be close to a 180% gain from this level. WE can see there is also a possibility here in the near future of a golden cross. The fact that many other alt coins have recently seen successful golden crosses with QNT leading the way, gives us bullish confluence that increases the probability that digibyte could also experience a successful golden cross in the near future. Still mostly speculation at this point, but just enough bullish confluence to keep an eye on this one and see how it develops. *not financial advice*

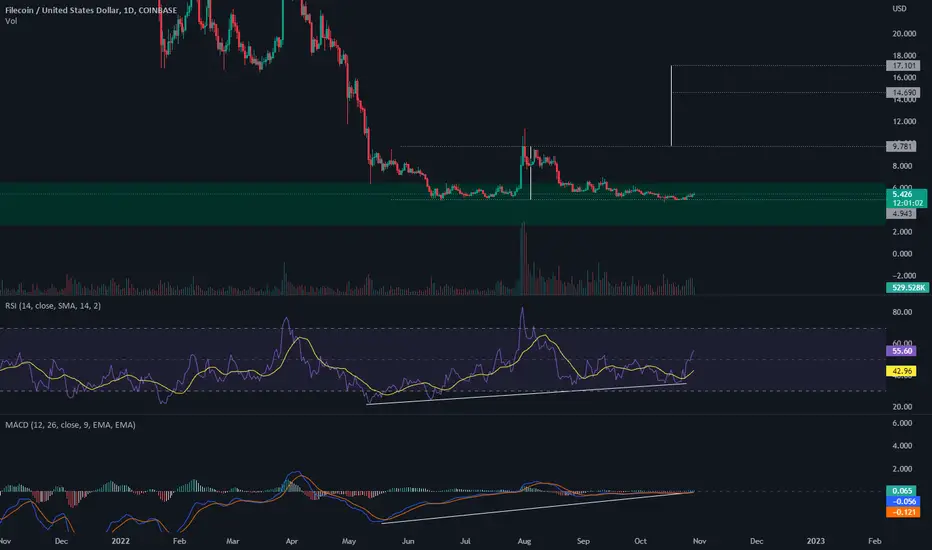
Double Bottom just inside Weekly SupportExpecting at least $15-17 (1.5x measured target) if we cross $10
BTCUSD: Trading at a KEY SUPPORT LEVEL!• BTC is in a key support level. We see a Double Bottom around $20k (1h chart), and BTC just hit the 38.2% retracement in the daily chart, which is very close to the 21 ema as well;
• Although today’s candlestick is bullish, BTC has yet to break the black line at $20,387, as this is the trigger point for the Double Bottom;
• In this scenario, BTC would seek the next resistance, at $20,800;
• What could frustrate this scenario? If BTC loses the retracement level, along with the 21 ema in the daily chart. This would frustrate the bullish bias in the mid-term, and in this scenario, BTC would seek the next retracements as support levels.
Remember to follow me to keep in touch with my analyses!

2B Trading PatternIn an uptrend, if a higher high is made but fails to carry through, and then prices drop below the previous high, then the trend is apt to reverse. The converse is true for down trends. This observation applies in any of the three trends; short-term, intermediate-term, or long-term.
A 2B on a minor high or low will usually occur within one day or less of the time the high or low is made. For 2B's on intermediate highs or lows preceding a correction, the new high or low point will usually break within three to five days. At major market turning points, long-term 2B's, the new high or low will usually break within seven to ten days. In the stock market, after the new high is made, the failure to carry forward usually occurs on low to normal volume, and the confirmation of a reversal occurs on higher volume.
The above can be found on the internet, just look up 2B chart pattern.
I would usually recommend your default as being, sell low, buy lower. & buy high, sell higher.
My next trading mantra would be that double bottoms are not Support, and double tops are not Resistance. They are where the stops are. And therefore a major target.
But every now and then the market does turn. After a period of impulsive moves, the market comes to rest and goes into a consolidation. It may make one last attempt at continuing the prevailing trend, only to find there are fewer market participants willing to push it on. This is when you look for 2B's

EURAUD - Double bottom patternOn EURAUD, there is a break of the neckline of the double bottom and currently retesting for a possible move to the upside

BTC inverse Adam & EveDouble bottom in falling wedge on BTCUSDT on daily ?
Confirmation over 24.4k-25.3k range.
1. Double bottom target is 32k
2. Second target should be the 0.786,0.886 fib zone of previous wave down B-C
3. 56k final measured move of the falling wedge.
The stop loss should be around the 19k level
