SUKU - Potential Double Bottom Targeting $2.30 - $2.70If SUKU has double bottomed here, we could see potential growth from the area of 9 cents up to 2.3 - 2.7 dollars by winter of this year or early 2023.
Trend-based fibs, measured from opening day -> bottom -> first top give us a golden pocket in the exact same target area as conservative and more aggressive measured double bottom targets, for confluence.
For this to remain a possibility, we need to hold above the area between ~5-7 cents (no new ATLs).
In support of this idea, we've seen highest buy volume in SUKUs history here in the area of the proposed double bottom. Price has yet to reflect this.
Double Bottom

EURUSD Double Bottom Price Going UpHello Guys, Based on the 1 H time frame chart for EURUSD we can see that price was failed to make the lower low and stopped at the demand zone around 0.99384-0.99503. for that situation we can see the double bottom pattern at that area so we expect that the price want to go higher to find the supply above.
Guys, If we look to the awesome oscilator also we can see the divergen which is at the chart price make the lower low (Increasing Bearish) but at the awesome oscilator the price make the higher high (Increasing Bullish).

Bitcoin Double Bottom!10/29/2022 #Bitcoin Update! This is the only Chart you need to watch this Week. Bitcoin’s Daily Chart on #Bitstamp Just Printed a #Double #Bottom!
#BTC $22,700 - $23,000 coming up this week to a theater near you!

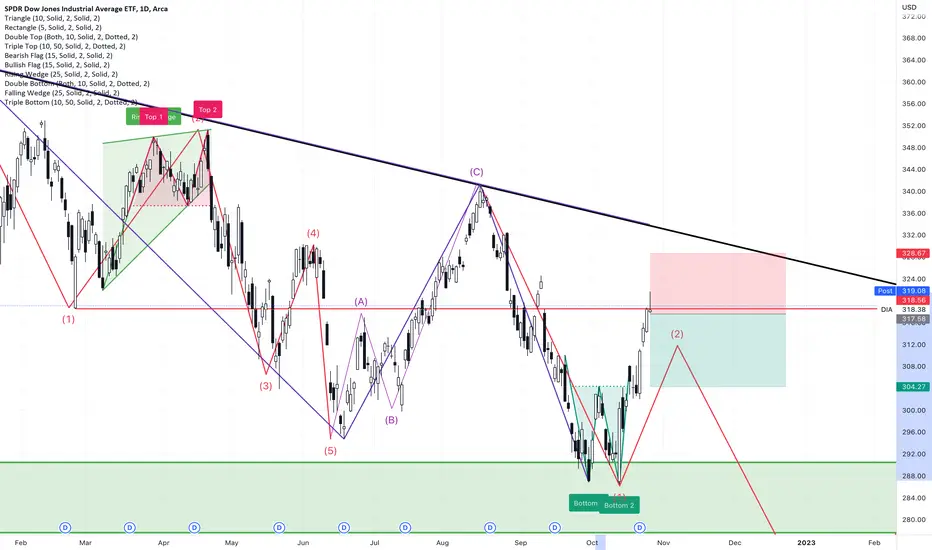
DIA daily bearish hammer at resistance and double bottom targetOrder SELL DIA ARCA Stop 317.58 LMT 317.58 will be automatically canceled at 20230401 01:00:00 EST
DIA daily bearish hammer at resistance and double bottom target expect retest of the neck at least.
QuantumScape Falling Wedge Leading to EarningsI think that QS will see 12-20 dollars again based off the Bullish Divergence on the Weekly Double Bottom and the Falling Wedge and the stable earnings relative to other companies of the same sector.

GJ buyGJ has formed a double bottom on the 30min and the 1hr chart. The 30min chart has formed the double bottom on a 200ema support. Price went up, came back for a retest to confirm a buy. I jumped into a buy from the close of the previous stick bullish stick...We should go up to 169.683 at least. If you scalp you will catch good pips. Zone to zone trading is the safest on a volatile pair like this. Wait till we get to the zone and see what price does

Long BTCUSDTOn my previous posts, I already warned so many times that whales buying and retails selling and some refused admit that they are wrong.
I already warned retail traders so many times that it will make a double bottom and go up. Yet, some people act like they are very smart.
The whales are manipulating the price action to traps retails to short the bottom and reverse it up.
Investing and trading is a game of probability where the market moves up, down or sideways. Hence, the probability of a trader winning is around 33.33%.
In my previous idea, one guy thought he was smart when I talked about this accumulation and said RIP wychoff and here we are going up.
The crowd and retails are always wrong, people are too bearish at the bottom of a cycle and too bullish at the top of the cycle.
Sometimes, trading and investing is so simple with just copy and paste. But some people tried to be smart,
A lot of traders try to be right after I warned about the institution Wychoff's manipulation and some refused to listen and give into whales manipulation.
Some traders tried to aim for 16k price for BTCUSDT to buy the dip, but it never happened, the only way you can get rich is to buy at 20k and HODL.
Talked about it so many times and yet people still love to donate to the market trying to be smart.
The cryptocurrency , Bitcoin or BTCUSD is now trading at the golden support again with whales manipulating retails to short at support before doing a Wychoff's accumulation and reverse to the upside.
The manipulation was a huge success but I tried to warn the stubborn poor retails traders but yet they refused to listen. Only few listened, I hope they are in profits now.
Bitcoin prices had been ranging around at 20k as I said and now it had made a double bottom , soon it will continue to go up and everyone will get rich. A double bottom of a double bottom .
It had made an impulse correction and soon will go to 35k to fill the gap and beyond, to da moon.
On weekly, the chart had not broken the low and is making a higher high, soon it will go to the moon, buy now.
Amplify your gains by using leverage, long here and u can be filthy wealthy. Time to go all in and get rich.
Bitcoin or btcusd had made a double bottom technical structure. Bitcoin is doing the same Wychoff's accumulation and soon shall reverse the trend and bottoms here.
Do not be tempted by whales to short on bear traps!!
Warning, DO NOT short the market and get short squeezed. Buy the DIP.
I see a lot of retail traders lost money shorting bitcoin at 20k instead of buying it, this is your last buying opportunity before we move up to 35k to fill the CME gap.
The whales had been doing manipulation on bitcoin and ethereum .
It had already made a 5 waves up and will do a correction before pushing further up to 35k to fill the cme gap.
DO NOT MISS THIS last chance to buy the dip opportunity.
The whales are tempting you to short bitcoin so that they can push the prices up by doing this sideways movements.
Do not be deceived by the whales manipulation.
This manipulation by whales are food for them as retails traders getting liquidated easily.
The whales are accumulating. It is trapping breakout traders to short here, this will bottom here.
Long btc . Sick of this sideway obvious manipulation by whales.
On a higher time frame, it made a impulse and ABC correction, soon it will moon and everyone will get rich like WOW?!
This is not a signal and do not follow but a trade idea. Use your brain to trade and don't follow blindly!
Disclaimer - This analysis alone DOES NOT warrant a buy or sell trade immediately. Before you enter any trade in the financial market, it is very important that you have a proper trading plan and risk management approach

GE: Double Bottom?!General Electric Company
Short Term - We look to Buy at 72.25 (stop at 68.61)
Posted a Double Bottom formation. This is positive for sentiment and the uptrend has potential to return. A weaker opening is expected to challenge bullish resolve. Support is located at 70.00 and should stem dips to this area. Dip buying offers good risk/reward.
Our profit targets will be 81.26 and 83.00
Resistance: 81.50 / 96.00 / 108.00
Support: 70.00 / 60.00 / 44.00
Please be advised that the information presented on TradingView is provided to Vantage (‘Vantage Global Limited’, ‘we’) by a third-party provider (‘Signal Centre’). Please be reminded that you are solely responsible for the trading decisions on your account. There is a very high degree of risk involved in trading. Any information and/or content is intended entirely for research, educational and informational purposes only and does not constitute investment or consultation advice or investment strategy. The information is not tailored to the investment needs of any specific person and therefore does not involve a consideration of any of the investment objectives, financial situation or needs of any viewer that may receive it. Kindly also note that past performance is not a reliable indicator of future results. Actual results may differ materially from those anticipated in forward-looking or past performance statements. We assume no liability as to the accuracy or completeness of any of the information and/or content provided herein and the Company cannot be held responsible for any omission, mistake nor for any loss or damage including without limitation to any loss of profit which may arise from reliance on any information supplied by Signal Centre.

EURGBP - BULLISH FALLING WEDGE 🚀The EURGBP price is in Support Line & Bullish Falling Wedge Pattern 🧐
the key level is broken and Retested ✔
so, i predict a bullish move 📈
TARGET: 0.89361 🎯
...
if you agreed with this IDEA, please leave a LIKE, SUBSCRIBE or COMMENT!

ITMG - DOUBLE BOTTOMI got positions today
The stock breaks out of a double bottom setup.
This is a small base for a setup, I plan to trade this quick.

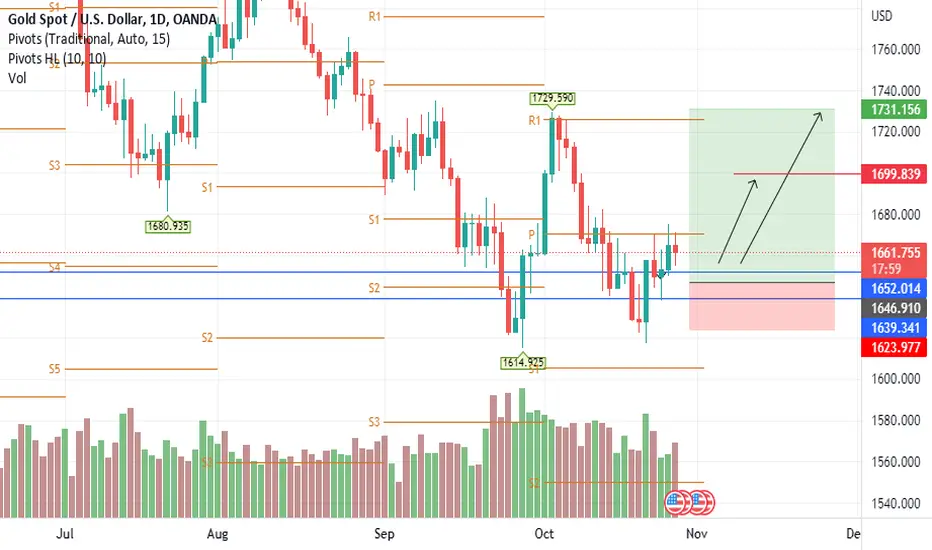
Tue 25th October 2022 XAU/USD (Gold) Daily Forex Chart Buy SetupGood morning fellow traders. On my Daily Forex charts using the High Probability & Divergence trading methods from my books, I have identified a new trade setup this morning. As usual, you can read my notes on the chart for my thoughts on this setup. The trade being a XAU/USD (Gold) Buy. Enjoy the day all. Cheers. Jim

XAUUSD We may see a trend reversal in gold soon.
Because the price did not have the strength to renew the minimum in September and renewed the maximum.
To enter the trade, we can rely on 2 graphic analysis (double bottom and QM pattern)

BTC - Ready to RiseChart shows the possibility of the BTCUSD bullish cycle and the targets.
BTC tested 2017 peak at 18-20k. This can be attributed to the low volume, as this is typical for testing.
If the test is successful, we can hope for a new peak - above 70k.
RSI also bottomed out and found long term support. In addition, we also have a double bottom on the chart.
As you can see, there are quite a few reasons to be optimistic about the growth of crypto currencies.
Best of luck.

Gold Double Bottom Gold has formed a double bottom with bullish divergence.
We can expect the price to gather bullish momentum and move towards the resistance level 1700.
The bullish bias is valid as long as price holds above 1640.

Gold 4hr analysisGold formed a double top on 6 October, if you go further back in my charts you will see I highlighting that. As I have said, the market moves in 3 levels most times. And on the 4hr it has made 3 intraday levels down from last week.
If you look at the yellow box support, the price should go back down to test this structure. This is a very dangerous zone, because on the daily chart, we have made 3 levels down from the second leg of a massive double top on the 19th of April , and as the picture paints, I predict a very strong double bottom formation on the daily as well as on the 4hr. So I am in a small sell now, down to that zone, and then I will wait for confirmation of the buy from the zone, and buy it back up
So flip into the daily, give it a look and let me know if you see what I see.

GOOGL | Wave Projection | A-wave Correction Bullish DivergencePrice action and chart pattern trading setup:
> A possible A-wave correction zone at 0.618 fib retracement from previous 5-wave uptrend as well as the head & shoulders target with a bullish divergence RSI indicator in weekly timeframe which is showing a strong reversal signal.
> In daily timeframe, the price breakout SMA20 with a small double bottom pattern and MACD golden cross signal line just below zero and now consolidating at upper key level resistance.
> If breakout, the upside is opened to a possible B-wave ABC uptrend with a target 0.5 - 0.618 retracement between +20 - 25% with its double bottom downside -7%, estimated risk reward ratio at 2.5:1
Good Luck
Always trade with affordable risk and respect your stoploss, nothing is 100%.

GBPCAD - BREAK OF STRUCTURE 📉The GBPCAD price is in Daily Resistance Level & Double TOP Pattern🧐
the neckline is broken & Retested 🔥
so! i predict a bearish move 📉
TARGET: 1.46886 🎯
...
if you agreed with this IDEA, please leave a LIKE, SUBSCRIBE or COMMENT!

Baloise - BALN• Possible double bottom formation with the first low end of September and second low mid-October
• Second low with slightly less volume than the first low
• Resistance line at CHF 132.40 which were tested in the last three trading days
• MACD crossed the Signal line near the top of the double bottom formation, which is showing a possible trend reversal
• If we finally see a crossover of the resistance line, further upside to CHF 141.10 will be possible (formation target price).
• The target price is slightly below the 23.6% Fibonacci Retracement (CHF 143.50), what could be a resistance this time.

US30 seems to be bottomed out After bad CPI numbers US30 managed to get to 28600 which is previous low.
Scenario 1. US30 is currently forming a kind of double bottom or "W" pattern, it will be confirmed as it breaks the neckline which is around 30312-30473. Breaking that zone would confirm that's its double bottom. Target of this pattern is usually the size from bottom to the neckline. which is at 32410.
Scenario 2. As you can see only 4hour candle chart, US30 is also forming up descending broadening wedge i.e. bullish chart pattern (said to be a reversal pattern) breaking out of this and would make our new target on top of the descending broadening wedge.
If you look carefully at fibs 0.382 (30790) seems to be like the important area which US30 must break and create support above it in order to move higher
Entry: breakout of neckline
TP1 : 0.618 fib (32129)
TP2 : 32564
TP3 : 34296
S.L : 2%
Remember I will be only taking trade as it breaks and creates support above the neckline
Trade safe.

AUDUSD > Possible Bottoming Here, the Trend May Shift Soon!!Analysis of #AUDUSD
The AUDUSD has formed double bottom near 0.6200, we kind of have a head and shoulders pattern developing now, we can be aggressive and enter a buy trade at the second shoulder if we get a reversal pattern at the lower time frame.
the other way we can trade this market is to wait until we have a confirmed breakout of the neckline resistance and then start trading the buy side if we get a valid setup that meets the rules
Thanks for your continued support!

HAVELLSHavells made double bottom pattern on broke above previous swing high with good volumes.
Could be bought with mentioned stoploss & target.

DXY has left the LAUNCHPAD... destination 160+DXY has left the LAUNCHPAD and is unlikely to return home until its surpassed 160!
From the chart we can see that DXY has...
- Emerged from the falling wedge with a measured move target of +72, taking us upto 160 OR BEYOND
- Has retested the falling wedge trend line and created a double bottom support
- DXY has performed these feats before (1980-1985) and is showing a similar emerging shape in the chart pattern and RSI
- If history repeats, we can expect this trend to continue through to Approx. 2025
Once these trends establish themselves its highly UNLIKELY that they do not go on to fulfil their potential. TIME IS RUNNING OUT for the DXY to get off this trajectory.
CONCLUSION: Long the DXY, Hold your DOLLARS
