LTCUSD possible double bottom trend reversalPotential double bottom trend reversal with LTC breaking out from falling wedge. Depending on what BTC does LTC may be a step ahead of BTC in trend reversal with BTC following close behind. This is a pair to keep an eye on in the near term as there is a great deal of positive news surrounding LTC in the coming week ahead.
Doublebottomreversal

Simple Double Bottom PatternLast week we saw a double bottom created on USDCAD 4 hour, with a decent outcome of the NFP last Friday it sent the Dollar flying against CAD. Clearly showing the double bottom pattern would have been perfect to buy once completed.

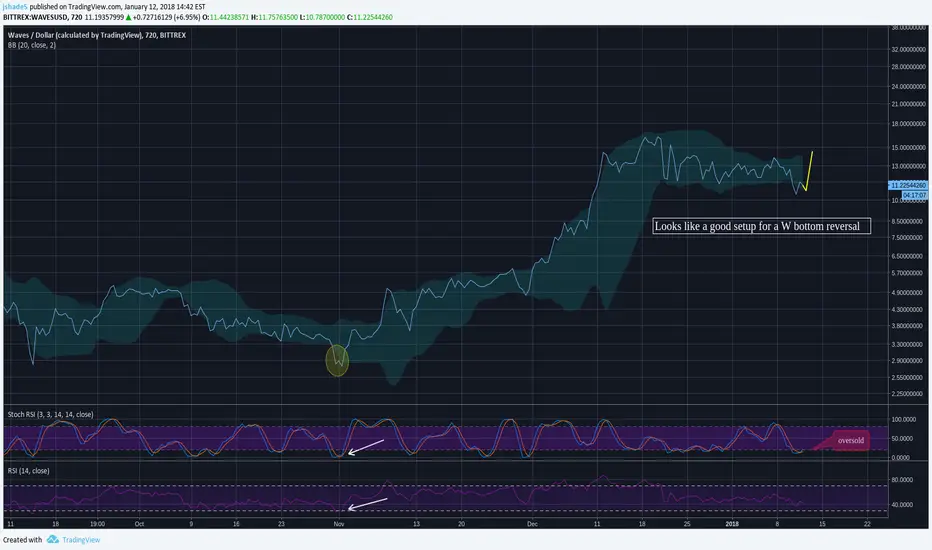
$waves short term reversal- oversold on stoch rsi
- close to oversold on rsi
- W bottom forming
Technically you should wait for the full 'W' to form before entering, but where's the fun in that. Easy scalp for a short term play. I'm holding it long. Just bored.
BTC/USD Double Bottom Formed... GOING TOWARDS MOONIts a double bottom pattern... Looking for bullish now.

EDG quadruple bottom. Reversal incoming?It should bounce from the bottom and come back to at least 1.0 fibbonacci.

Vedanta-Double Bottom Near Demand ZoneMarket Analysis: The pair is now trading near the demand zone. Now it has formed a double bottom near the zone level. If the market is able to break the resistance and closes above 295. We can go for a long with a target of 315. So let's wait and see what the market does in the coming days. Cheers!

TKS unusual attempt to tradeThis coin chart is very different from the rest of altcoins. I marked channel and it is very obvious that the coin is trading in between theses two levels(yellowish rectangle).
It is quite possible that the coin will reach highest high again in some time unless the channel will be broken and down trend will occur. I marked double bottom as well.
I think SL around 2500 is a good idea as the pair might go lower and it is hard to say if it will ever go up

Neo potential double bottom reversal - target price ~$51.5NEO/USDT is showing a potential double bottom reversal. if it can break both labeled resistance lines, target price is ~$51.5 based on pattern projection.
one thing that could interfere with this is BTC and ETH dropping in price further, which seems likely; likeliness to interfere with this movement in NEO is uncertain. these 3 are all somewhat tied to each other in price movement.
trade at your own risk.
