SWSOLAR: DOUBLE TOPNSE:SWSOLAR completed Double top formation and the candle has closed below the neckline given the breakout for the pattern. Stop loss and Target for the same has been given.
Double Top

Microsoft -> A Long Term Double Top?Hello Traders and Investors ,
my name is Philip and today I will provide a free and educational multi-timeframe technical analysis of Microsoft💪
On the monthly timeframe you can see that Microsoft stock once again retested the previous all time high at the $340 level and once again rejected it towards the downside.
You can also see that after the recent retracement on Microsoft, MSFT stock is approaching previous structure at the $320 level from which we could see a short term bullish bounce.
And last but not least I am just waiting for the daily timeframe to shift back to a bullish market before I then do expect a short term rejection away from the daily and weekly support area.
Keep in mind: Don't get caught up in short term moves and always look at the long term picture; building wealth is a marathon and not a quick sprint📈
Thank you for watching and I will see you tomorrow!
My previous analysis of this asset:


GBPAUD I Double top and correction downwardWelcome back! Let me know your thoughts in the comments!
** GBPAUD Analysis - Listen to video!
We recommend that you keep this pair on your watchlist and enter when the entry criteria of your strategy is met.

Double Top with Tweezer TopEUR/USD 1HR TimeFrame Double Top with Tweezer Top great confirmation for selling
Technical analysis on resistance

EUR/AUD Short opportunitySAXO:EURUSD Forming a Double Top on daily chart. Strong resistance at 1.6786. watching it to fail and to target 1.6600 follow by 1.63640 for long term.

AUDCHF - Head and Shoulders📉Hello Traders!
On The Daily Time Frame, The AUDCHF Price Formed a Head and Shoulders Pattern📉
The Neckline is Broken 🔥
So, I Expect a Bearish Move📉
i'm waiting for a retest...
-----------
TARGET: 0.57360🎯
___________
if you agreed with this IDEA, please leave a LIKE, SUBSCRIBE or COMMENT!

EURAUDEURAUD is trading in bullish parallel channel and reached at channel resistance. Fortunately channel resistance and long term double top resistance coincide at same point, which attracting sells to take control. Will sellers took benefits from these confluences and push the price to lower side?

EURUSD PRICE ACTION TRADING DOUBLE TOPEURUSD has formed a price action reversal pattern double top on its hourly chart and the price is trading below the Neck Line Breakout: 1.10050
targets
100%: 1.09626
150%: 1.09423
200%: 1.09211

BARUSDTRecently BARUSDT has shown good bullish momentum but failed to sustain it and formed double top pattern with bearish divergence and now showing sell pressure. Will the bears attack on these confluences and direct the price to downside?

CADJPY - Bearish Double TOP📉Hi Traders👋🏻
On The Daily Time Frame The CADJPY Price Reached A Resistance Level (107.400-107.812) and 61.8 fibonacci retracement level !
Currently, The Price Formed a Double Top Pattern📉
The Neckline is Broken🔥
So, I Expect a Bearish Move📉
i'm waiting for a retest...
-----------
TARGET: 104.950🎯
___________
if you agreed with this IDEA, please leave a LIKE, SUBSCRIBE or COMMENT!

Possible "M" pattern in AUDUSD in the making?AUDUSD appears to be getting ready for a Short opportunity with a good Risk:Reward ratio. Cross of 200 EMA from above will be a confirmation.
Watch out for the same.

DOUBLE TOP in play on AUDCHFOANDA:AUDCHF wanting to continue it's bearish momentum as a critical resistance at 0.8759 rejected by double top. I entered short here. If we see lows of 2020 the trade would close at 16x gain!
This post is intended for education only. It is hypothetical and by no means financial advice. Trading is risky and consultation with your financial advisor is always recommended prior to investing or trading.

Apple -> Will It Hold Support?Hello Traders and Investors ,
my name is Philip and today I will provide a free and educational multi-timeframe technical analysis of Apple 💪
Starting on the monthly timeframe you can see that after Apple broke out of the clear triangle formation in confluence with the bullish moving averages, Apple created a strong rally of 30% towards the upside, breaking major resistance.
The weekly timeframe looks a little bit overextended with barely and red candles during the last major push so we could certainly see a retest of the previous all time high at $180.
I am now just waiting to see how Apple reacts at the current level considering that we are once again retesting the bullish trendline - so far market structure is still bullish but if we see a break lower, the daily timeframe looks like a correction is inevitable.
Keep in mind: Don't get caught up in short term moves and always look at the long term picture; building wealth is a marathon and not a quick sprint 📈
Thank you for watching and I will see you tomorrow!
My previous analysis of this asset:

Apple -> Watch This Potential PatternHello Traders and Investors ,
my name is Philip and today I will provide a free and educational multi-timeframe technical analysis of Apple 💪
Starting on the monthly timeframe you can see that after Apple broke out of the clear triangle formation in confluence with the bullish moving averages, Apple created a strong rally of 30% towards the upside, breaking major resistance.
The weekly timeframe on Apple is showing some overextension towards the upside and Apple hasn't retested the 0.236 fib level yet so we could indeed see a short term pullback now.
Apple could also created a solid double top on the daily timeframe and if Apple stock also breaks below the solid uptrend line we could certainly see a short term move lower to retest the previous all-time-high at the $180 level.
Keep in mind: Don't get caught up in short term moves and always look at the long term picture; building wealth is a marathon and not a quick sprint 📈
Thank you for watching and I will see you tomorrow!
My previous analysis of this asset:

GBPCAD - Bearish Double Top📉Hi Traders👋🏻
On The Daily Time Frame The GBPCAD Price Reached A Strong Resistance Level (1.73142-1.73784) !
Currently, The Price Formed a Double Top Pattern📉
The Neckline is Broken🔥
So, I Expect a Bearish Move📉
i'm waiting for a retest...
-----------
TARGET: 1.69440🎯
___________
if you agreed with this IDEA, please leave a LIKE, SUBSCRIBE or COMMENT!

EUR-CAD Will Go Down! Sell!
Hello,Traders!
EUR-CAD has retested
A horizontal resistance
Of 1.487 then has
Established a double-top
And is going down now
So I think that the pair
Will go further down
Sell!
Like, comment and subscribe to help us grow!
Check out other forecasts below too!

AUDUSD: Double Top with Bearish Divergence on the DailyThere is some Bearish Divergence visible on the Daily as the AUD comes out of the overbought zone for the second time. I think we could eventually see it come back down to the hard support floor at 62 cents.

NZDJPY - Bearish Head and Shoulders📉Hello Traders!
On The Daily Time Frame, The NZDJPY Price Formed a Head and Shoulders Pattern📉
i'm waiting for a neckline break!
Then, we will see a huge bearish move📉
-----------
TARGET: 84.050🎯
___________
if you agreed with this IDEA, please leave a LIKE, SUBSCRIBE or COMMENT!

AUDCADAUDCAD has formed double top with strong bearish divergence. Which is potential reversal pattern. Will these confluences put the pair in sell pressure.?

🥇GOLD - The double top may start a correction Gold breaks the global bearish trend and forms momentum, but price fails to reach key zones and starts to form a reversal set-up.
TA on the high timeframe:
1) The key liquidity area that is of interest to many is in the 1970-1980 area
2) A correction is being formed and most likely the growth to liquidity will continue after it
TA on the low timeframe:
1) A double top is forming, a break of 1955 support will form an impulse to 0.236 or 0.382 fibo
2) The trend is upward, this pattern does not give hope for a trend change.
3) The decline will allow us to find more convenient support levels to buy at a favorable price.
Key support📉: 1955
Key resistance📈: 1963

EUR/USD BEARISH PRICE ACTIONI'm expecting this pair to visit the green zone marked in the chart. I'm also expecting the pair to form DT there.
there is also a possibility that the price start falling before reaching this zone( it's unlikely to happen, but expect the unexpected in financial market). So if you can add a sell position here, do it, other wise wait for a confirmation.
Please ignore the target zones I marked on the chart( not yet conformed). Just focus on the sell zone for now.
will update later.
Have a safe trade!
Fifi

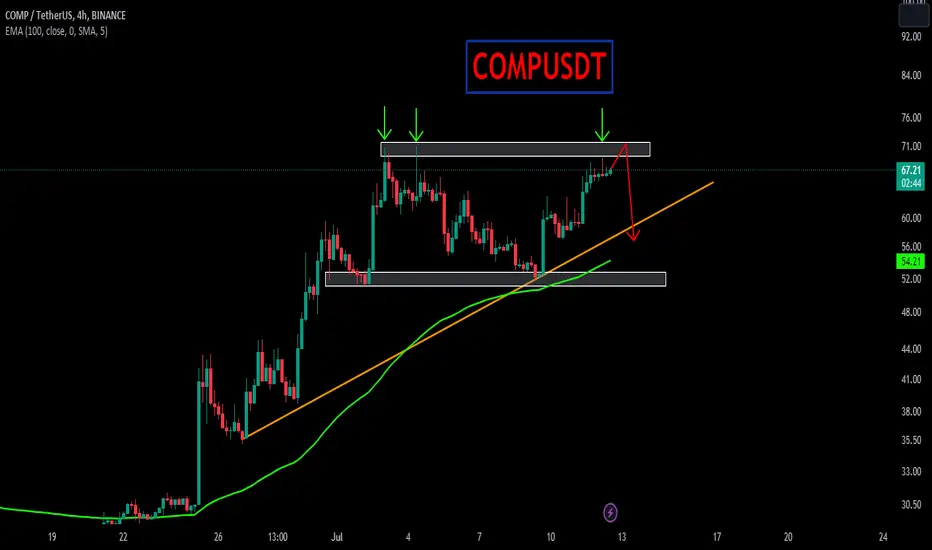
COMPUSDTCOMPUSDT has formed double top patter while bullish momentum is fading out. will the bears attack this reversal pattern and push the price to lower side.