EURJPY - Bearish GartleyA Bearish Gartley Pattern setup would still require can candlestick pattern confirmation for me.
Two ways to go about it, a 3-bar reversal on the current timeframe or a Double Top with RSI Divergence on the 1-hourly chart.
Double Top

15 min Double top!!!We can see the Confirmation of a 15 min Double top this morning when looking at Gamestop. Also the Relative Strength Index is weighing heavily on the overbought side With the moving average convergence divergence also looking to cross downward. Possible small 2 to 3 dollar dip in the next coming day or days before it starts to make another run back up leading into the last Quadruple witching for the year which will take place on Dec 17, I think we should see GME at new quarterly high about 2 weeks prior to witching and then will fade back off until next quarter in 2023.

BTC weekly falling wedge pattern breakout and retest!!Hi dear community and my faithful followers, let's pay attention to this weekly falling wedge pattern which has broken and retested with false breakdown/bear trap/ and double bottom+ RSI bullish divergence.
At the same time RSI diagonal resistance has been broken and retested as well. On the chart you explained why I think so)).
Read bellow text to understand why I think this is a false breakdown/bear trap/ with double bottom.
The bellow ideas are from my previous analysis coz the circumstances and the situation are the same.
I think the recent dump to 15.5K is a fake breakdown/bear trap/ with double bottom + RSI bullish divergence like 2021 November top, which was a false breakout/bull trap/ with double top+ RSI bear div .
So I think the real bottom was at 17.5K in June like the real top in 2021 April.
I'm considering that BTC has succeeded to break RSI diagonal trendline and now It is making a retest, I think it will hold and send BTC to 28-30K. On chart you can find my explanation why I think RSI diagonal resistance has broken.

OXY: Trend Analysis + Key Points to watch from here!• Since OXY found a top around $76 (red line), it triggered a sharp correction to its Fibonacci’s Retracements;
• There’s still a chance OXY will remain bullish, and break the previous top, however, it must react as soon as possible around the retracements;
• The key point seems to be the 61.8%, which did a very good job holding the price a few days ago (Nov 09), when the volatility increased;
• Only if OXY loses the 61.8% it’ll frustrate any possible bullish bias in the mid-term, and it would seek the next support at $62;
• In addition, the 61.8% retracement is the trigger point of a possible Double Top chart pattern;
• Therefore, let’s pay attention on how OXY will react around the retracements.
Remember to follow me to keep in touch with my analyses!

ENPH - Big play potential here! Massive Double TopEnphase Energy, leader in Solar & Green Energy Sector.
Enphase has recently seen parabolic performance skyrocketing the stock to All Time Highs.
While the stock is testing all time highs, it is still very overvalued with a P/e of 150.
The bear market has not taken its toll on Enphase yet, while it has been rising in this clear rising wedge.
What I see:
- A clear Double Top being Printed in Large Supply Zone
- Rising Wedge
- Overvalued
- Hasn’t got Bear market hit yet
Risks :
Earnings Growth
Market Meltup rally
Break above zone from possible cup & handle formation.

SHORT ON EUR/USDPrice is oversold on rsi and has created a double top..
The dollar has a falling wedge pattern at a major support level. which is a bullish reversal pattern.
I will be looking for the dollar to gain strength and push the eur/usd down.
Here is the play I will be taking...
Entry - 1.03864
SL - 1.04478 61 PIPS
TP - 1.01676 218 PIPS

GBPJPY - A rare setup GBPJPY, I'd spotted this potential trends continuation setup, a double top with RSI Divergence on the dotted line is what I'm waiting for.
Aggressive trader could wait for a 3-bar reversal on the dotted line.

GBPJPY - Bearish Head and Shoulders 📉
The GBPJPY price is in Bearish Head And Shoulders🧐
The neckline is broken & retested🔥
so, i predict a bearish move 📉
TARGET: 154.727🎯
...
if you agreed with this IDEA, please leave a LIKE, FOLLOW or COMMENT!

EURUSD-Weekly Market Analysis-Nov22,Wk3EURUSD is currently retesting the Weekly Key Resistance Level, 1.0352. I will wait for a Double Top set at that level before engaging in the trade.
That means Tuesday would be the earliest time to be involved in this trade.

$DXY seems to be topping out. Sell signal on the daily chartNot only is there a double top, but the DXY got rejected at its July 14th, 2022 high almost to the penny.
This is a sign that the dollar has topped out for now or at least run out of steam temporarily. It's possible It checks back to the uptrend line that dates back to February 10th, 2022 which by my gauge would bring it back to the 106-107 range.
The last 5 times the stochastic RSI has hit this level and had a bearish cross, 4 of them have led to quick sell-offs. I believe this will be 5/6. This has been a reliable signal lately.

USDCAD - BIG Short Pending - Trade Like BatManUSDCAD is preparing a BIG downtrend.
A bearish swing is pending, with multiple patterns displayed.
Technical Analysis & Patterns:
- Double Top (Traditional Tech.)
- Bearish Bat (Harmonics)
- Wave B Retracement (ABC)
- Bear Flag
- 61.8% Fibonacci Retracement
Many pips ahead and stay awesome Gotham!

BTC! Where is a real Bottom of BTC bear market?I'm looking at weekly timeframe of BTC chart. I'm comparing 2021 Bull market top with 2022 bear market bottom.
Call me crazy but I think a real bottom of BTC bear market was in June 2022/at 17.5K/ as BTC real top of Bull run was in April 2021/at 65K/
Nov 2022 bottom is a bear trap and fake break down like Nov 2021 top which was bull trap and fake break out.
I incline to think BTC bottom was at 17.5K on 18.06.2022 as I mentioned in my previous analyses coz I trust all my previous and current analyses , all history data, super powerful indicators which flashed BTC bottom only 3 times in BTC whole history and more than 20 powerful charts and analyses I have done since June 2022.

EURUSD Idea 11/09/2022Looking at the 4 hour time frame, I can see a nice double top.
Price already respected 1.01000 for a few 4 hour candles.
I want to see price retest 1.00350 and drop...

Xauusd setupwatch gold at 1700 level if a price respect this level chance to go with price to 1735 different scenario if broke the level of 1696 , please Beware the news of the cpi use risk management

XRPUSDTHello dear friends
Until a HH is not created for us, we do not have the mentality to continue the increasing process.
On the other hand, in the daily time frame, due to the negative divergence of the RSI, the possibility of completing a double ceiling pattern is high.
If the price range of $0.4256 is completely consumed in this corrective process, the probability of reaction to the yellow range ($0.5281) will increase.
We would be happy to hear your comments

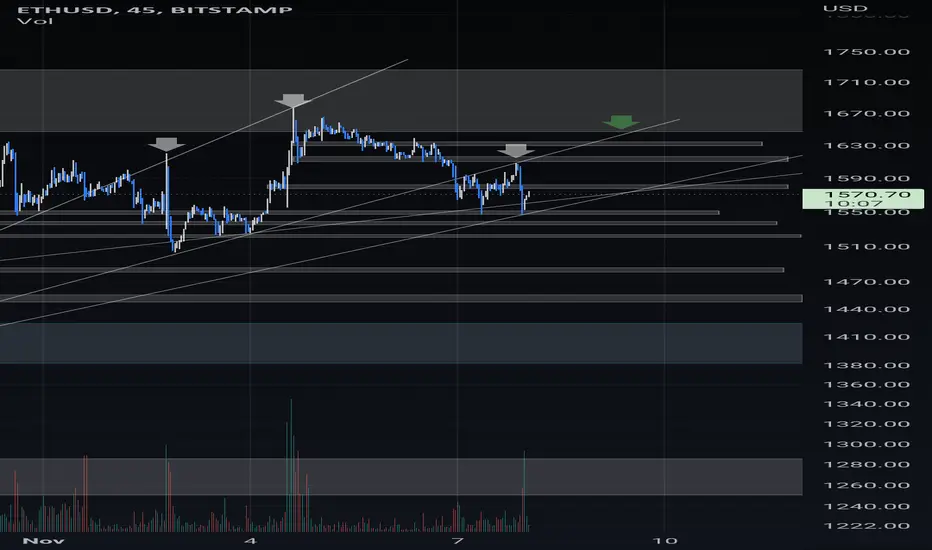
ETH H&S pattern after confirmed double bottomWe can clearly see how PA developed a double top pattern, confirming it and developing a H&S pattern with a very high second confirmation due to the ripidity of PA caused by huge amounts of buying pressure after the bear cycle breakout.
A first evident confirmation of the pattern is marked with a down arrow. At this point, I'm going to wait for a second confirmation marked in green for a better short entry.
EUR/GBP: Two scenario; possible tradeIn this analysis, Euro/Pound look bullish based my perspective what I see this market trap. And also, we can to ask if this it's a sell imminent, but not yet, this it's a market trap and also I will share some points here why Euro will go bullish in front of Pound.
Fundamental Analysis:
1) Euro and Pound rose against the safe haven Dollar on Monday, supported by a risk on sentiment across markets as investors digested positive eurozone data and looked to cash n on the strength of the U.S. Dollar
2) A survey showed on Monday that investors morale in the euro zone improved in November, and reflecting hopes that recent warmer temperatures and falling energy prices will prevent gas rationing on the continent this winter.
3) Germany should hike taxes on rich to finance relief packages.
4) Euro Zone investors morale up for first time since August 2022
Fundamentally, based this correlation with Euro and Sterling Pound, we see that investors seem to be some optimistic with eurozone data in the past week that ECB President Lagarde spoke. And also, Germany's economic advisory council will recommend the government raise taxes on the wealthy to help finance the multi-billion euro relief packages it has agreed to fight the energy crisis, What I think it's that German government may to raise taxes on rich to finance a multi-billion program to fight the energy crisis that whole Europe has since began of this year.
Technically, it's bullish for Euro. Now talking about technical analysis, we could to form a possible Shoulder Head Shoulder or Double Top?.
We see in this screenshot two possible scenario that I mentioned above, and EMA 200 make support exactly where the price make reaction. What in case if we get a Shoulder Head Shoulder (to be complete), we would need to valid this reaction point from $0.8738 GBP, if in case that fall and broke up, we can to watching a Double Top after of this validation to be complete. What it's very important to read the price action always.
Meanwhile, in Daily timeframe we see this perspective that Euro want to make a supply zone into this range, if we see, still bearish in this bearish channel, but it's not matter to keep watching what happen.
Good luck in this long position!!!

AirBnB in short positionWhat we can see in the chart is a double top formation.
The price broke already below the neckline, however the target has not been reached yet.
The price bounced back up and is getting rejected from the previous support.
Therefore we are expecting the price to continue the downtrend and reach the target from the double top formation.

EUR / USD Pre-NFPRisky trade before NFP but so many confluences, everything is lined up perfectly. Let's see how it plays out!

BNBUSD: Under a KEY RESISTANCE! What's next?• BNB is very bullish, but it has to face its most challenging resistance now, around $337;
• The $337 is a triple-resistance area, as seen in the daily chart, and only if BNB breaks it, we’ll see a bullish run to the next resistance at $413;
• However, if BNB fails in breaking this resistance, and triggers the Double Top chart pattern seen I the 1h chart by losing the purple trend line, a pullback is plausible;
• The next support level is at $299 (red line), near the 21 ema in the daily chart – making it a dual-support level;
• So far, the situation is under control, and the volume is quite high. Let’s pay attention to these key points.
Remember to follow me to keep in touch with my analyses!

2B Trading PatternIn an uptrend, if a higher high is made but fails to carry through, and then prices drop below the previous high, then the trend is apt to reverse. The converse is true for down trends. This observation applies in any of the three trends; short-term, intermediate-term, or long-term.
A 2B on a minor high or low will usually occur within one day or less of the time the high or low is made. For 2B's on intermediate highs or lows preceding a correction, the new high or low point will usually break within three to five days. At major market turning points, long-term 2B's, the new high or low will usually break within seven to ten days. In the stock market, after the new high is made, the failure to carry forward usually occurs on low to normal volume, and the confirmation of a reversal occurs on higher volume.
The above can be found on the internet, just look up 2B chart pattern.
I would usually recommend your default as being, sell low, buy lower. & buy high, sell higher.
My next trading mantra would be that double bottoms are not Support, and double tops are not Resistance. They are where the stops are. And therefore a major target.
But every now and then the market does turn. After a period of impulsive moves, the market comes to rest and goes into a consolidation. It may make one last attempt at continuing the prevailing trend, only to find there are fewer market participants willing to push it on. This is when you look for 2B's

Sell Halfway through Halfway through,now you can protect your trades ,and squeeze the StopLoss to entry point

GBPUSD forecast for this weekThe British pound edged above $1.12 recouping some losses from the previous session The Bank of England’s emergency bond-buying scheme, which was used to cover pension funds caught up in the market chaos sparked by the tax cuts announced last month, I think by Wed or Thursdays we will see price starting to fallin we are monitoring GBPUSD for a selling opportunity around 1.14500 and 1.16500 zone, once we will receive any bearish confirmation the trade will be executed!
free to ask any question in comments
