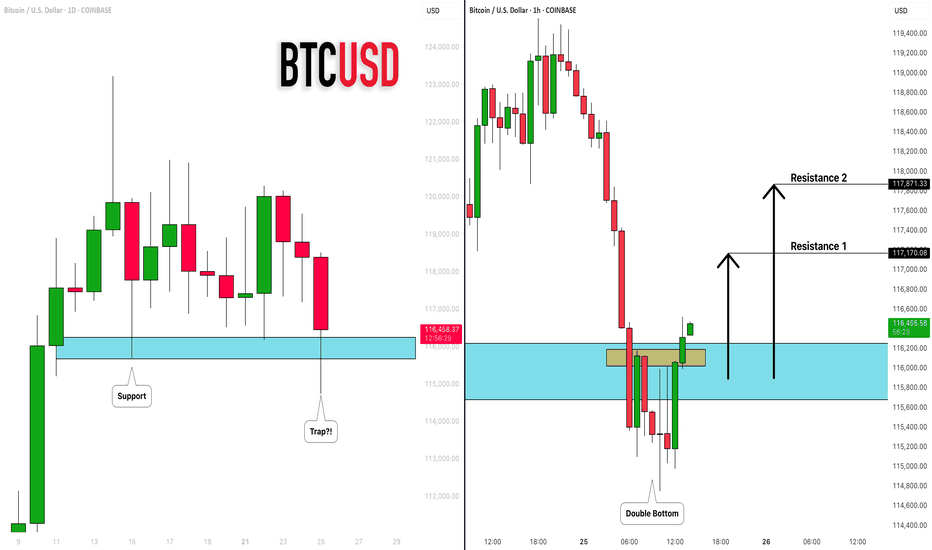
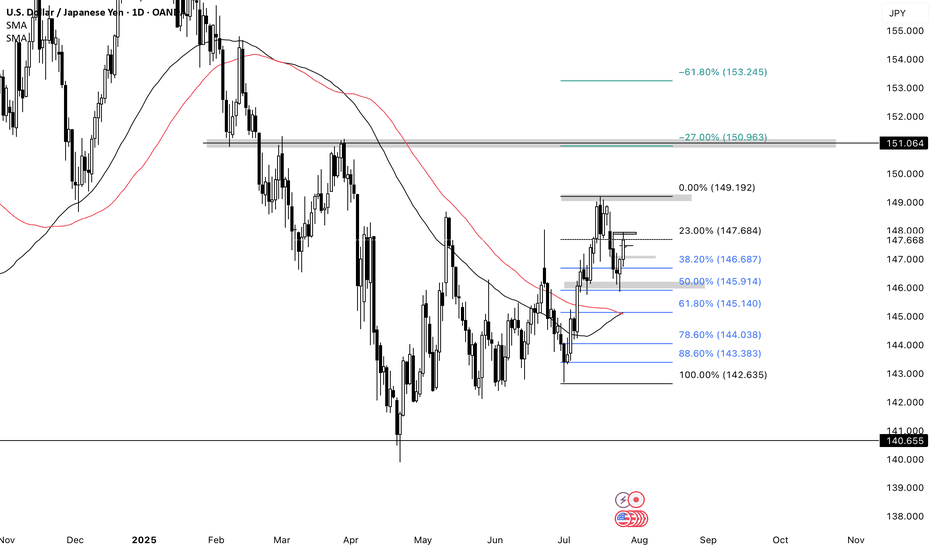
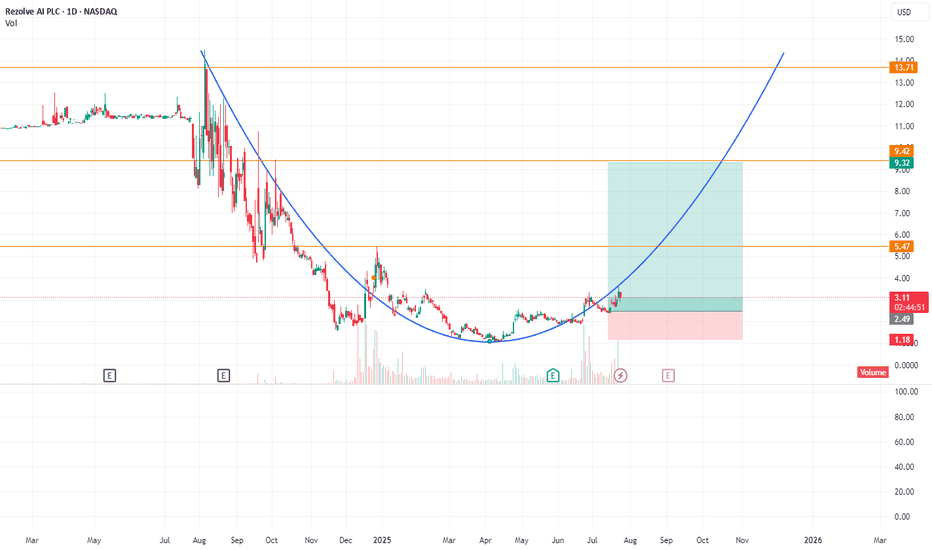
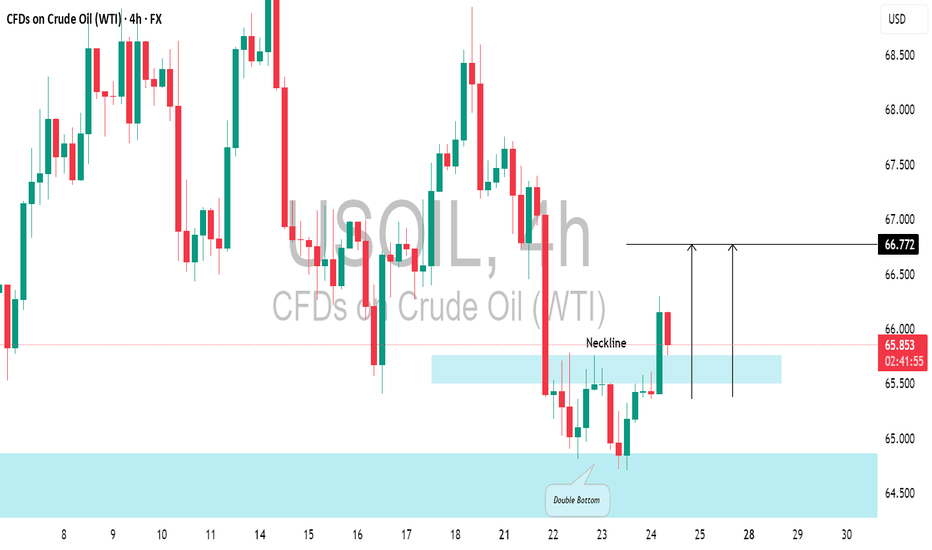
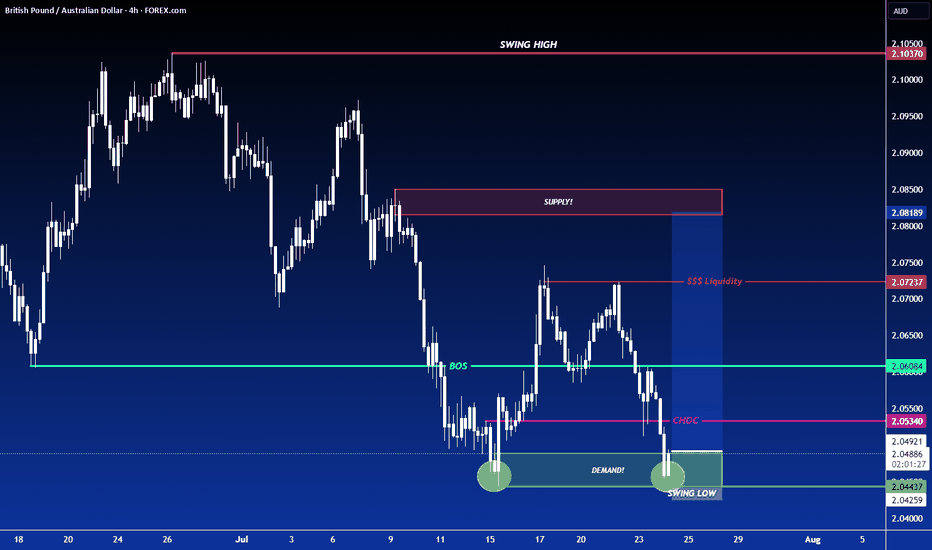
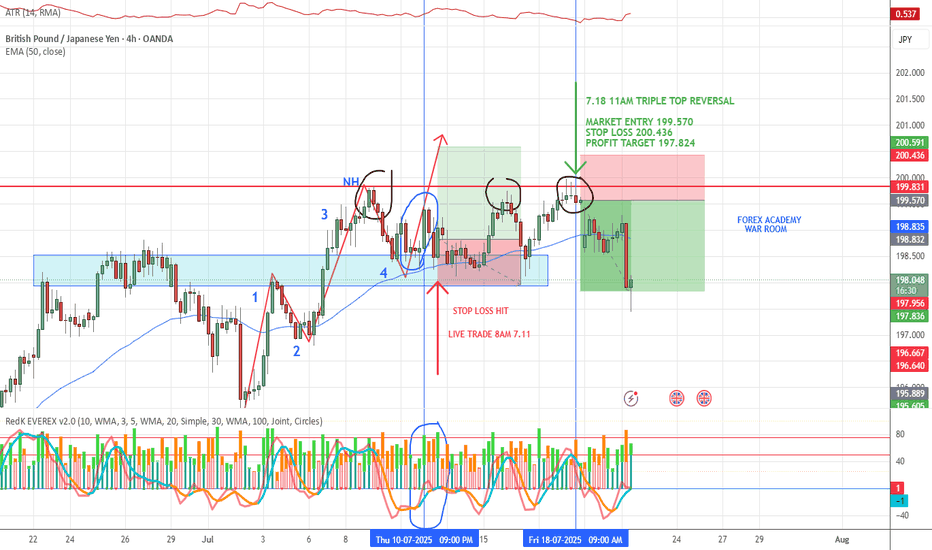
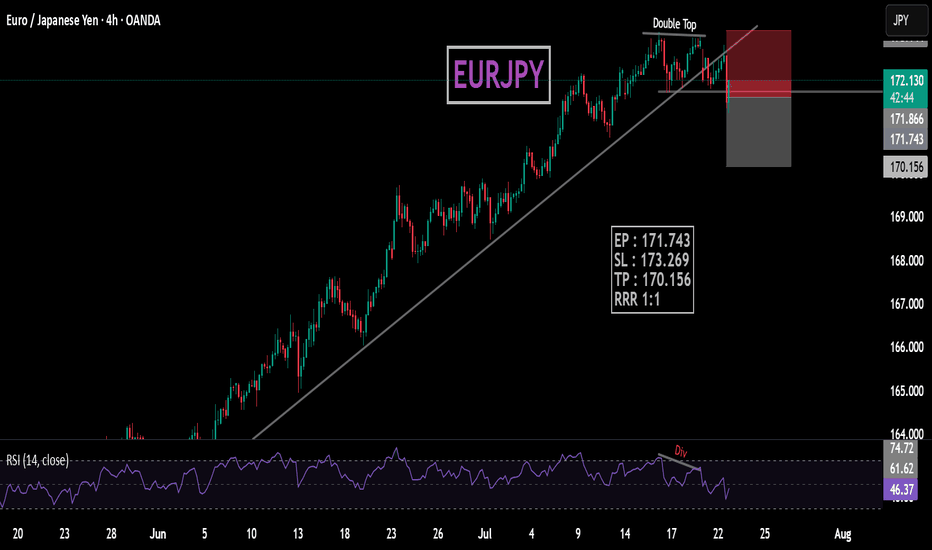
Double Top or Bottom
ANOTHER BULL RUN FOR BITCOINAs of April 12, 2025, Bitcoin (BTC) is trading at approximately $84,892, reflecting a 1.5% increase as it attempts to break a three-month downtrend.
Several factors have contributed to Bitcoin's recent price surge:
1. U.S. Tariff Exemptions: The Trump administration's decision to exempt key tech products from reciprocal tariffs has alleviated trade tensions, boosting investor confidence in risk assets like Bitcoin.
2. Strategic Bitcoin Reserve: The U.S. government's establishment of a Strategic Bitcoin Reserve signals institutional support for digital assets, enhancing market sentiment.
3. Market Dynamics: A significant amount of Bitcoin has been withdrawn from exchanges, indicating strong holding sentiment among investors. Additionally, a short squeeze has contributed to upward price momentum.
Finance Magnates
4. Global Adoption: Institutions like Lomond School in Scotland accepting Bitcoin for tuition fees reflect growing mainstream acceptance of cryptocurrency.
Latest news & breaking headlines
This could be the bull run we've all been waiting for.
LTC/USDT:BUYHello friends
Due to the good price growth, we see that the price has hit a lower ceiling and has fallen, which we can buy in stages during the price decline, within the specified ranges and move with it to the specified targets.
Observe capital and risk management.
*Trade safely with us*
Bitcoin (BTC/USD) – Double Bottom Reversal with Rising Wedge📈 Bitcoin (BTC/USD) – Double Bottom Reversal with Rising Wedge Breakout | Bullish Continuation Setup
“Buy when there's confirmation, hold with structure, and exit with purpose.”
🧠 Market Sentiment & Context
Bitcoin has recently undergone a significant corrective phase, followed by consolidation and now showing early signs of bullish reversal. The 3-hour timeframe displays key price action elements that suggest market strength is building, and buyers are regaining control. Let’s explore the technical story unfolding:
📊 Technical Breakdown
🔵 1. Double Bottom Reversal Pattern
Structure:
This textbook double bottom pattern is formed after a clear downtrend, with Bottom 1 and Bottom 2 printed at nearly equal price levels (~$78,800), indicating strong demand at that support.
Support Zone:
A clear horizontal support level was tested twice, showing rejection wicks and bullish follow-through. This is a strong signal of buyer presence and price defense.
Neckline Break:
The neckline at $83,500–$84,000, which previously acted as resistance, has now been broken, confirming a bullish reversal pattern.
Psychology:
The double bottom reflects a shift from distribution to accumulation. Traders who previously shorted are being stopped out, while fresh long entries drive upward momentum.
🔺 2. Rising Wedge (Continuation within Trend)
Formation:
After the neckline break, BTC/USD consolidated in a rising wedge, a normally bearish structure, but here it acted as a continuation pattern.
Breakout & Retest:
Price broke out above the wedge, indicating strong bullish pressure. It's now pulling back to retest the wedge breakout zone, which offers a prime entry zone for trend traders.
Volume Implication (if measured):
Typically, a breakout accompanied by increased volume adds conviction to the move. While this chart doesn't show volume, the price structure strongly supports the momentum thesis.
📏 3. Strategic Trade Plan
✅ Long Setup
Entry Zone:
Around the current price pullback ($83,500 – $84,000), watching for bullish price action confirmation (e.g., bullish engulfing candle, pin bar, or inside bar breakout).
Take Profit (TP):
🎯 Target at $87,768 – $87,800
This level represents the measured move projection from the double bottom structure and the previous major resistance zone.
Stop Loss (SL):
🚫 Placed at $79,441, which is just beneath the structural support of the second bottom. A break below this zone would invalidate the bullish thesis.
Risk-to-Reward Ratio:
Approximately 3.5 to 1—a favorable setup for swing traders and intra-week positions.
🧭 4. Key Zones Summary
Zone Level Range Purpose
Support $78,500 – $79,000 Double Bottom Base
Entry Zone $83,000 – $84,000 Wedge Retest / Bullish Break
Target $87,768 – $87,800 Measured Move / Resistance
Stop Loss $79,441 Pattern Invalidation
📌 Confluence Factors Supporting the Bullish Setup
✅ Double bottom reversal at major support
✅ Neckline breakout followed by rising wedge
✅ Retest of wedge offers low-risk entry
✅ Clean invalidation level below structure
✅ Upside potential aligns with previous highs
⚠️ Risk Notes
As always, risk management is key. Use proper position sizing, set alerts near key zones, and do not trade without confirmation. Bitcoin is volatile, and liquidity traps are common.
📢 Conclusion
This BTC/USD setup presents a high-probability long opportunity based on classical technical analysis principles. The combination of a reversal pattern, bullish continuation breakout, and measured move projection makes this an ideal candidate for a structured trade.
Bias: 🔵 Bullish (above $83,000)
Invalidation: 🔴 Break and close below $79,400
Trend Structure: Reversal and continuation aligned
Trade Type: Swing / Short-term Position
gold and inflation in 1970s stagflation fomc member repeatedly saying this is not stagflation like 1970s
but gold bug on social media constantly pump stagflation narrative after gold historic run from $2000 to $3000 in just one year
with usa cpi and gold chart in one image you can get idea
how gold moved in last stagflation crisis with big political news : when paul volcker comes into fed and when Ronald Reagan wins election
gold first makes double top before multi year bear market
inflation peaked after volcker get fed control but before election result.
is this is really replay of 1970s ?
we got same old president trump and same old fed chair powell
✅ biden forced fed to do big size 50bps cut pre election to choose inflation over higher unemployment which is stagflation
✅ in his first term trump in election year March 2020 use covid as excuse to cut 0% and do QE and trillion dollar fiscal policy stimulus check. choosing inflation over high employment which is stagflation but it was biden who has to face most of the inflation spike to 9%
✅trump raise tariff to 100 years high to choose high employment over inflation which is recession
✅ in next 4 years it will be clear is this replay of 70s or not.
in future we will have more inflation and gold price data to confirm
Bitcoin (BTC/USD) – Double Bottom Breakout in PlayBitcoin has printed a textbook double bottom pattern signaling a potential trend reversal after a sharp decline The market has now broken above the neckline and we may be witnessing the early stages of a bullish continuation
Technical Breakdown:
Pattern Identified:
A clear double bottom has formed with Bottom 1 and Bottom 2 marked around the $73,500–$74,000 zone, indicating strong buyer interest and a possible exhaustion of the prior downtrend
Neckline Breakout:
Price broke above the neckline (~$81,200) triggering bullish momentum and confirming the pattern The breakout was supported by high volume and aggressive follow-through
Consolidation & Retest:
After the breakout, BTC is currently retesting the previous neckline area, which now acts as a support zone. If this zone holds, it could provide a solid base for the next upward leg.
Projected Move:
A successful retest of the neckline could push BTC towards the next key resistance at $84,000–$85,000
If bullish momentum remains strong, a further move to the $87,000 resistance zone is on the table
Resistance: $82,400 – $84,600 - GETTEX:87K
Support Zone: $81,200 – $82,300 (neckline area)
Conclusion:
This double bottom pattern on Bitcoin is a strong bullish reversal signal As long as price holds above the neckline support bulls remain in control Traders should monitor the pullback and watch for bullish confirmation before entering new long positions
Trade with confirmation and always manage risk!
Gold: It may Fall below 3180 todayOver the weekend, Trump announced a pause on tariffs for popular consumer electronics, prompting gold to gap down to 3210 at today’s open;
✅ Our recommended short entries at 3230–3260 are already in profit;
New semiconductor tariff announcements are due during the U.S. session today — the key driver for gold’s next move;
Given the fragile U.S. political/economic backdrop, escalating tariff conflict is unlikely, increasing the chance of bearish impact on gold;
With gold already trading at a premium, any "tariff relief" narrative will likely trigger speculative sell-offs;
If you're holding short positions, consider being patient — avoid premature exits due to emotional reaction to minor pullbacks.
Maintain key short entry zone: 3230 – 3260;
Expect gold to test below 3180 if market sentiment shifts
EURJPY 3H Analysis – Double Top + Rising Wedge Breakdown Setup📊 EURJPY 3H Analysis – Double Top + Rising Wedge Breakdown Setup
Potential Reversal After Strong Bullish Run
🧭 1. Market Context & Structure Overview
Over the past few weeks, EURJPY has been in a strong bullish trend, pushing higher through multiple swing highs. However, recent price action is showing early signs of exhaustion as momentum fades near a historically significant resistance zone at 164.13. This zone has now been tested twice, creating a Double Top formation, often signaling a potential trend reversal.
Following the second top, the price formed a Rising Wedge pattern, a bearish structure that frequently indicates an impending breakdown, especially when it forms after an uptrend and near major resistance. The confluence of these two patterns — Double Top and Rising Wedge — strengthens the bearish case for a short trade.
📐 2. Technical Pattern Breakdown
🔸 Double Top Formation
Top 1: Occurred at ~164.13, where price was sharply rejected after an extended rally.
Top 2: A slightly lower high or equal high at the same level, confirming sellers are actively defending this resistance.
Neckline: Drawn around the 160.50 level, where a confirmed break would trigger the full Double Top effect.
A break below this neckline typically signals the beginning of a medium-term bearish move.
🔸 Rising Wedge Pattern
Price compressed between higher highs and higher lows, forming a narrowing ascending channel.
The wedge is rising against resistance, indicating bulls are losing control.
A break below the wedge support line is considered a bearish signal — especially strong when following a double top.
These patterns create a bearish convergence, signaling a high-probability short opportunity.
🔍 3. Key Price Levels
Level Price Role & Significance
Resistance 164.13 Strong multi-touch resistance. Rejected twice.
Support 160.50–160.00 Double Top neckline. First key bearish target.
Stop Loss (SL) 164.13 Placed above pattern invalidation zone.
Take Profit (TP) 158.41 Measured move target from wedge & past support.
📉 4. Bearish Trade Setup Summary
Entry: After confirmed candle close below the wedge support line (or break of support zone).
SL: Above 164.13 resistance (to avoid premature stop-out from fakeouts).
TP: 158.41, based on past demand zone and wedge projection.
Risk-Reward Ratio: Targeting a 1:2.5 to 1:3 RRR — optimal for swing setups.
🔁 5. Trade Management & Strategy Tips
Wait for Confirmation: Don’t jump the gun. Look for volume pickup or bearish engulfing candle at the break.
Scale In or Out: Consider partial entries or scaling out at key mid-support (e.g., around 160.00).
Trail Stops: Once price breaks below the wedge and approaches 160.50, adjust SL to breakeven to lock in risk-free profit.
News Awareness: Be aware of any JPY or EUR-related macro events, as they can cause spikes and whipsaws.
🔎 6. Psychological Perspective
This setup capitalizes on trader emotions:
Bulls are trapped near the highs after failing to break resistance twice.
Late buyers entering on the wedge may be forced to sell on breakdowns, accelerating the bearish move.
Market may experience a liquidity grab above the resistance before collapsing — be patient with entries.
🧠 7. Multi-Timeframe Confluence
On Higher Timeframes (Daily/Weekly): Resistance around 164.00 is historically significant — aligns with prior reversal zones.
On Lower Timeframes (1H/30M): Bearish divergence or momentum weakening may confirm the setup.
Check RSI/MACD for divergence signals as added confluence.
🎯 8. Target Projections
Measured Move of Double Top: The vertical distance from resistance to neckline (~300 pips) projected downward from the neckline gives us a rough target near 158.40, which is confirmed on the chart.
This zone previously acted as demand, where buyers stepped in. A good area to lock profit or expect bounce/consolidation.
✅ Conclusion: Trade Plan Summary
EURJPY is displaying a clear bearish setup on the 3H timeframe, with a Double Top rejection at resistance and a Rising Wedge signaling price compression. A break below support confirms the setup and opens room for a move down to 158.41. This is a textbook swing setup combining price action, pattern recognition, and multi-timeframe analysis.
EUR/JPY Weekly Chart Analysis – Double Bottom + Head & Shoulders📊 EUR/JPY Weekly Chart Analysis – Double Bottom + Head & Shoulders Breakdown
🔹 Overview
The EUR/JPY pair is exhibiting signs of a major trend reversal after a long-standing bullish rally. The chart shows a confluence of powerful reversal signals, including:
A Rising Channel Breakout
A Head and Shoulders pattern
A Double Bottom formation within the right shoulder
Clear support and resistance zones
Defined SL (Stop Loss) and TP (Take Profit) levels based on structure
This setup indicates a strong medium-to-long-term bearish opportunity with favorable risk-reward potential.
🔍 Technical Chart Pattern Breakdown
🔸 1. Rising Channel (2023 – Mid 2024)
From early 2023 to mid-2024, EUR/JPY was in a clear upward trend, marked by higher highs and higher lows within a rising parallel channel.
This channel provided structured bullish moves until the price broke below the lower trendline, signaling early signs of bullish exhaustion.
This breakout occurred just after the formation of the Head, which marked a significant top.
🔸 2. Head and Shoulders Formation
This is a classic trend-reversal pattern, and it's unfolding with precision on the weekly timeframe:
Left Shoulder (Q3 2023): Formed near the upper channel line with a high around the 162.00 region.
Head (Q2 2024): Price reached a new peak at ~176.00 before sharply rejecting and reversing, creating the highest point in this formation.
Right Shoulder (Q4 2024 – Q1 2025): A lower high formed as the market attempted another rally but failed to break above the head or channel, showing weak bullish momentum.
💡 Confirmation Trigger: The neckline (around 156.00–157.00 zone) acts as the key trigger level. Price has broken below this zone and now shows signs of a retest — a classic sell signal in H&S structure.
🔸 3. Double Bottom Formation
This pattern formed between Bottom 1 (Q3 2024) and Bottom 2 (Q1 2025).
Although double bottoms are typically bullish reversal signals, this one formed inside the right shoulder of the H&S pattern — acting more like a temporary support retest than a genuine reversal.
The lack of follow-through beyond the neckline further invalidates its bullish strength, turning it into a potential bull trap.
🔐 Key Price Zones
Zone Label Meaning
174.052 SL (Stop Loss) Above right shoulder; invalidates bearish bias if broken
163.014 Current Market Price Trading sideways, post-neckline retest
148.075 Intermediate Support Potential short-term bounce zone
147.969 TP (Take Profit) Full projected move from neckline (based on H&S measurement)
⚙️ Trade Setup Strategy
This setup is ideal for swing and position traders looking to capture medium- to long-term downside movement.
Trade Direction: Short (Sell)
Entry Zone: 162.00–163.00 or on break/retest of 158.00
Stop Loss: 174.052 (Above head/right shoulder structure)
Target Profit: 147.969
Risk-Reward Ratio: 1:2.5 to 1:3 depending on entry
🧠 Note: Always wait for confirmation candles (e.g., bearish engulfing, pin bar, or bearish continuation) on the weekly or daily timeframe to confirm entry.
🔄 Outlook & Commentary
This chart presents a high-probability trend reversal setup. While many traders may still view the double bottom as bullish, the failure to break above the neckline and the formation of a lower high suggest the bears are gaining control.
Also, macroeconomic sentiment (such as any risk-off JPY strength or euro weakness) could further support this bearish bias. Technically, this setup aligns with textbook patterns and measured-move logic.
There is a good probability on the bullish side.There is a strong support zone holding on the weekly timeframe, and it's exactly from this level that a reversal signal has appeared on the four-hour chart, along with a structure shift and a candle close. Moreover, the RSI indicates a bullish divergence. Now, it's just the weekly trendline that needs to be broken—once that happens, nothing can stop ETH from turning bullish.
Risks gradually accumulate, and short gold in batchesAt present, the highest price of gold has reached around 3244, but it soon fell back to below 3240; and the PPI data is obviously bullish for gold, but gold has not shown a significant upward fluctuation, indicating that as gold rises sharply, market sentiment tends to be more cautious, so that liquidity is insufficient. So from this point of view, gold still has a need for a correction!
In the past three trading days, the increase in gold has reached $270. So even if gold remains strong at present, we should not blindly chase more gold. On the contrary, we can still gradually establish short positions in batches. As long as we strictly control the number of transactions in the transaction, we don’t have to worry too much about the transaction risk!
Let us wait patiently for the market to gradually accumulate risk sentiment. Once it accumulates to the critical point, it only takes one opportunity for gold to collapse soon.
Volume fades, double top forms – is Bitcoin headed to 70k?CRYPTOCAP:BTC is showing signs of exhaustion near the $83,500–$84,000 zone, with repeated rejections indicating weakening bullish momentum. Volume is steadily declining, which typically signals a lack of conviction from buyers.
We may be witnessing the formation of a potential double top – a bearish reversal pattern. If confirmed, this could trigger a correction toward $78K, $74K, or even the $70K–$68K zone.
Key Levels to Watch:
Resistance: $83,500–$84,000
Support: $78,000 → $74,000 → $70,000 → $68,000
This corrective move could be healthy for the market, potentially flushing out weak hands and injecting fresh liquidity for a stronger upward rally in the coming weeks.
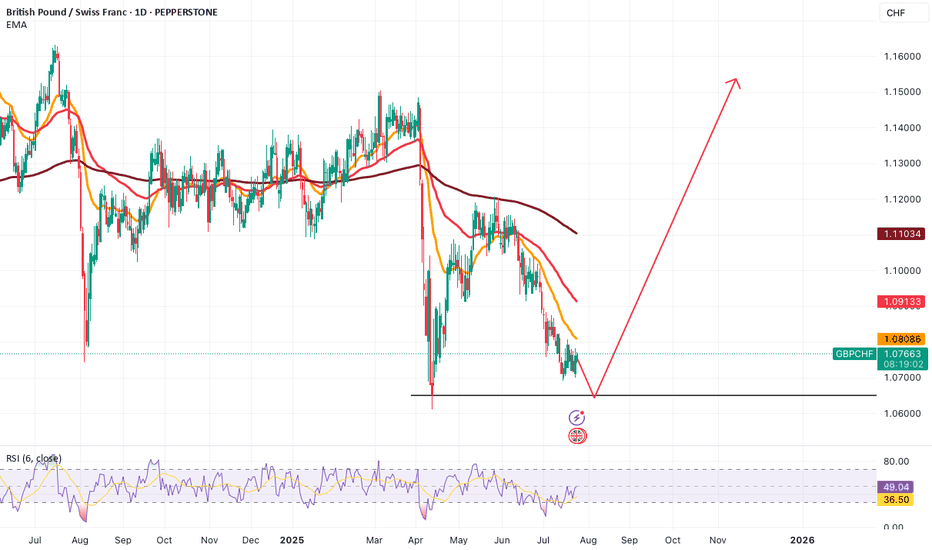
LONG ON GBP/CHFGBP/CHF Has a Perfect Double bottom pattern at a major demand area.
Price has broken the neckline of the double top and is currently pulling back to sweep liquidity and balance out price at any FVG's (Fair Value Gaps)
Liquidity sits behind the 2 wicks on the double bottom, so price may sweep that BEFORE rising.
Must give you stop loss space behind the wicks to survive the trade.
I have a buy limit order setup to take advantage of the pullback which will place me in the trade at discount price.
From there im looking to catch 300 pips to the previous swing high.
XRP/USDT I Reverse Short Squeeze Alert! Resistance at 2 USDTHey Traders after the success of my Previous trade this month on NASDAQ:HOOD hitting Target 1 & 2 in 2 days more than 16%+
With a Similar Trade setup But Crypto I bring you today
BINANCE:XRPUSDT
Short opportunity
- Market structure
- Head and shoulder pattern
- Currently will be trading at supply zone which was a recent support and now an ideal place for a reversal which is taking place as we speak- 4 Hour TF.
- Breakdown and retest
- Risk Aversion Dynamics in Cryptocurrency Markets
PROTIP/-
Entry on Bearish candle stick pattern on Current Levels
Stop Loss : 2.2292
Target 1 : 1.4707
Target 2 : 1.0507
Technical View
The orange circle marks a double top within the supply zone, acting as the shoulders of a larger head and shoulders pattern, suggesting strong resistance.
Bearish Trendline
breakdown + Retest
Risk Aversion Dynamics in Cryptocurrency Markets
Fundamental View - How Current Affairs can effect this pair!
The proposed imposition of significant tariffs, such as the 60% levy on Chinese imports suggested by former U.S. President Donald Trump, could trigger a chain reaction across global markets. This scenario would likely amplify risk aversion among investors, potentially catalyzing a sell-off in risk-sensitive assets like XRP (Ripple) in favor of perceived safe havens such as the U.S. dollar (and by extension, Tether/USDT). Below, we analyze the mechanics of this relationship and its implications for the XRP/USDT trading pair.
1. Tariff Escalation and Its Macroeconomic Consequences
1.1 Direct Impact on China’s Economy
A 60% tariff on Chinese exports to the U.S. would directly reduce China’s export competitiveness, potentially lowering its GDP growth by 1.5–2.5 percentage points annually, according to UBS economists. This slowdown would exacerbate existing vulnerabilities in China’s economy, including a property market crisis, weak domestic demand, and deflationary pressures (June 2024 CPI: 0.2% YoY). Reduced economic activity in China—the world’s second-largest economy—could dampen global trade volumes and commodity prices, indirectly affecting risk sentiment in financial markets.
1.2 Global Spillover Effects
The UBS analysis highlights that retaliatory measures by China or other nations could amplify trade fragmentation, further destabilizing supply chains and corporate earnings. For example, the April 2025 announcement of 25% U.S. tariffs on automotive imports triggered a 2.9% drop in the S&P 500 and a 5–7% decline in major Asian equity indices. Such volatility often precedes broader risk aversion, as investors reassess exposure to growth-dependent assets.
2. Risk Aversion Dynamics in Cryptocurrency Markets
2.1 Flight to Safety and USD Appreciation
During periods of economic uncertainty, capital typically flows into safe-haven assets like U.S. Treasuries and the dollar. Tether (USDT), a stable coin pegged 1:1 to the USD, often benefits from this dynamic as crypto traders seek stability. For instance, Bitcoin’s role as a “weak safe haven” for the USD in acute crises suggests that stable coins like USDT could see increased demand during tariff-induced turmoil, while altcoins like XRP face selling pressure.
2.2 XRP’s Sensitivity to Risk Sentiment
XRP, unlike Bitcoin, lacks established safe-haven credentials. Its price action in Q2 2025 exemplifies this vulnerability: a 7.5% decline over 30 days (peaking at 2.57 USDT on March 19 and bottoming at 1.64 USDT on April 7). This volatility aligns with broader patterns where altcoins underperform during risk-off periods. A global slowdown would likely intensify this trend, as retail and institutional investors reduce exposure to speculative crypto assets.
3. Mechanism: From Tariffs to XRP/USDT Price Decline
3.1 Investor Behavior in Risk-Off Environments
Tariff Announcements → Equity Market Sell-Off: The April 2025 auto tariffs caused a 6–7% drop in Asian equities, signaling growing risk aversion.
Liquidity Reallocation: Investors exit equities and crypto (including XRP) to hold cash or cash equivalents like USDT.
USD/USDT Demand Surge: Increased demand for USD lifts USDT’s relative value, pressuring XRP/USDT downward.
3.2 Technical and Fundamental Pressure on XRP
Supply-Demand Imbalance: As sellers dominate XRP markets, the token’s price in USDT terms declines. The 14.56% 90-day volatility in XRP/USDT suggests heightened sensitivity to macroeconomic shocks.
Liquidity Crunch: A broader crypto market downturn could reduce trading volumes, exacerbating price swings.
4. Historical Precedents and Limitations
4.1 Bitcoin’s Mixed Performance as a Hedge
While Bitcoin has shown limited safe-haven properties for the USD in short-term crises, its decoupling from altcoins like XRP during stress periods is well-documented. For example, Bitcoin’s 40% rebound post-COVID crash contrasted with XRP’s prolonged slump in 2020–2021.
4.2 Mitigating Factors
Stimulus Measures: If China implements aggressive fiscal stimulus, as UBS posits, a partial recovery in risk appetite could cushion XRP’s decline.
Crypto-Specific Catalysts: Regulatory clarity or Ripple-related developments (e.g., SEC case resolutions) could counteract macro-driven selling.
5. Conclusion: Bearish Outlook for XRP/USDT in Tariff Scenario
In a tariff-driven slowdown, the XRP/USDT pair faces downward pressure due to:
Risk Aversion: Capital rotation from crypto to stable coins.
USD Strength: USDT demand surges as a proxy for dollar safety.
Altcoin Underperformance: Historical precedent of XRP lagging during macro stress.
People interested should monitor China’s policy response and U.S. tariff implementation timelines, as these factors will determine the severity of XRP/USDT’s downside. A breach below the April 7 low of 1.64 USDT could signal prolonged bearish momentum.
This analysis synthesizes macroeconomic triggers, market psychology, and cryptocurrency-specific dynamics to outline a plausible pathway for XRP/USDT depreciation amid escalating trade tensions.
Not An Investment Advise
''Altseason 2025''Welcome back dearest reader,
I will probably get alot of backlash from bitcoin maxi's for writing this post, i have read and heard it all by now. I'm not disregarding their opinion on bitcoin and i think it will do well, but not as well as some altcoins which i have monitored.
First the technical part:
~Bitcoin has seemingly formed a double top pattern with now on the weekly a gravestone doji (confirming this sunday). Looking at previous action from 2019 and 2020, these have been topping indicators and indicate a bearish reversal which in turn will be bullish for altcoins.
~ MFI --> massively overbought.
~ Stoch RSI --> nearly at 100! Screaming for a reversal.
Over the past months everyone seemed to think ''this is the top, only to see dominance rise further and alts bleeding''. It is possible that BTC.D doesn't correct immediately, but i do suspect an altseason to be really close.
Sentiment: When everyone... i mean EVERYONE is bearish. ''Alts to zero'', ''bitcoin is the only good coin'', ''Ethereum is dead''. This has historically been the perfect time to buy. And that time is now.
''But, there are over 13 million altcoins now!''
Yes this is true, i don't think all of them are going to do well, stick to the ones available on big exchanges. Those have 400 different ones on average. From those i have covered some allready which i think are going to do well, it's worth your time to look at those ideas.
Any questions?
Ask.
~Rustle
EurUsdThe EUR/USD market initially tested a significant daily resistance zone, which prompted an expected bearish continuation. Following this, the market formed a clear M-pattern, indicating a potential reversal. As the price retested the neckline of the M-pattern, this confirmed the continuation of the bearish trend. Consequently, further selling pressure was anticipated, aligning with the established market structure and technical signals.
GBPAUD Retests Double Top NecklineGBPAUD has broken the key support level of a double top pattern. The price is now caught between two important zones: the neckline of the double top, which is now acting as resistance, and the former resistance zone at 2.0725–2.0775, which has turned into support.
If this support fails, GBPAUD may continue toward the double top’s projected target near 2.04. However, if the neckline is reclaimed, the bearish setup would be invalidated.
BTC/USD Bullish Reversal – Double Bottom Breakout & Target🧱 2. Chart Pattern: Double Bottom Formation
📌 Description:
A Double Bottom Pattern is a classic trend reversal formation that occurs at the end of a downtrend. It signifies a strong support level and the potential for price to reverse to the upside.
🔽 Key Features Identified:
Two distinct lows (highlighted with orange circles) at nearly the same price level within the Support Zone.
The area between the two lows forms the neckline, which is the resistance that must break for the pattern to confirm.
📊 Interpretation:
Price found significant demand near the 74,000 zone, tested twice.
The neckline, acting as resistance, was broken with strong bullish momentum, confirming the double bottom.
🖼️ 3. Downtrend Channel & Breakout
⛓️ Downward Channel:
Before the reversal, BTC was moving within a falling parallel channel, shown with diagonal trendlines.
Price was respecting the channel boundaries, forming lower highs and lower lows.
💥 Breakout:
The breakout from this channel aligned with the breakout from the double bottom’s neckline.
This is a high-confluence zone — a powerful bullish signal.
🎯 4. Retest and Trade Setup
🔁 Retesting Phase:
After the breakout, the price pulled back toward the broken neckline, a common occurrence in technical setups.
This retest of previous resistance as support adds confirmation and provides a low-risk entry for buyers.
🟢 Entry Zone:
Ideally, entries are placed just above the neckline during the retest, anticipating continuation of the bullish move.
💰 5. Risk Management Setup
🛑 Stop Loss Level:
Positioned at 76,802 — just below the previous support zone and the recent swing low.
This placement allows room for normal market fluctuations while protecting against breakdown risk.
🎯 Target (Take Profit):
Marked at 87,950, aligning with a measured move projection based on:
Height from support to neckline projected upward
Proximity to a previous resistance level
🧠 Professional Trading Insight
This setup reflects textbook bullish structure with multiple layers of technical confluence:
Price Action: Clean double bottom, breakout, and retest.
Structure Shift: Transition from lower lows to higher highs post-breakout.
Risk-Reward: Favorable with a clear invalidation point and logical upside target.
📌 Final Notes for Traders
This setup would be ideal for swing traders or intraday traders looking to capitalize on trend reversals.
Always validate with additional tools like volume spikes, RSI divergence, or moving averages for added conviction.
Discipline and patience are key — enter only upon confirmed retest or bullish engulfing on the retest candle.