Neutral - GLD (Short-term) & Short (Long-term)A. Short-term: NEUTRAL
Daily chart pattern: Double top
RSI: Close to 50. Needs to cross 50 to turn bullish momentum
1. Double top confirmation
- Fib 0.382 rejects at $299.85
-> Enter PUT option for PT: ~$280.5
2. Failed double top
- Pass fib 0.382 at $299.85 to gap up
-> Enter CALL option for PT1: ~$303
PT2: ~306.5
B.Long-term: PUT
Overall long-term opinion: LEAP PUT for GLD with expiration date more than 1 year. PT: ~200
Double Top or Bottom

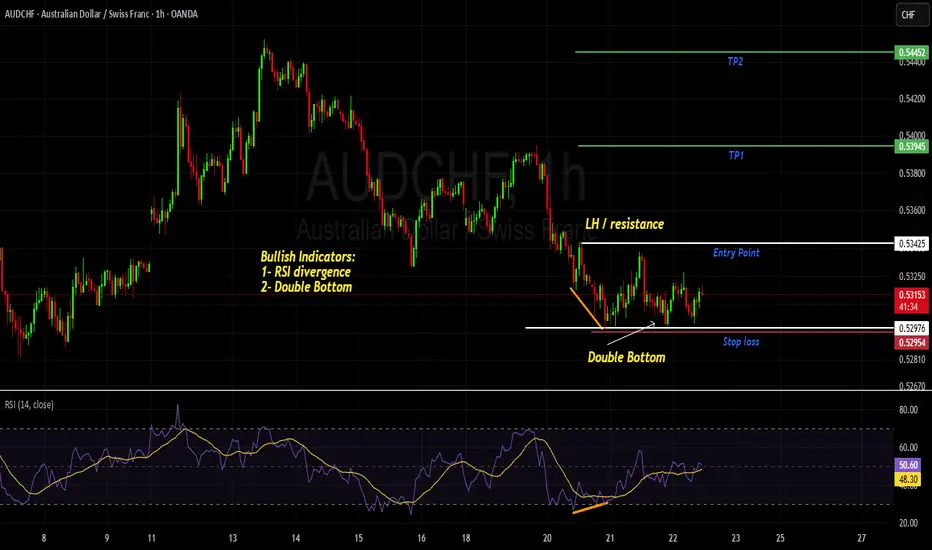
AUDCHF- BUYCALL - RSI divergence and Double Bottommarket has formed Bullish divergence on Bearish trend followed by Double Bottom formation. This indicates that market will now reverse the trend and we can expect bullish trend.
Entry will be taken after breakout of resistance level which is also a LH and TPs will be 1:1 and 1:2 accordingly. SL is placed slightly below the Double Bottom.
Dow Jones Index (US30): Time to Grow
As I predicted yesterday, US30 nicely respected
a wide daily support cluster.
A pullback from that is now confirmed with a violation
of a minor horizontal resistance on a 4H.
The index may reach 42200 level soon.
❤️Please, support my work with like, thank you!❤️
I am part of Trade Nation's Influencer program and receive a monthly fee for using their TradingView charts in my analysis.

5/23 Gold Analysis and Trading SignalsGood afternoon everyone!
Gold did not touch our key buy or sell zones yesterday, but flexible intraday range trading worked well, resulting in decent profits.
Currently, the price has reached around 3330, and from a technical standpoint, bulls remain in control. If no negative surprise hits the market, gold could target 3368 today, with a potential to test 3400 resistance next week.
🔔 On the news front, two key events during the U.S. session today deserve attention:
A speech by Fed Governor Lisa Cook on financial stability — may provide hints about the Fed’s stance.
An executive order signed by Donald Trump, which might impact markets depending on its content (e.g., taxes, tariffs, or spending).
Also, note that U.S. markets will be closed next Monday, but this is unlikely to cause major disruptions. Positions held over the weekend can still be adjusted during the Asian session on Monday.
📈 Today’s Trading Recommendations:
📉 Sell near 3382–3398 (Resistance zone)
📈 Buy near 3274–3256 (Support zone)
🔁 Flexible trading levels:
3285 / 3296 / 3307 / 3316 / 3328 / 3337 / 3346 / 3361 / 3373

SHORT ON AUD/NZDAUD/NZD has a double top that formed after sweeping the Asian highs.
I will be selling this pair looking to make 50-80 pips.

Will Gold Finally Reverse?After a strong and extended uptrend, gold is now ranging. On the 4H timeframe, a clear CHoCH broke structure, hinting at early weakness.
The inducement above price acts like a magnet. If swept, it could trigger a reaction from the 4H supply zone. That area marks a potential turning point for a deeper shift.
If this rejection holds, we may be witnessing the first signs of a high-timeframe reversal.

DOW JONES INDEX (US30): Your Plan to Buy Explained
There is a high chance that US30 will resume growth soon.
The index is currently testing a wide daily support cluster.
My signal to buy will be a bullish violation and a candle close above
41920 minor horizontal resistance.
A bullish movement will be anticipated at least to 42200 level then.
❤️Please, support my work with like, thank you!❤️
I am part of Trade Nation's Influencer program and receive a monthly fee for using their TradingView charts in my analysis.

EURNZD: Pullback From Resistance Confirmed?! 🇪🇺🇳🇿
Odds are high that EURNZD will retrace from the underlined blue resistance.
The pair looks bearish from the intraday perspective after a release
of German fundamentals this morning.
I think that the price may drop to 1.9027 level.
❤️Please, support my work with like, thank you!❤️
I am part of Trade Nation's Influencer program and receive a monthly fee for using their TradingView charts in my analysis.

BTC Double Top Patterns As we see BINANCE:BTCUSD made a new high that can be a double top formation on chart.
Also when we see the RSI chart it is seeing resistance above 60 and keep falling below 60.
So Looks like a bearish trend and if BINANCE:BTCUSD breaks its 3 months support around 91700 then we can see BINANCE:BTCUSD around 76000.
Lets see!
This post is just my perception and for study purpose only.
As crypto market has high risk of loosing money. Please invest your hard earned money carefully.
I will not be responsible for any loss in the crypto market.

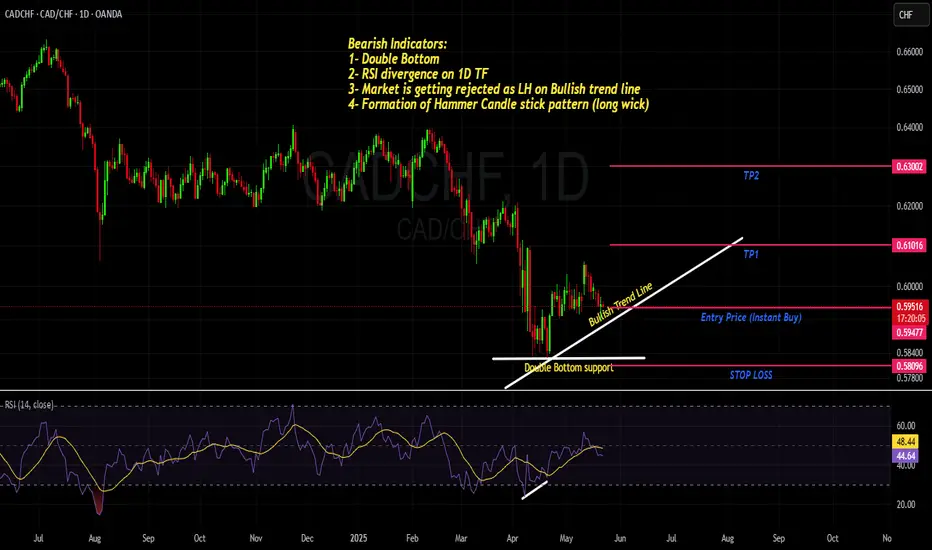
CADCHF- Another way to Look at BULLISH BIAS - 5 Strong Reasons Strong confluences on 1D time frame for the Bullish BIAS on this pair.
1- RSI divergence
2- Formation of HH and HL
3- Bullish Trend Line
4- Hammer Candle stick pattern formation
5- Double Bottom
we anticipate the market to remain in Bull phase.
Entry point is market with TP1 and TP2 as R:R of 1:1 and 1:2 respectively. Keep you Stop loss slightly below the Double Bottom (Support line)
BB/USDT – Bullish Setup with Wedge Breakout Potential | 1H ChartBBUSDT is currently presenting a strong bullish technical structure backed by multiple confirmations:
🔹 A double bottom has formed, signaling potential trend reversal.
🔹 Bullish divergence on the RSI strengthens the bullish outlook, showing hidden buying pressure.
🔹 Price action is compressing within a symmetrical wedge, and no bearish reversal patterns are currently observed.
A breakout above the wedge resistance trendline could lead to further upside continuation.
📌 Entry: $0.18554 (upon confirmed breakout)
🛡️ Stop Loss: $0.16322 (below structure support)
🎯 Target: $0.21591 (+15.13%) — You may also set your take-profit levels based on your own risk-reward ratio and trading style.
As long as the structure holds and no bearish confirmation appears, the setup remains valid. Always manage risk accordingly.

ATOMUSDT LongThis is not a signal but just my observation since I noticed some double bottom on this time frame 1D.

GBPCHF – Pullback to Demand Zones for Possible Buy Setup | ProfiOn the 1H timeframe, GBPCHF has broken above a key high and confirmed support with a solid close — showing bullish momentum.
However, price is currently reacting to a 1H red order block, which could trigger a short-term correction.
We’re now waiting for price to revisit one of the lower demand zones for potential buy opportunities. Make sure to look for multiple confirmations on the lower timeframes (M5 or M3) before entering any trade.
Also, keep an eye on the red supply zone above; it may offer valid sell opportunities if bearish confirmations appear.
📌 Key Levels
🟢 Support Zones:
• 1.1036 – 1.1046
• 1.0920 – 1.0950
🔴 Resistance Zone:
• 1.1250 – 1.1290
⚠️ Entry only with confirmation – patience pays.
🔍 Insight by ProfitaminFX
If this outlook resonates with your own view, drop your chart or feedback below. Let’s learn and grow together 📈

GBPCHF: Bullish Move From Trend Line 🇬🇧🇨🇭
I think that there is a high probability that GBPCHF
will pull back from a rising trend line on a daily.
As a confirmation, I spotted a bullish engulfing candle
after its test on an hourly time frame.
Goal - 1.1085
❤️Please, support my work with like, thank you!❤️
I am part of Trade Nation's Influencer program and receive a monthly fee for using their TradingView charts in my analysis.

EURUSD Sell Swing TradeHello Traders,
I stumbled across the Euro Dollar chart on the daily time-frame only to notice we are coming near a level of some significance at 1.12778
I noticed some historic bearish rejections on this key level and whilst looking at market structure, I was interested in another bearish move from this market.
I zoomed into the 4hr time frame to see what candlestick patterns I could identify to build to some value into the trade idea.
Not only did I do this, but I found a large wick rejection candle form below my structure level which I have used for entry.
I anticipate that we will see this pair take price down to previous structure lows and break lower depending on how quickly the market reacts
Entry @ 1.12518
Stop Loss @ 1.12970 - 45.2pips
Take Profit @ 1.10751 - 176.3 pips
Best of luck if you take this !!!

GBPUSD breakout looks to fail… or is another move coming?UK inflation just shocked the market, and GBPUSD reacted fast. We explain the setup, the risk-reward if this year's high is breached, and how seasonal effects may be distorting the inflation data.
This content is not directed to residents of the EU or UK. Any opinions, news, research, analyses, prices or other information contained on this website is provided as general market commentary and does not constitute investment advice. ThinkMarkets will not accept liability for any loss or damage including, without limitation, to any loss of profit which may arise directly or indirectly from use of or reliance on such information.

5/20 Gold Trading SignalsGood afternoon, everyone!
Last Friday and yesterday, gold did not reach our primary buy or sell zones, instead moving within a narrow range. We captured two trades, gaining about $32 in total movement, resulting in moderate but stable profits.
After opening today, the price pulled back toward the 3200 area, which holds technical support. However, resistance remains dense above, especially between 3226 and 3243. For bulls to break through, stronger momentum and volume will be required.
On the news front, there are no major economic events or key speeches scheduled today, so technical trading will dominate.
Currently, gold continues to consolidate. If intraday volatility remains limited, traders can look to buy low and sell high within the 3243–3189 range. Watch for resistance around 3226 and support at 3198 as key technical levels.
📌 Trading Strategy for Today:
🟢 Buy Zone: 3189 – 3168 (Near support, suitable for bottom fishing)
🔴 Sell Zone: 3267 – 3288 (Close to resistance, good for shorting)
🔄 Scalping/Flexible Zones:
▫️3198-3218-3226-3238-3247-3255
📌 Note: Maintain proper position sizing, set clear take-profit/stop-loss levels, and stay flexible. If there's unexpected news or a breakout during the U.S. session, strategies will be adjusted accordingly.

EURCHF: Bullish Wave Ahead?! 🇪🇺🇨🇭
I think that EURCHF is going to resume a bullish rally soon.
A strong bullish reaction to a rising trend line on a daily,
triggered a formation of a buying imbalance on a 4H time frame
and a Change of Character.
I expect a growth at least to 0.941 level.
❤️Please, support my work with like, thank you!❤️
I am part of Trade Nation's Influencer program and receive a monthly fee for using their TradingView charts in my analysis.

BTC/USD Bearish Setup – Trendline Retest Before the Fall?🔍 Technical Breakdown – BTC/USD 3H Timeframe
Bitcoin is displaying a textbook Double Top pattern formation on the 3-hour chart, signaling a potential bearish reversal after a strong bullish run. This classic pattern suggests buyer exhaustion and sets the stage for a downward move. Let's break down the analysis:
🧠 Pattern Insight: Double Top Reversal
A Double Top is one of the most reliable trend reversal patterns, especially when it forms after a sustained uptrend — just like we're seeing here.
Top 1 and Top 2 both formed inside a strong Resistance Zone between $106,500 and $107,000, showing repeated rejection from buyers to push price higher.
The formation of lower highs and long wicks near Top 2 further reinforce the weakening bullish momentum.
💥 Neckline Breakdown & Bearish Trigger
The Neckline, aligned with a horizontal Support Zone (~$103,300–$103,800), was decisively broken, confirming the pattern.
This breakdown acts as the trigger for bearish entries, and we are now in the "Retest Phase", where price often pulls back to the neckline or a nearby trendline before continuing lower.
📐 Trendline Confluence – Retest Opportunity
A short-term descending trendline drawn from Top 2 intersects near the neckline zone.
Price is now approaching this confluence area, offering a potential high-probability short entry if bearish price action confirms (e.g., a rejection candle like a bearish engulfing or pin bar).
🎯 Price Targets & Trade Setup
Parameter Value
📍 Entry On bearish confirmation near neckline/trendline retest (~$105,300)
❌ Stop Loss (SL) Above recent swing high / Top 2 (~$107,100)
🎯 Target ~$97,126 (based on measured move from top to neckline projection)
⚖️ Risk:Reward Approx. 1:3 or better (depending on entry timing)
Measured Target Calculation:
Height from neckline to peak (~$107,000 - $103,500 = $3,500)
Target = Neckline break - height = ~$103,500 - $3,500 = $97,000–$97,100
🔥 Market Context & Psychological Edge
This chart structure reflects a shift in market sentiment. What was once strong bullish momentum is now hesitating — with buyers failing to make higher highs and sellers stepping in aggressively. The double top is not just a pattern, it's a narrative of exhaustion and reversal.
“Let price confirm your bias. Don't just predict; react to structure and behavior.”
Being patient and letting the retest play out is crucial. Don’t rush in early — let the market give you a clean signal. This is where technical discipline pays off.
⚠️ Risk Management Notes
Crypto markets are highly volatile — avoid oversized positions.
A failed double top can lead to a bullish continuation, so SL discipline is key.
Wait for confirmation — candlestick patterns, momentum shifts, or bearish volume spikes can add confidence.
📌 Summary
✅ Pattern: Double Top
✅ Confirmation: Neckline Break
🔄 Current Phase: Retesting Neckline/Trendline
📉 Bias: Bearish
🎯 Target: ~$97,100
❗ SL: Above Top 2
💬 What do you think? Are we headed to GETTEX:97K or is this just a fakeout? Drop your thoughts below and don’t forget to like and follow for more trade setups!

MarketBreakdown | USDJPY, EURAUD, NZDJPY, CADCHF
Here are the updates & outlook for multiple instruments in my watch list.
1️⃣ #USDJPY daily time frame 🇺🇸🇯🇵
The pair demonstrates clear strength of the sellers.
The price went way below a recently broken resistance.
With the absence of impactful fundamental news,
the market may continue falling for now.
2️⃣ #EURAUD daily time frame 🇪🇺🇦🇺
The market is trading within a wide falling parallel channel on a daily.
Its upper boundary is a strong vertical resistance.
I will look for selling from that.
Alternatively, its bullish breakout may push the prices much higher.
3️⃣ #NZDJPY 4H time frame 🇳🇿🇯🇵
Before an Australian interest rate decision at night,
the pair acted strongly bullish, following our plan.
I see a nice double bottom pattern and a confirmed bullish Change of Character CHoCH.
I think that growth will resume soon
4️⃣ #CADCHF 4H time frame 🇨🇦🇨🇭
The price formed a nice bullish flag pattern.
I am waiting for its bullish breakout to confirm a start
of a new bullish wave.
A candle close above its upper boundary will validate the violation.
Do you agree with my market breakdown?
❤️Please, support my work with like, thank you!❤️

Light Crude Oil Daily Double Bottom Bullish Reversal Trade Plan
Price has formed a clear Double Bottom pattern with a neckline as current Temporary Resistance.
• ✅ Entry is triggered only after a confirmation candle breaks above the neckline.
• Buy Stop is placed below the neckline to catch the momentum move.
• Stop Loss is at the recent lower Low (safe and logical placement).
• 🎯 Take Profit levels are based on measured move projections.
Trade Plan:
• Entry: 64.20
• Stop Loss: 55.12
• Take Profit 1: 73.28
• Take Profit 2: 82.36
• Volume: 0.21 X 2
“Waiting for neckline to break with Bulliwh confirmation candle” – this ensures you enter only on strong momentum.
Light Crude Oil future is forming a classic Bullish Reversal pattern with clear structure. A break of the neckline confirms the setup
Key Highlights:
• ✅ Pattern: Double Bottom
• ⚠️ Confirmation: Break + Bullish candle
• 🔄 Risk Management: Tight SL, 2 TP levels
• 🧩 Confluence: Trendline break + structure shift + RSI Divergence

GBP-AUD Double Top Pattern! Sell!
Hello,Traders!
GBP-AUD made a retest
Of the horizontal resistance
Level of 2.0820, then
Established a double-top
Pattern and is now going
Down so we are locally
Bearish biased which
Means that we will be
Expecting a further
Bearish move down
Sell!
Comment and subscribe to help us grow!
Check out other forecasts below too!
Disclosure: I am part of Trade Nation's Influencer program and receive a monthly fee for using their TradingView charts in my analysis.

Gold still has the potential to rebound, continue to buy goldTechnical aspect:
Gold has just retreated to around 3217 and then rebounded again. It has now rebounded to around 3235. Although the rebound strength is a little weak, it has even hovered around 3235 for a long time. But structurally, gold did not destroy the rising structure during the decline, and the strength of structural support was strengthened after the effective retracement support. After being recognized and accepted by the market, gold will continue to rise with structural support. Once gold breaks through the short-term resistance area of 3250-3260, it will continue to rise to 3280-3290, or even around 3320.
Trading strategy:
Before the short-term rising structure is destroyed, we can still continue to try to go long on gold in the 3325-3315 area, TP: 3240-3250
