5/9 Gold Trading SignalsLong time no see, my friends! My holiday trip is about to end. I attended two weddings during this trip, which was unforgettable! I hope that everything goes well for everyone during my absence!
Gold has risen recently and returned to above 3400 again. Although it has fallen back in the past two days, the current technical level shows that the bulls are not over yet! This means that if there are friends who buy at high prices, they will have a chance to get out of trouble without doing other operations!
From the current pattern, it is in the stage of triangle consolidation. It is necessary to pay attention to the resistance of the 3360-3382 range. If the price falls under pressure at this position, we need to observe the support of the 3300-3280 range to determine whether it can form a short-term double bottom pattern or a head and shoulders bottom pattern again, so as to support the bulls to run again.
Based on the above analysis, today's trading suggestions:
Sell in the 3364-3386 range
Buy in the 3318-3302 range
Flexible trading in the 3323-3362 range
Double Top or Bottom

SONIC | (Previously Fantom) | HUGE BULLISH PatternFTM has now officially been replaced on most exchange and is now trading as Sonic.
At first we saw an initial drop, typical "sell the news" actions, but now there is a bullish pattern forming in the 4h timeframe.
SONIC is bullish because:
✅ Upwards trendline trading
✅ Higher Lows
✅ Bullish chart pattern: W-Bottom
_______________
BYBIT:SONICUSDT

AVAX Breakout: 33% Upside? Crypto Market Heating UpAVAX just broke out of an ascending triangle pattern with a potential 33% upside. In this video, we walk through the setup, risk management, and why this might still have legs. We also look at Bitcoin, Ethereum, and Solana to understand how correlated moves could affect altcoins like AVAX. Don't miss the key levels and timing to consider before it's too late.
This content is not directed to residents of the EU or UK. Any opinions, news, research, analyses, prices or other information contained on this website is provided as general market commentary and does not constitute investment advice. ThinkMarkets will not accept liability for any loss or damage including, without limitation, to any loss of profit which may arise directly or indirectly from use of or reliance on such information.

bobet is ready to fry #bobet is showing a promising pattern. Historically, the 200-day SMA has acted as strong dynamic support and resistance — and it's being respected again.
Recently, #bobet broke above the 200-day SMA. Before that, a clear double bottom formation appeared — a classic and powerful reversal pattern.
Now, only one major barrier remains: the confluence of key horizontal resistance and the top of the descending channel.
Watch trading volume — we've seen a noticeable spike in recent weeks, which adds weight to the move.
Everything seems set for a new bullish trend.
What we need now is a clean breakout above 25 TRY, a healthy general market, and a well-defined stop-loss. That’s it.

NZDUSD has formed a double top patternOn the daily chart, NZDUSD has formed a double top pattern, and the current bearish trend is dominant. At present, attention can be paid to the resistance near 0.5920. If the rebound is blocked, consider selling. The support below is around 0.5760.

USDJPY: Pullback From Resistance 🇺🇸🇯🇵
There is a high chance that USDJPY will retrace
from the underlined blue resistance cluster.
As a confirmation signal, I spotted a double top pattern
on that on an hourly time frame.
Closest support - 145.1
❤️Please, support my work with like, thank you!❤️
I am part of Trade Nation's Influencer program and receive a monthly fee for using their TradingView charts in my analysis.

LODHA - Bearish due to forming double Top pattern
TECHNICAL INDICATORS -
DOUBLE TOP PATTERN formation -
NSE:LODHA has formed a double top pattern indicating strong downward pressure for the stock
Double top is characterized by two consecutive peaks on a price chart, with a dip or low between them & subsequent breakout
VOLUME SPIKE -
the stock has recently shown two large volume spikes indicating strong upcoming momentum for the stock
Generally volumes increase before a significant price movement
SHOOTING STAR candlestick -
the stock has formed a shooting star candlestick recently indicating trend reversal for it ie from upward movement to downward movement
Shooting star is characterized by a small body at bottom and a long upper shadow of a candlestick
GAP-DOWN BREAKOUT -
the stock has broken out of the pattern with a gap-down indicating very strong downward pressure
PROFIT TARGET -
1200
STOP LOSS -
1325

Gold at critical stage (ready to short)Gold is at critical stage any movement from here will be sharp downside, I will wait for it
It is forming M pattern in Day chart

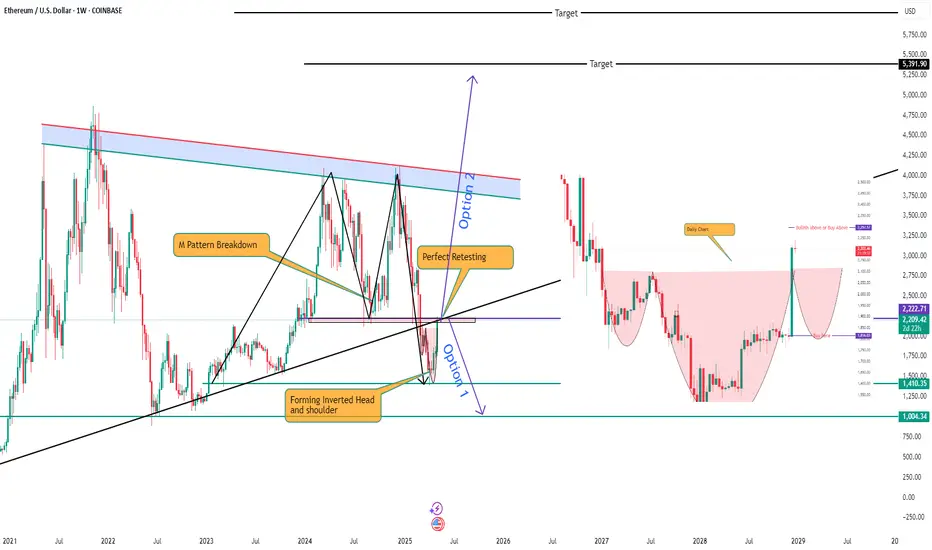
Ethereum - Perfect exactly how I thoughtEthereum
Stage 1 - Triangle Pattern - Gave perfect breakdown of triangle pattern
Stage 2 - Form M Pattern - Have almost completed the selling target
Stage 3 - Retesting completed *Current)
Stage 4 - Forming inverse cup and handle and inverted head and shoulder pattern
Stage 5- in either of the scenario it may come down but if it goes above 2297 expect it to reach 4000/500/7000 in coming days
Stage 5.2 - if the retesting is completed and bearish patter is continued expect it to reach to 900 USD
For more details ping me
GK Trade manthan
AVAX 1H Chart SetupThis chart features AVAX on a 1-hour timeframe with a 50-period SMA, RSI(14), and trend lines. Created for technical analysis and personal reference. Shared for transferring to another account.

CRV 1H Chart SetupThis chart features CRV on a 1-hour timeframe with a 50-period SMA, RSI(14), and trend lines. Created for technical analysis and personal reference. Shared for transferring to another account.

RSR 1H chartThis chart features RSR on a 1-hour timeframe with a 50-period SMA, RSI(14), and trend lines. Created for technical analysis and personal reference. Shared for transferring to another account.

BTC 1H Chart setupThis chart features BTC on a 1-hour timeframe with a 50-period SMA, RSI(14), and trend lines. Created for technical analysis and personal reference. Shared for transferring to another account.


Natural gas short tradeShorted Naturalgasm @ 309.5 looking at recent double top. The major trend in natural gas is downtrend. This trade is in confluence with major trend. The volume is also supporting the trade.

Bank of England cuts rates but does no pivot, GBPUSD surgesThe Bank of England cut rates to 4.25% but held off on signalling faster easing. GBPUSD is rallying as traders unwind bearish bets. Add to that a new US-UK trade deal, and the pound could see further upside. Watch for a breakout above 1.3440 that could target 1.38 or even higher.
This content is not directed to residents of the EU or UK. Any opinions, news, research, analyses, prices or other information contained on this website is provided as general market commentary and does not constitute investment advice. ThinkMarkets will not accept liability for any loss or damage including, without limitation, to any loss of profit which may arise directly or indirectly from use of or reliance on such information.

AUDCAD 1 hour possible Double Bottom📉 Technical Overview
1. Pattern in Formation: Potential Double Bottom
Price action suggests a potential double bottom pattern forming around the 0.88800–0.88900 support area.
A neckline is clearly identified around the 0.89300 level.
Price is currently between the second low and the neckline — an important “watch zone.”
2. Confirmation Required
The double bottom is not confirmed yet.
A valid long trade setup would require a clear breakout and close above 0.89300 (neckline resistance).
3. Target & Risk
The projected move (measured from the neckline to the bottom of the pattern) gives a target around 0.89740.
That’s approximately +42–43 pips from the breakout point, offering decent risk-to-reward potential.
✅ Trade Idea (Upon Confirmation)
Buy Entry: After a 1H candle closes above 0.89300.
Stop Loss: Below the second bottom – around 0.88900 or slightly below.
Take Profit: Around 0.89740 (measured target of the pattern).
Risk:Reward Ratio: Approx. 1:2, favorable for a breakout trade.
⚠️ Caution
If price fails to break above the neckline and reverses, it may revisit the 0.88800 zone or even break down — invalidating the setup.
Monitor Canadian and Australian economic news, especially commodity data or employment figures, for volatility spikes.

Linc Ltd: Cash IdeaLinc Ltd – Positional Trade Setup
Technical Setup:
Strong support at the 61.8% Fibonacci retracement from the previous upmove.
Weekly RSI shows positive divergence, suggesting a potential reversal.
Daily RSI is sustaining above 60; Weekly RSI above 40; Monthly RSI holding 40 support.
W-type pattern visible and forming on the weekly timeframe.
Trading above the 5 EMA on the monthly chart.
Strategy:
Go long with a strict stop-loss at ₹95.
Targets: ₹148, ₹177, and ₹200.
Maintain an average entry near the ₹95 zone for favorable risk-reward.
Staggered buying is advised—initiate partial position now and add more if the price dips towards the SL zone.
Note: Despite strong signals, no setup is fail-proof. Stick to your SL and position sizing discipline.

Motheroson Buy in Cash"A weekly W-type pattern has already formed with a successful breakout above the neckline. Positive RSI divergence and support at the 61.8% Fibonacci retracement from the previous upmove further reinforce the bullish outlook. Any dips can be considered as buying opportunities."

IWM: ShortRussell 2000 ETF | 15-Min Chart | May 8, 2025
🚨 0.5–0.618 Fib Retracement Completed
Price has tapped into a key Fibonacci confluence zone (0.5–0.618), overlapping with previous CHoCH and unmitigated supply. This zone has historically triggered distribution phases on lower timeframes.
🔻 Technical Setup:
Price rejected from 198.4–198.7 zone
CHoCH and EQH levels form a liquidity trap above
Targeting demand near 193.78 (Fib extension 1.382 + historical support)
📊 Macro Context:
US Q1 GDP: -0.3% (contraction)
Core Inflation: Still sticky at 2.6%
Jobs Market: Strong, 177K added in April
Fed Today: Likely no cut, but any hawkish Powell tone could trigger a sharp risk-off move, benefiting this short bias.
🎯 Trade Idea:
Bias: Bearish
Entry: 198.35–198.70 (current level)
TP1: 197.43
TP2: 193.78
Invalidation: Break & hold above 199.50
⚠️ Wait for Powell @ 2:30 PM ET before scaling in. Volatility will spike.
#IWM #Russell2000 #Fed #SmartMoneyConcepts #Fibonacci #MacroTrading #LuxAlgo #RiskOff

AUDUSD: Bullish Reaction from Key Fibonacci Support AUDUSD breaks double bottom on the 38.2% Fibonacci retracement
🚀Price has formed a double bottom around the 38.2% Fibonacci retracement level. The 15:00 candle confirms bullish strength. If this structure holds, the price may extend to retest yesterday’s high.
🔍 Trade Setup
Entry limit:
Stop Loss:
Take Profit:
Risk/Reward: ≈
💬 What do you think?
Are you also long on AUDUSD?
Share your thoughts in the comments 👇

GOLD (XAUUSD): Trading Plan BEFORE FOMC
Gold bounced yesterday, as I predicted.
Today, we see a retest of a broken daily resistance
that turned into support after a breakout.
BEFORE FED Rate Decision today, there is another opportunity
to buy Gold:
I see a double bottom pattern on an hourly time frame.
Bullish violation of its neckline and an hourly candle close above
3394 will provide a strong intraday confirmation.
It will push the prices at least to 3429 level.
❤️Please, support my work with like, thank you!❤️
I am part of Trade Nation's Influencer program and receive a monthly fee for using their TradingView charts in my analysis.

Double bottom and Demand on RIOT! OptionsMastery:
🔉Sound on!🔉
📣Make sure to watch fullscreen!📣
Thank you as always for watching my videos. I hope that you learned something very educational! Please feel free to like, share, and comment on this post. Remember only risk what you are willing to lose. Trading is very risky but it can change your life!
