EURGBP Technical Setup: 1:3 R:R Opportunity on RetestAfter the drop to 0.8250 — a level not touched since 2022 — EURGBP rebounded to 0.8450 before starting another decline.
However, the 0.8250 support held firm once again, a higher low follow, and EURGBP eventually broke above 0.8450, confirming a double bottom pattern.
Price acceleration quickly took the pair above 0.8700, and now EURGBP is undergoing a normal correction.
The broken neckline at 0.8450 now acts as clear support.
Traders could look to buy near the 0.8450 retest, using a tight stop below the neckline, and aiming for at least a 1:3 risk-reward ratio.
Disclosure: I am part of Trade Nation's Influencer program and receive a monthly fee for using their TradingView charts in my analyses and educational articles.
Double Top or Bottom

KSE100, Double Top with Bearish DivergenceDouble Top
Bearish Divergence
Closing Below 109500 will bring Index to 100k
Weekly Gap @ 100k will be filled with trendline Support
Double Top projections also aligned @ 100k

BTC/USD Price Action Update – April 28, 2025📊BTC/USD Price Action Update – April 25, 2025
🔹Current Price: 94,039.17
🔹Timeframe: 15M
📌Key Demand Zones (Support):
🟢93,331.61–93,464.50 – Immediate Intraday Demand (potential bullish continuation zone)
🟢92,901.29–93,042.00 – Deeper Demand Support (stronger reaction expected if tapped)
📌Key Resistance Level:
🔴94,518.29 – Short-Term Target Resistance
📈Bullish Outlook:
Price has shown strong recovery from the demand zones. Holding above 93,331 keeps the bullish structure intact. A clean break and retest can push price toward 94,518. Watch for bullish engulfing or BOS for confirmation.
📉Bearish Outlook:
If price breaks below 93,331, expect a deeper pullback into 92,901–93,042. Loss of 92,900 could indicate short-term bearish momentum.
⚡Trade Setup Tip:
✅Look for long setups on bullish reaction at 93,464 or 93,042
✅Manage trades carefully near 94,500 resistance
✅Use tight stop-loss for scalps below demand zones
#BTCUSD #BitcoinTrading #CryptoAnalysis #SmartMoneyConcepts #SupplyAndDemand #IntradayTrading #BreakOfStructure #BTCScalping #CryptoUpdate #FXFOREVER #ForexAndCrypto

LGVN Bullish opportunity Longeveron Inc. (LGVN) offers a strong bullish opportunity as it nears a potential breakout from its prevailing downtrend. The stock has been consolidating with increasing volume and tightening price ranges, indicating accumulating buyer interest. A decisive break above the critical resistance level of $1.92, coinciding with the downtrend's upper trendline, could trigger a bullish reversal, propelling LGVN toward an initial target of $2.25, with further upside potential to $2.60. Traders should watch for strong volume confirmation and stay mindful of broader market conditions to manage risks effectively.
Not advise for buying or selling, just I like what I do :)

GOLD UPDATEHello friends✌
As you can see, after a sharp price drop, gold has entered a range that has formed a double top pattern that warns us of a continued price drop, so be careful🔊📈
*Trade safely with us*

XRP/USDT: BUY LIMITHello friends
Due to the price rise, you can now see that a double top pattern has formed at the price ceiling, which indicates a correction. Therefore, we have identified good support areas for you to buy in steps and with capital management and targets.
*Trade safely with us*

Formed Strong Double bottom around 40.Formed Strong Double bottom around 40.
Immediate Resistance is around 46 - 47
Crossing this level & sustaining with good volumes
may witness 48.50 - 49.
On the flip side, 44 - 44.50 seems to be a Good Support.

Major Support being testedClean sell would be ideal if the Major support breaks.. until then bias remains bullish.

EUR/USD: Long-Term Breakout with Fundamental and Tech ConfluenceFor the first time since 2008, EUR/USD is showing signs of a potential long-term trend reversal.
The pair has broken above the descending channel that has defined the bearish structure for over 15 years.
But this is not just a technical breakout — the fundamentals support this move as well.
The U.S. dollar remains under pressure as the market shifts its rate expectations.
Instead of the 1–2 rate cuts initially priced in for 2025, forecasts now suggest 2–3 cuts, possibly more depending on the pace of economic softening.
This aligns well with the breakout we are observing on the chart.
Technical picture: confirming the breakout on all levels
1.The descending trendline from 2008 has been broken.
2.On the weekly timeframe, the price has already secured a close above this trendline, confirming the breakout structurally.
3.On the monthly timeframe, the 100-period SMA sits right at the neckline area of a large double bottom reversal pattern — adding one more layer of confirmation.
These factors are not isolated — they support and reinforce each other, creating a confluence of signals across multiple timeframes.
Target according to classical technical analysis:
The minimal target for this breakout stands at 1.2300.
This is both a major resistance zone from previous highs and approximately 70% of the height of the larger double bottom pattern — fully in line with the textbook approach to classical chart analysis.

Bitcoin To New Highs?NASDAQ:IBIT and COINBASE:BTCUSD have completed double bottoms. The first price target for IBIT is 56.9 with 63.37 also being a new all time high possibility

A fall for Gold is seen around here.Our trade is already activated... Let's take the buyers money now. a double top is confirmed.

NZDJPY - Bullish Double BottomHello Traders !
The NZDJPY price formed a double bottom pattern.
Currently, The neckline is broken!
So, I expect a bullish move🚀
______________
TARGET: 85.660🎯

AT&T I Tipping Point : Short Opportunity with Head & ShouldersHey traders after a previous trade trade on the hood hitting targets of 16.4%. Today I bring you NYSE:T
Technical + Fundamental View
Pro Tip
- Breakdown below the Entry Line will be considered at Trade Initiation. (Risky Traders)
R:R= 5.4
- Rest can follow entry at day close post breakdown SL above Entry Candle.
- The Breakdown Below the Entry Line will confirm the head and shoulder pattern
Entry Line - 26.93
Stoploss - 27.53
Target 1 - 25.59 (Neckline of head and shoulder)
Target 2 - 24.74
Target 3 - 23.68
Technical View
- Head And Shoulder on Daily Time frame
- On the hourly timeframe, the chart looks weak, showing a potential double top pattern where the second peak is lower than the first, indicating growing investor fear.
Fundamental View
- High Debt: Over $140 billion in debt limits investment capacity and consumes significant cash flow.
- Network Issues: Poor service quality and outages risk losing customers to competitors.
- Strong Competition : T-Mobile and Verizon offer better plans, making customer retention harder.
- Market Saturation: The U.S. wireless market is nearly saturated, limiting new customer growth.
- Execution Risks: Growth and debt reduction depend on flawless asset sales and network upgrades; delays could harm finances and stock performance.
Additional Considerations
- AT&T’s valuation is higher than some peers, potentially capping upside.
- Telecom market competitiveness means growth hinges on successful 5G and fiber rollouts.
- Dividend yield (~3.9%) is attractive but lower than some rivals, which may impact income investors.

GBPUSD double top: will technical and fundamental drivers align?GBPUSD is setting up for a massive move with a double top forming on the weekly chart. Learn how to catch the breakout and target over 1,300 pips with smart risk-to-reward.
This content is not directed to residents of the EU or UK. Any opinions, news, research, analyses, prices or other information contained on this website is provided as general market commentary and does not constitute investment advice. ThinkMarkets will not accept liability for any loss or damage including, without limitation, to any loss of profit which may arise directly or indirectly from use of or reliance on such information.

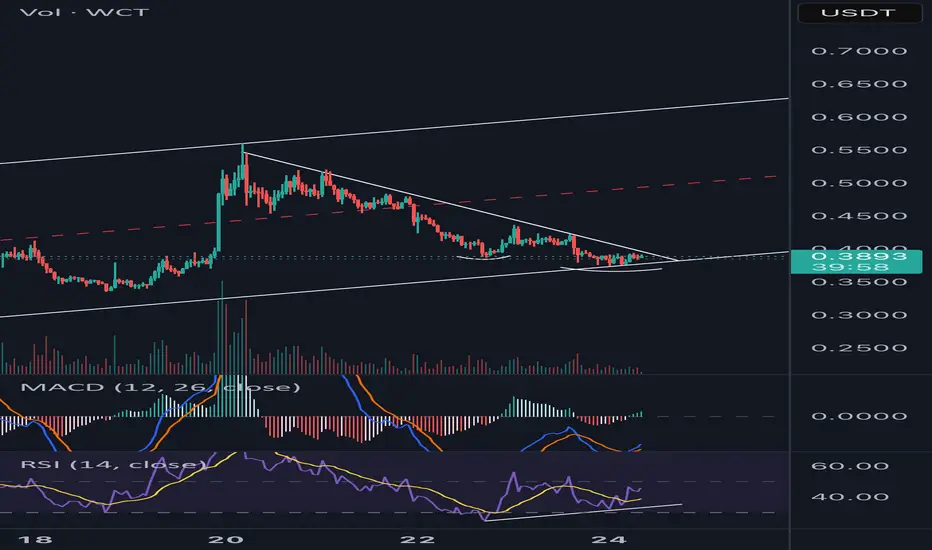
WCT is it the dragon? Could this be a dragon structure o.mn Wallet Connect Toke? Good divergence on the rsi. Pray for a big tail!
SILVER (XAGUSD): Pullback is Ahead!
There is a high chance that Silver will pull back from
the underlined blue daily resistance.
As a confirmation, the price formed a double top pattern
on that on an hourly chart and violated its neckline.
Goal - 33.185
❤️Please, support my work with like, thank you!❤️

COCHINSHIP :NSE TRENDLINE BO DTF/WTF POSITIONAL NEW Stock Analysis
Trade Plan:
Entry: 1580 50% of the total quantity at DTF Close, with an additional 50% added at 2130 DTF Close Price.
Stop Loss: 1340
Target 1: 2100
Target 2: 3000
Hold for a period of 6 months to 1 year or until the target 2 is reached.
Chart Pattern:
The stock experienced A BULL RUN FOR 6MONTHS period to touch an all-time high (ATH) of 2999 . A CONSIDERABLE PULL BACK FOR A MONTH AND NOW
Technical Indicators:
The stock’s daily timeframe (DTF) shows that the price is trading TODAY above the 50-day exponential moving average (EMA) and the 50-day EMA above the 200DEMA. The EMAs are in Ascending sequence of alignment. A potential bullish trend in formation on the DTF/WTF timeframe. The 20 DMA has turned upwards starting a bullish reversal and is below the 200DMA indicating an Early Entry
Volume Analysis:
There has been a gradual drying up of volumes on the sell side. There is buying in the past 4 days above the 20VMA. Price Breakout has been done yesterday and retest today take entry as recommended in Trade Plan.
Prioritize Watch List:
Keep this stock in your watch list for further analysis and potential trading opportunities.
Disclaimer: This information is solely for educational and reference purposes. Trading inherently carries risks, and it’s crucial to exercise caution and conduct comprehensive research before making any investment decisions. Make sure you have a well-defined risk appetite, proper position sizing, and a stop-loss order based on your risk tolerance. Review your Portfolio periodically. Exit positions when the price closes 7-8% below your entry point or Earlier basis your Risk profile. Consider re-entering the market when the trend reverses.Before engaging in any trading activities, it is paramount to thoroughly comprehend these technical analysis concepts and conduct extensive research on the stocks you are interested in. Furthermore, consulting a certified financial advisor can offer valuable insights and guidance before making investment decisions.
Technical Analysis Concepts:
Multiple Time Frame Analysis (MTFA):
Daily Time Frame (DTF): Used for short-term analysis and identifying trends.
Weekly Time Frame (WTF): Provides a broader perspective and helps in trend confirmation.
Monthly Time Frame (MTF): Ideal for long-term analysis and trend analysis.
All-Time High (ATH): The highest price reached on a specific chart.
Lifetime High (LTH): The highest price reached over the entire chart’s history.
Stop Loss (SL): A predetermined price level at which an investment is automatically exited to limit potential losses.
Swing Trade: A trading strategy that involves holding positions for a significant period, typically few weeks to months.
Positional Trade: A trading strategy that aims to capitalize on long-term trends and position oneself accordingly.
CHART PATTERNS
Rounding Bottom Cup/Handle (RBC&H): A pattern that signals a potential reversal from a downtrend.
Breakout (BO): A price move closure above a resistance or below a support level.
Flag & Pole BO: (F&P BO) Bullish Continuation Pattern
Consolidation : Price Typically Swings between a Range for a period of Time Long or Short basis the MTFA. Breaking out of this range UPWARDS is an opportunity to BUY and DOWNWARDS is SELL opportunity.
Moving Averages:
Exponential Moving Average (EMA): A popular moving average that places more weight on recent price data.
Volume-Weighted Moving Average (VWMA): A moving average that gives more weight to high-volume stocks.
Fibonacci Retracement/Extension:
Trend-based Fibonacci Retracement: Used to identify potential support and resistance levels during re-tracements.
Trend-based Fibonacci Extension: Used to identify potential breakout levels during extensions.

GBPUSD Sell analysis/ideaIn the daily timeframe, my trend line hasn't been touched for a while, and the price has bounced off of a very strong key level. In the 4-hour timeframe, I have a very clear downtrend structure about to form, and my trendline is broken.
complete explanation in the video.

GOLD UPDATEHello friends
As you can see in the picture, everything is clearly defined.
After a strong rise, we see a double top pattern at the top of the channel, which indicates that we should gradually wait for a correction.
Now, how far will the correction continue? In the picture, we have identified the support levels that the price can reach.
*Trade safely with us*

SHORT ON AUD/USDAUD/USD has given us a double top at a major resistance area/zone.
It has currently formed a lower high after giving us a change of character (choc) to the downside.
I expect price to drop to the next demand level for 200-300 pips.
Dxy News for the rest of the week should help fuel the move if positive for the dollar.

AUDJPY - Bearish Triple TOPHello Traders !
The AUDJPY reached a strong resistance level !
The price formed a triple top pattern.
Currently, The neckline is broken !
So, I expect a bearish move📉
_________________
TARGET: 88.580🎯

BRETT Breakout Inverse H&S 0.049 Next- Downtrend Breakout
- Retest of the downtrend successful
- Weekly Support = red line
- Weekly Resistance = blue line
$0.049 Target $0.048 Next

Ethereum: Falling Wedge, Double Bottom and MACD Divergence AlignA powerful bullish setup may be forming on ETH — but confirmation is everything. Watch how the falling wedge, double bottom, and MACD divergence align for one of the cleanest potential long opportunities.
Ethereum is now shaping a potentially powerful reversal structure, combining a falling wedge, a possible double bottom, and bullish MACD divergence. The price has been moving inside a well-defined downward channel since the December highs, gradually compressing within this wedge — and from my experience in both trading and teaching, Ethereum loves falling wedges. This pattern has historically worked well for ETH in previous cycles.
But it’s not enough to simply break out of the wedge. For the double bottom to fully confirm, price must also hold above the key ~$2,100 zone. Only then will all three factors — the wedge breakout, the double bottom confirmation, and the MACD bullish divergence — work together, aligning like a perfect constellation. I often say to my students: these moments are the trader’s “planetary alignment” — the rare setup where technicals support each other instead of contradicting.
If ETH manages to clear and retest this zone successfully, the structure opens the way toward the next targets at $2,350, $2,555, and potentially $2,800, as marked on the chart. These levels reflect previous accumulation zones and key reaction areas.
Another important factor is the correlation across markets. Bitcoin is also forming a double bottom, and we’re seeing a similar structure on the S&P 500. This potential synchronized movement between crypto and equities makes the setup even more interesting. Such alignment across assets doesn’t happen often — and when it does, it’s worth paying attention.
The key now is not to jump the gun. A clean breakout without confirmation often leads to fake moves. What I’m watching closely is whether ETH can close and hold above $2,100. Only then this setup becomes truly valid, offering an attractive entry point with a well-defined risk.
In my opinion, this is one of the most constructive technical scenarios we’ve seen on Ethereum in the past months. If the market confirms — the long opportunity here may come close to textbook perfection.
