GBPAUD Retests Double Top NecklineGBPAUD has broken the key support level of a double top pattern. The price is now caught between two important zones: the neckline of the double top, which is now acting as resistance, and the former resistance zone at 2.0725–2.0775, which has turned into support.
If this support fails, GBPAUD may continue toward the double top’s projected target near 2.04. However, if the neckline is reclaimed, the bearish setup would be invalidated.
Double Top or Bottom

GBPUSDRising wedge with bearish divergence, break of 1.3360 , which is the neckline of double top, break of this neckline starts the immediate sell pressure.

BITCOIN - Bullish Double BottomHello Traders !
The BTC price formed a double bottom pattern.
Currently, The neckline is broken !
So, I expect a bullish move🚀
______________
TARGET: 88700🎯

Long on CADThe price divergence on CAD is good for a typical double bottom
Trendline has also been broken

Macro ETH/BTC Bearish Adam & Eve (Double Top)Not looking good for ETH bag holders. The worst merge since the Philadelphia Experiment. Target 0.005 and below.

NFLX - Short OpportunityHad good earnings but general market condition mean its very difficult for it to standout.
Looks like it is not able to fend off QQQ sell off this morning.
Stops are at the highs of today. Looks for a move back to MAs.

Bitcoin risingBitcoin had 2 bullish divergences on daily TF , now its rising and 98k is not that hard to reach IMO

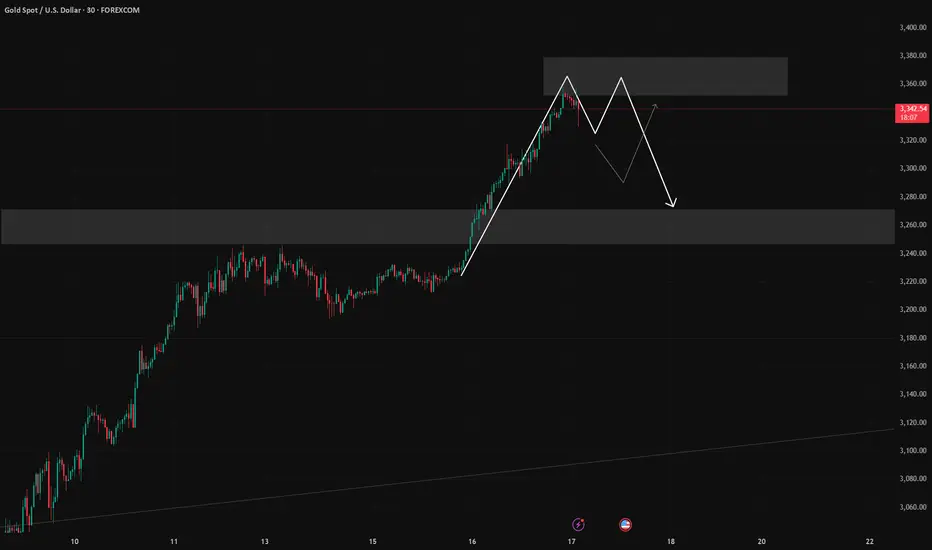
4/21 Gold Trading StrategyGood morning, everyone! A brand new week begins—wishing us smooth trades and great success ahead.
Looking back to last Thursday, our gold short strategy hit the mark perfectly. Prices dropped nearly $60 as expected, and we captured around $45 in profit from that move. Overall, we secured over $200 in profit space last week—an excellent performance.
Today, gold opened higher and continues to climb. Technically, bulls still have room to push higher, with 3360 as a key resistance level. However, judging by the current momentum, we may even see a test of 3400. That said, trading is about precision, not perfection. If prices approach 3380 and the upward momentum stalls, it may be time to watch for a pullback. On the other hand, if strength continues, holding some light long positions remains a relatively low-risk strategy.
Trading Strategy for Today:
📉 Sell in the 3380–3410 range
📈 Buy in the 3307–3280 range
🔁 Flexible trades between 3360–3330 / 3272–3315

Double Bottom formed around 164 - 165.
Double Bottom formed around 164 - 165.
Crossing & Sustaining 179 may lead it
towards 190 - 193.
For a Bullish Momentum, it needs to Cross
195 atleast.

USDCAD: Bullish Outlook & Pullback From Support 🇺🇸🇨🇦
There is a high chance that USDCAD will turn bullish after the market opening.
I spotted a strong bullish confirmation after a test of a key intraday/daily support.
A triple bottom formation and a breakout of its neckline provide a reliable
bullish signal.
Probability will be high that the price will bounce at least to 1.3676 level.
❤️Please, support my work with like, thank you!❤️


LTC/USDT:BUYHello friends
Due to the good price growth, we see that the price has hit a lower ceiling and has fallen, which we can buy in stages during the price decline, within the specified ranges and move with it to the specified targets.
Observe capital and risk management.
*Trade safely with us*

EURUSD:SIGNALHello friends
Due to the recent price growth, the price has now corrected in a support range.
Now, if the price continues to fall within the specified support ranges, we can make purchases with capital management and move to the specified targets.
*Trade safely with us*

TME Triple TopTME looks like a triple top. See reference image. I do believe we will return to the range between $5.50 - $10.50, and see a low in the 5-$6 range over the next several months. We can see a bearish divergence aligns with the three tops (RSI is decreasing for each of the three tops).
As always, classical technical analysis patterns increase in probability when utilized on the longer timeframes. We can see this setup forming on the weekly-timeframe, which I believe significantly increases the reliability of this setup.
Good luck, stay safe, have fun, and make money my friends.


4/17 Gold Trading StrategyYesterday, the escalation of the tariff issue significantly strengthened bullish momentum in gold, leading to a one-sided upward move. There’s no need for lengthy analysis today — in this kind of market condition, the focus should be on identifying sell opportunities. A sustained rally like this is almost always followed by a correction, even without any additional catalyst.
Furthermore, today’s initial jobless claims data may provide an opening for the bears. Even if the data is bullish for gold, the likelihood of another sharp rally is low at this stage.
Today’s Trading Recommendations:
Sell Zone: 3350 – 3390
Ideal for initiating short positions as gold approaches extreme levels.
Buy Zone: 3268 – 3252
Key support zone where long positions can be considered upon a pullback.
Range Trading Zone: 3330 – 3288
Suitable for flexible intraday trades based on market structure and real-time price action.
Summary:
After a strong one-sided surge, gold is now in overbought territory. Look for short setups at resistance zones, especially with potential catalysts like jobless claims data on the horizon. A healthy correction is both expected and necessary before any further sustained move upward.
BNBUSD - Double Top ScenarioPlotting a second double top that could push BNB way lower
Bars pattern in red shows this drop
This is the daily chart for BNB
Cautionary chart

Sell BTC if below 83000We're still in a downtrend, and the prior low has been cleared, and in the pullback back we have a strong supply zone which has been tested 3 times! The 3rd time we have this little pattern, which will probably see a bearish breakout. If this happens, we can enter with the breakout and sell for 73000, which makes an R/R of 2. So if the support zone of 83000 is lost, it is a good time to sell.

Bullish Bias: As long as gold stays above key support around $3,Here’s a chart showing both the recent 30-day trend and a projected move for the next 10 days. Based on the current momentum, gold could continue its climb, potentially reaching the $3,400–$3,450 range if geopolitical tensions and central bank buying persist.
Idea for the Next Move:
• Bullish Bias: As long as gold stays above key support around $3,300, the trend favors further gains.
• Target Zone: $3,420 to $3,450
• Risk Point: A break below $3,300 could trigger short-term profit-taking, possibly revisiting $3,250.
Want me to generate technical indicators (like RSI or MACD) or add support/resistance zones on the chart? 
Here’s a professional trading chart for gold (XAU/USD), including:
• Projected Price Movement (orange dashed line)
• Resistance Level at 3420
• Target Zone at 3450
• Support Level at 3300
• Stop Loss at 3280
This setup reflects a bullish scenario with risk managed just below recent support. Want to include RSI or volume indicators next, or explore a bearish scenario too? 

Cat's in the CradleHey Guys!! Here's one for you that you are going to Like
Let's Aim for a ~50% profit, on This one...
($22---->30 )
double-bottom,Trend Channel
Clearly defined Support-and-resistance Touch points.
Cheers!
And the cat's in the cradle and the silver spoon
Little boy blue and the man on the moon
"When you comin' home, Dad?"
"I don't know when, but we'll get together then
You know we'll have a good time then"

USD/JPY: Buy Opportunity from Key Demand ZoneWelcome back! Let me know your thoughts in the comments!
** USDJPY Analysis !
We recommend that you keep this pair on your watchlist and enter when the entry criteria of your strategy is met.
Please support this idea with a LIKE and COMMENT if you find it useful and Click "Follow" on our profile if you'd like these trade ideas delivered straight to your email in the future.
Thanks for your continued support! Welcome back! Let me know your thoughts in the comments!

SHORT ON NZD/USDPrice is in a overall uptrend but has started its pullback phase from the high.
Got a choc (change of character) to the downside as well as equal highs/ double top forming.
Dollar news just came out positive and there is a good chance this pair could fall 200-300 pips by the end of the week.

