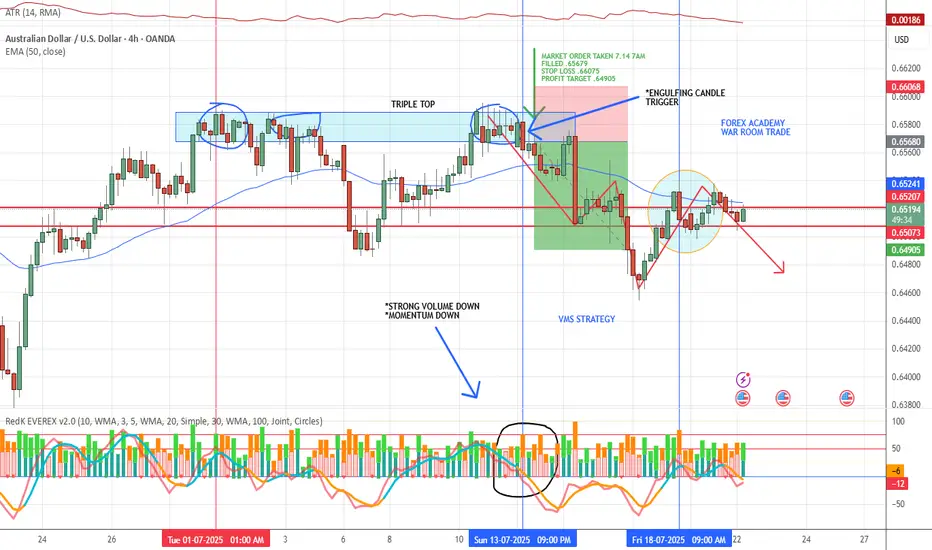
VMS STRATEGY APPLIED📈 VMS Strategy – Triple Top Win Example
We took this trade last Monday based on a textbook triple top reversal:
✅ Clean engulfing candle at resistance
✅ Strong downward volume
✅ Momentum clearly shifting in the trade direction
✅ Perfect timing with all elements aligning
On the 4-hour chart, we focus on specific reversal patterns within the VMS framework:
***Triple tops/bottoms
***Head & shoulders
***1-2-3 formations
***Hammer and shooting star reversals
Each setup must meet all VMS criteria before being considered.
A quick note on back testing:
We know traditional back testing can feel flawed—but here’s what works for us:
Start at the beginning of the month, hide future candles, and scan for VMS setups in real-time conditions. The trade either fits the rules—or it doesn’t. There’s no debate.
We’re not claiming perfection. This strategy does take losses—sometimes multiple in a row. But over time, through strict rule-following and patience, we’ve found consistency and success.
If this helps you, feel free to share it—or even just take a closer look.
With respect, always test it for yourself before trading live.
We’re here to share what’s working for us. We welcome thoughts and suggestions—but know this:
👉 This is a rules-based strategy rooted in discipline, not prediction.
🔒 Aligned Execution is the Edge.
Double Top or Bottom
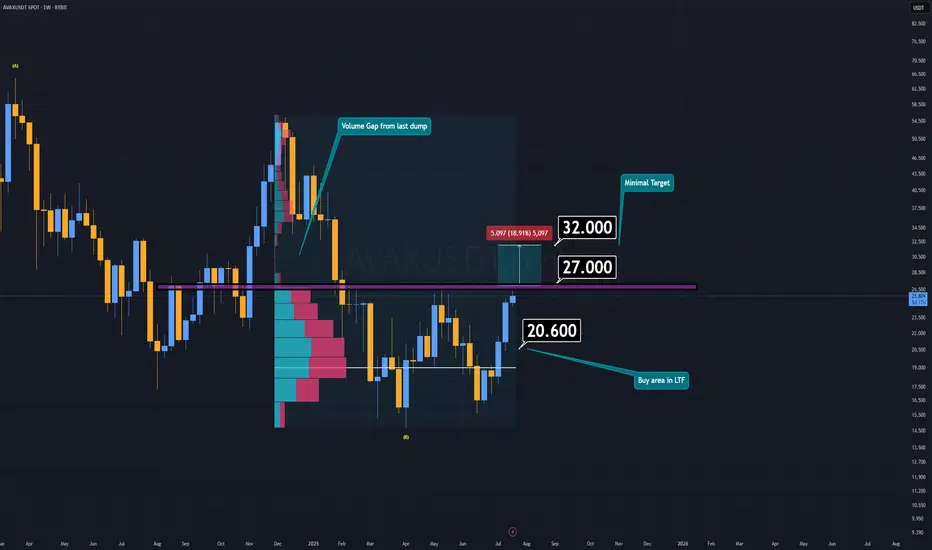
AVAX Analysis (1W)AVAX is currently attempting to form a double bottom pattern, which could signal a strong bullish reversal if confirmed. Earlier this week, AVAX made an effort to break down the key support/resistance zone, but it lacked the necessary volume to succeed.
If AVAX manages to reclaim the resistance area around $27 or higher, and confirms the breakout with a daily candle retest, the minimum target sits at $32.
However, if AVAX fails to break through resistance, there’s potentially an even better buying opportunity in the lower timeframes—a demand zone between $20 and $20.6.
I believe altcoins will offer another chance to catch up while prices are still far below their future valuations.
-S Wishes you the best in luck.
GOLD (XAUUSD): Bearish Move From Resistance Confirmed
Gold tested a significant confluence cluster on a daily time frame
that is based on a rising trend line and a horizontal resistance.
A double top formation on that on an hourly time frame indicates
a highly probable retracement from that.
Goal - 3378.5
❤️Please, support my work with like, thank you!❤️
I am part of Trade Nation's Influencer program and receive a monthly fee for using their TradingView charts in my analysis.

AUDUSD Sells In sells based on H4 bearish structure. H4 Double top, 61.8% Daily Retracement & evening star pattern. Im aiming for the daily support of 0.64160.

$UNI - $10 from here?Hi guys! 👋🏻
🔔I'll be trying this setup for Uniswap
🔔 We have bounced from the strong support at $4.80, which we retested in April 25 and May 7 forming a pattern impersonating a double bottom
🔔 With the current chart pattern and levels, I'll be expecting a jump with a target on $10.
🔔 Might drop to $5.70 before another move upwards.
✊🏻 Good luck with your trades! ✊🏻
If you like the idea hit the 👍🏻 button, follow me for more ideas.

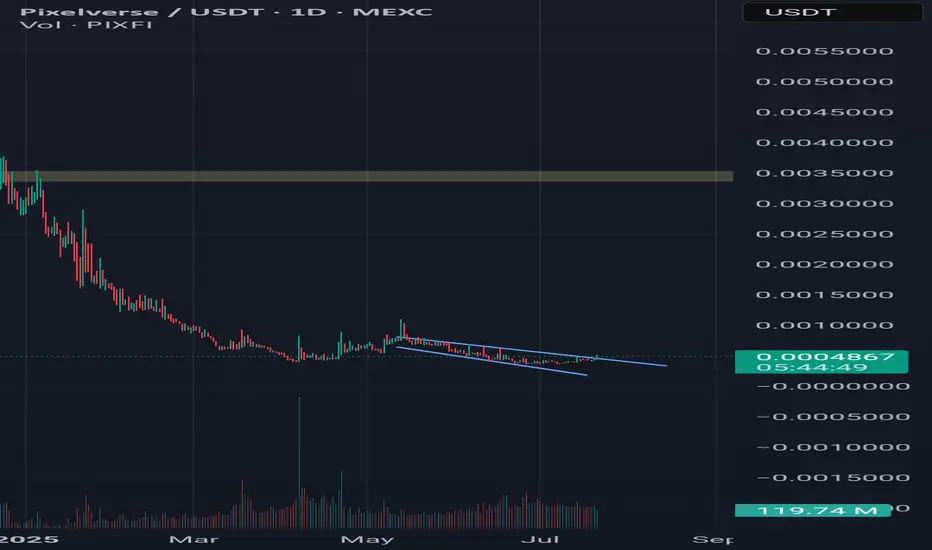
Pixel is longHello, today I will update you with the pixel analysis. I hope you enjoy it. This is a branch analysis. Be careful. If a daily candle closes above 0.0004848, we will go for a target close to 10x. Don't miss the opportunity. 0.0035 is just a few steps away.😉Be profitable.Please give me energy with your comments and likes and express your opinion.🇮🇷

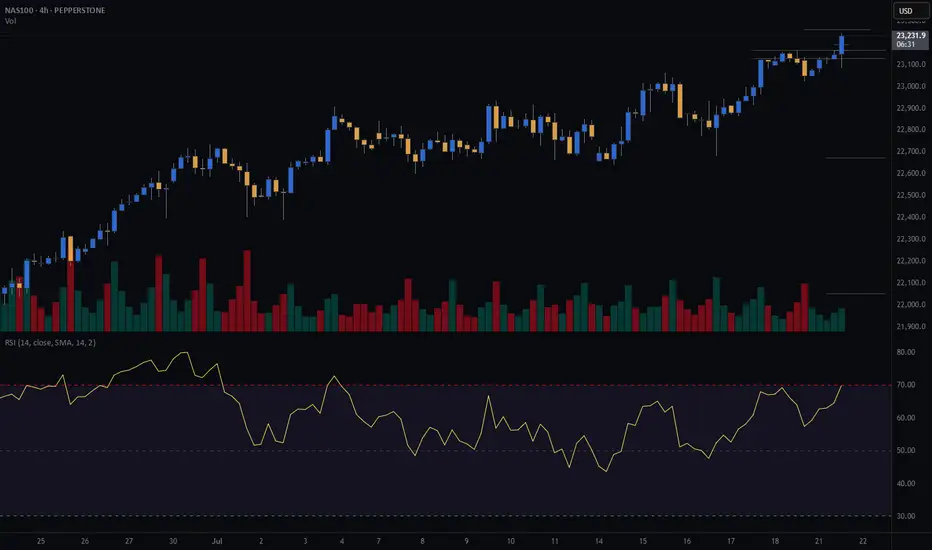
NASDAQ (CASH100) SHORT - Double TOP H4Risk/reward = 11.3
Entry price = 23 190
Stop loss price = 23 270.4
Take profit level 1 (50%) = 22 674
Take profit level 2 (50%) = 22 053
All variables met, and entered the trade.
What is everyone's thoughts on shorting or longing cash100?
Break Even Here Please The market has moved some pips from our original entry, its well advised to breakeven and take a chill for the day.
I hope you enjoy my setup so far. It's simple and easy to understand.

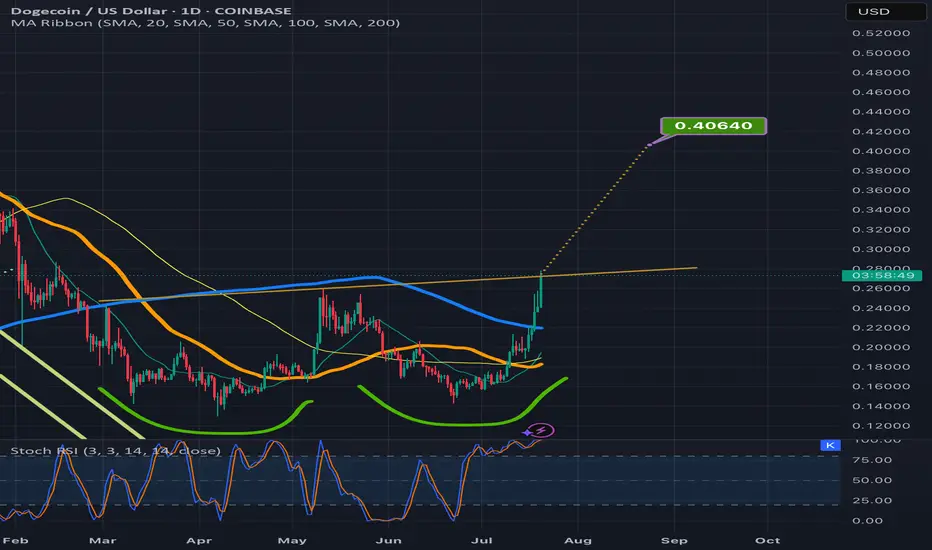
Doge inching above the double bottom necklineIt could easily dip back below the neckline a tie or two before it validates the breakout but definitely getting closer to doing so. Target is around 40-41cents. *not financial advice*
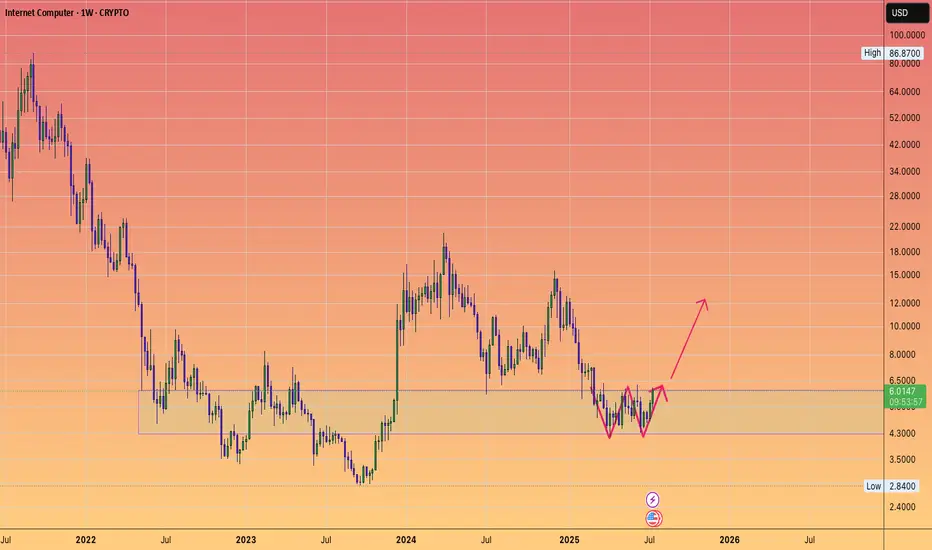
ICP still in the reload support zone....W pattern.
I like it down here.
Low risk accumulation block given the backdrop of #altseason going on.
Enjoy.
;)
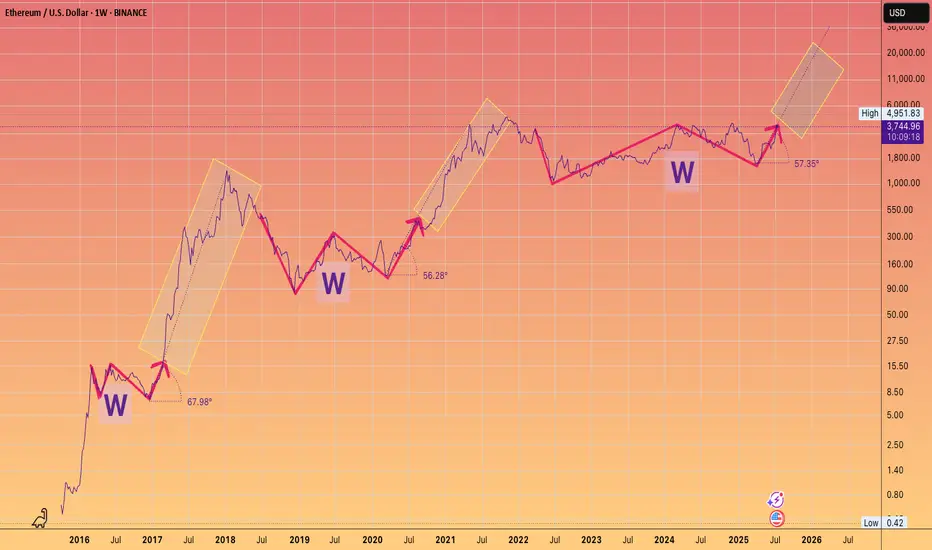
3 Wins to Glory.You guys know my long term Targets for ETH.
What I wanted to highlight is the angle of the Banana zone has been remarkably consistent on the Log chart.
Granted we only have 2 - 2.5 data points
But note how even in 2025 the run is adhering to the approx 60 degree angle of attack, after breaking out of their respective W's.
something to monitor.
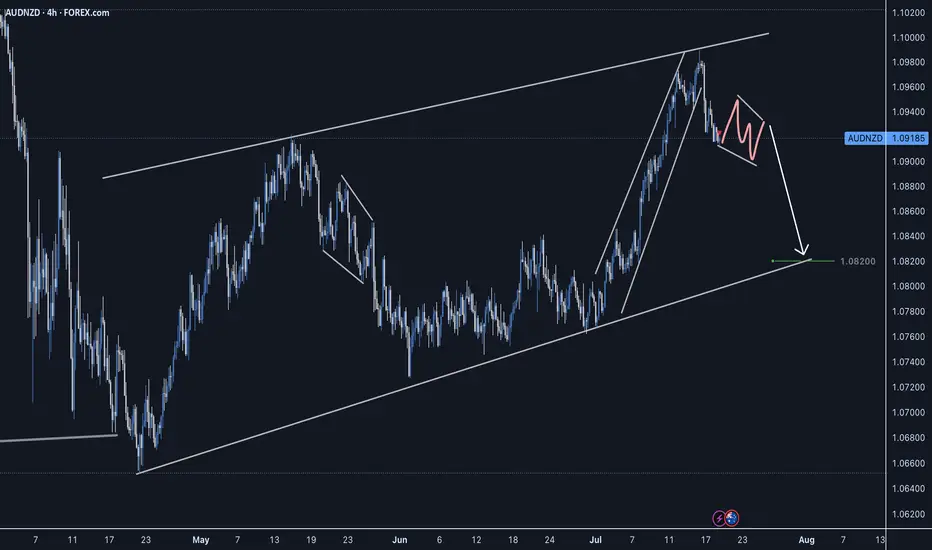
AUDNZD Short Setup - CAB EntrySellers stepping in, strong reversal impulse. Waiting for a slight correction before taking a short entry on the LTF.
Good Luck
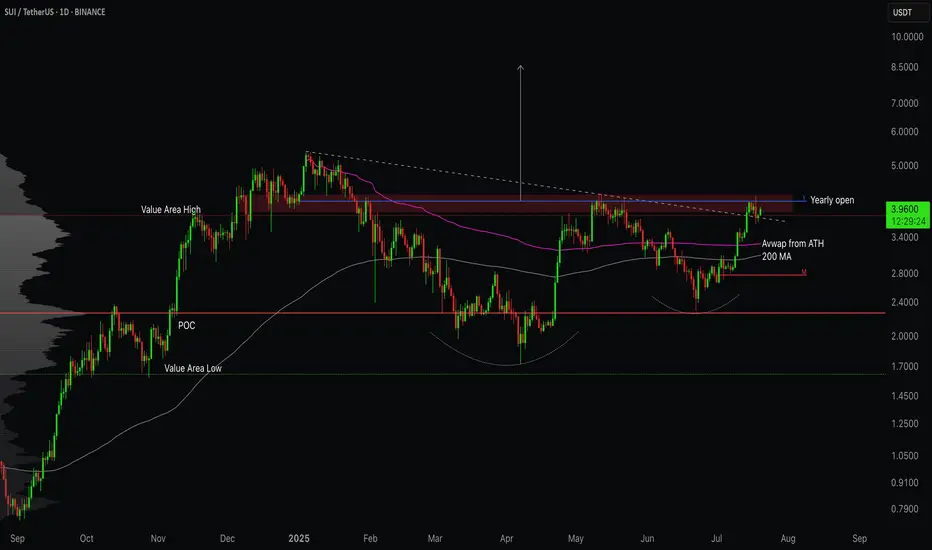
SUI/USDT - Testing the Top of ValueSUI is back in focus as price pushes into a critical zone of resistance that has capped previous rallies. With key moving averages reclaimed and volume shifting in favour of bulls, the question now is simple - can it break free, or is this another trap before rotation lower?
Let’s break down the current structure and what comes next!
SUI is trading at a critical inflection point after staging a strong recovery off the March and April lows . The broader context shows a market transitioning from a bearish phase into a more constructive accumulation structure. The recent price action has been guided largely by reclaiming key areas of previous acceptance and value.
However, sellers are still active at the upper bounds of this range. The next few sessions will determine whether SUI transitions into full breakout mode or requires further consolidation below resistance.
⦿ Volume Profile
The Value Area Low (VAL) is anchored around $1.62 . This area marked the exhaustion point for sellers, triggering the current recovery leg.
The Point of Control (POC), which represents the highest traded volume zone, sits at approximately $2.27 . This zone acted as a magnet for price through May and June and is now firmly reclaimed, reinforcing its importance as a structural support.
The Value Area High (VAH) comes in at $3.82 . Price has recently reclaimed this level, which suggests buyers have shifted control of the auction. Acceptance above the VAH often implies that the previous range is no longer valid and a new range expansion could be underway.
⦿ Key Technical Insights
Several technical levels align with this recovery. The 200-day MA and the anchored VWAP from the all-time high converge between $3.00 and $3.50. This area has been successfully reclaimed and held, adding further conviction to the bullish case.
Above current prices, $4.12 represents the Yearly Open and a clear horizontal supply level. The market has shown hesitation here, as expected. The price action suggests sellers are attempting to defend this zone, but the overall structure remains bullish as long as higher lows are maintained.
Support levels to monitor include $3.82, the Value Area High, and $3.50, where both the VWAP and the 200-day Moving Average provide dynamic support. Below that, the POC at $2.27 remains a crucial level of last defense for bulls.
⦿ Market Structure
Structurally, the market has transitioned from a downtrend into a rounded bottom formation, which typically precedes more sustained uptrends. The higher low structure since the March lows confirms this shift. The recent push above both the POC and VAH further validates the strength of this reversal.
Volume has supported this breakout. We saw clear expansion through the $3.00 handle, suggesting conviction among buyers. The visible consolidation just below $4.12 reflects natural supply pressure but not yet evidence of distribution.
⦿ Scenarios to Consider
1. Bullish Scenario:
If buyers manage to establish acceptance above $4.12, particularly with daily closes through this level, the path higher opens cleanly. The low-volume node between $4.12 and approximately $5.00 suggests limited resistance in this zone. Price could expand swiftly toward $5.36 to $6.00 as a first target.
2. Healthy Pullback Scenario:
Should price reject the $4.12 zone, a pullback toward $3.82 or even $3.50 would be healthy and expected. As long as the structure of higher lows remains intact and price holds above the reclaimed POC at $2.27, this pullback would likely serve as a base for the next leg higher.
3. Bearish Breakdown Scenario:
A sustained loss of $3.00 would be the first real warning sign for bulls. Breaking below the POC at $2.27 would suggest a failed breakout and could see the price cycle back toward the lower end of the volume profile, targeting $2.26 or even the Value Area Low at $1.62. However, given current strength, this scenario looks less likely unless broader market sentiment shifts.
I’m primarily focused on bullish scenarios or potential pullbacks, as the current market looks stronger compared to a few months ago. I believe we’re likely to see some decent long opportunities moving forward.
Let me know your thoughts in the comments! 👇
⚠️ Disclaimer
As always, this post is purely for educational purposes. I am not a financial advisor, and nothing here should be taken as financial advice. Always consult your financial advisor before making any investment or trading decisions. Or at the very least, consult your cat. 🐱
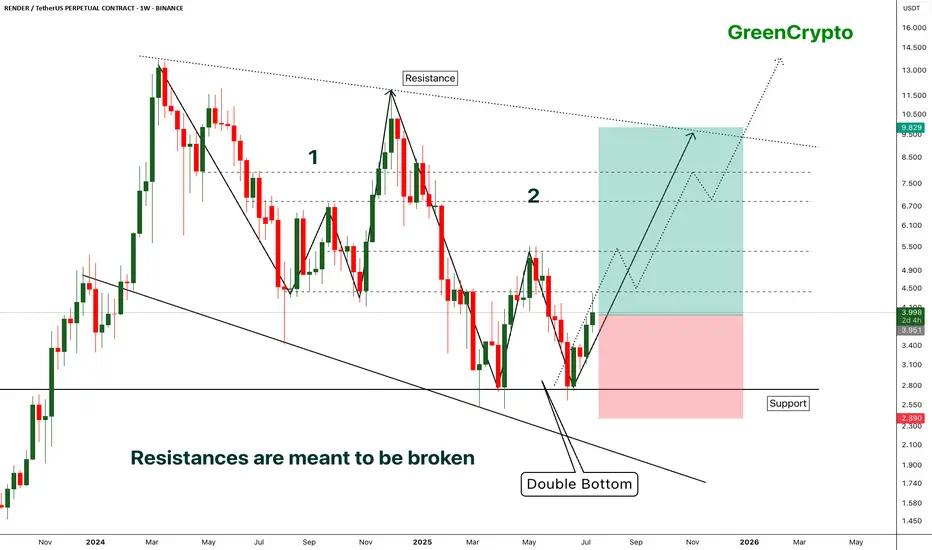
RENDER - [Double bottom] - Resistances are meant to be broken- RENDER has successfully bounced back from the support by forming the double bottom pattern.
- Double bottom pattern is bullish pattern, when it forms at the strong support it becomes extremely bullish. this is one of such scenario.
- Im expecting some minor resistance at the local resistance around 4.3
- A successfull breakout this local resistance will push the price further high.
Entry Price: 3.941
Stop Loss: 2.378
TP1: 4.413
TP2: 5.350
TP3: 6.887
TP4: 8.092
TP5: 9.810
Max Leverage 5x.
Don't forget to keep stoploss.
Support us by Liking and following.
Thanks and Cheers!
GreenCrypto
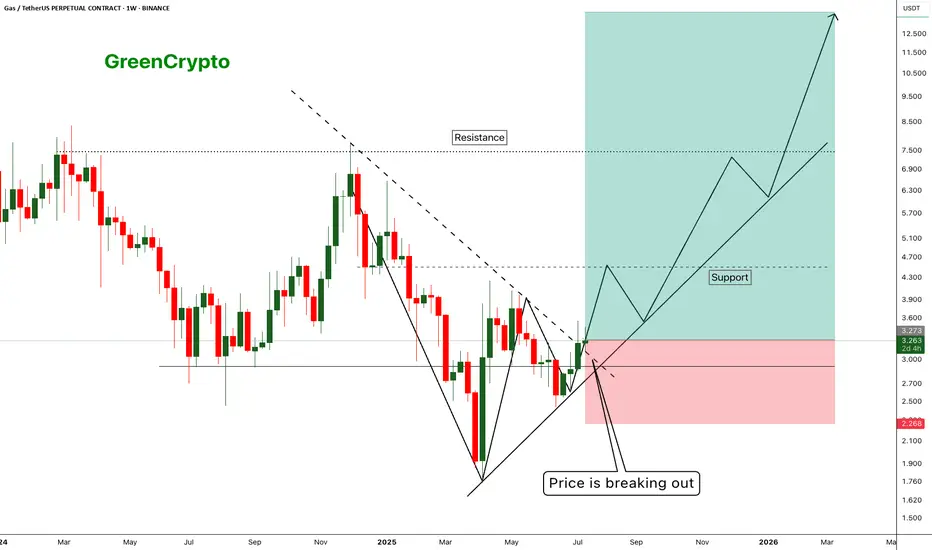
GAS - Huge Risk:Reward Trade 1:10 - Is there any Gas Left ?- Gas has finally managed to breakout from the resistance trendline and now trading just above the resistance
- I'm expecting this trend to continue along the support line shown in the chart.
Entry Price: 3.281
Stop Loss: 2.271
TP1: 3.944
TP2: 4.589
TP3: 6.775
TP4: 8.412
TP5: 13.512
Max Leverage 5x.
Don't forget to keep stoploss.
Support us by Liking and following.
Thanks and Cheers!
GreenCrypto
How To Trade A Bullish 2618 Setup on the GER40A walkthrough of the 2618 Trading Strategy which is a secondary or more conservative way to enter a double top/bottom. In this case, due to the overall directional analysis of the Dax, this also might be a good opportunity to hop on a pullback for a larger bullish trend continuation trade.
2618 RULES
Step 1 - Look for double top or double bottom.
Step 2 - Wait for violation of peak.
Step 3 - Look for pullback into a minimum 61.8 Fibonacci retracement.
Hope you guys have a great week of trading and remember to let me know which profit target method you think you would go with.
Akil

MARI ShortSince July 2023, Mari has never breached and closed below SMA10 on monthly timeframe.
If it breaches it and closes below 588, the downfall will be sharp.
Its first stop would be 519 and then 446 and 415 can also be on cards.
Sorry for Mari lovers but it can become a harsh reality.
However, 415 to 446 can be an ideal time for accumulation for long term investment purpose.
its not a buy / sell call, just my personal opinion.

Double Bottom: ready for Takeoff???A broad double bottom has formed. The price has moved above the 200-day moving average for the first time in a long while. I expect a small pullback before the breakout.

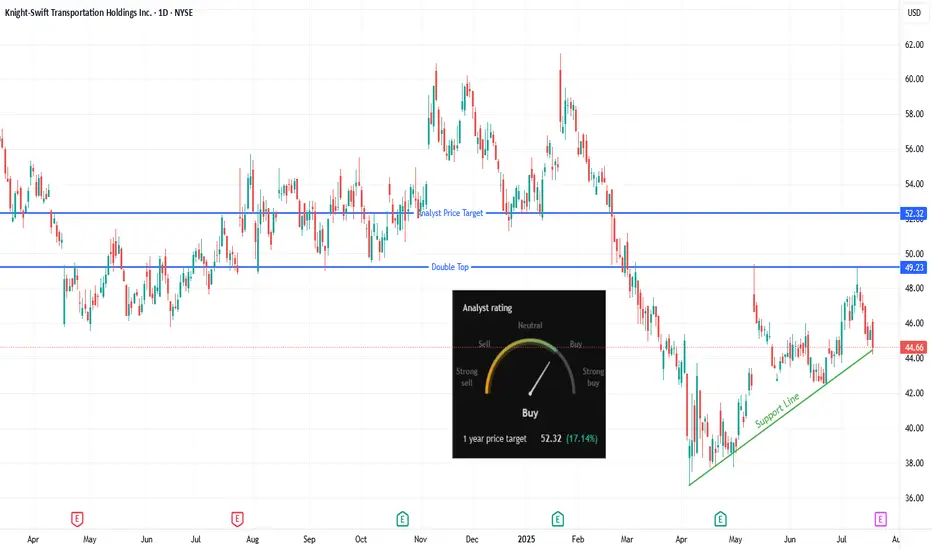
Can KNX Challenge Resistance with Analyst Support?Trade Summary 📝
Setup: KNX building higher lows above rising support; testing multi-month resistance zone.
Entry: Watching for long entry on a break above $46.26.
Stop-loss: Below $44.20 (just under trendline support).
Targets: $49 (near double top resistance), $52.32 (analyst price target).
Risk/Reward: Attractive with defined risk and upside to multiple levels.
Technical Rationale 🔍
Rising trendline support shows bulls steadily defending higher.
Price compressing just below a prior pivot/high—breakout could spark new momentum.
Double top at $49 offers a logical first target; further room if bulls push to analyst target at $52.
Catalysts & Context 🚦
Analyst 1-year price target sits at $52.32 (+17%), with a “Buy” consensus rating.
Trucking/transport sector showing signs of rotation after long weakness.
Upcoming earnings and macro data could act as catalysts for a move.
Trade Management Plan 📈
Entry: On confirmed break and close above $46.26.
Stop-loss: Just below $44.20 support.
Scaling: Trim at $49 (double top area); hold runners for $52.32 if momentum continues.
What’s your move on KNX?
🔼 Bullish—Breakout incoming
🔽 Bearish—Resistance will hold
🔄 Waiting for confirmation
*** Follow us now to ensure you don't miss the next big setup ***
Disclaimer ⚠️: Not financial advice. Trade at your own risk and always use stops.
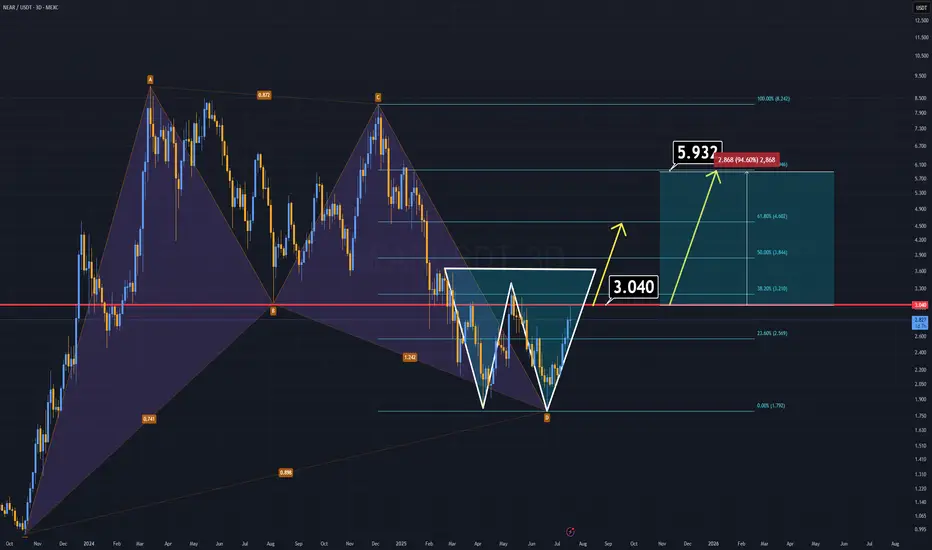
NEAR ANALYSIS (3D)NEAR Protocol has formed two strong bullish patterns and looks ready to climb, especially with the highly anticipated altseason on the horizon.
🔹 A harmonic structure from the previous cycle remains intact.
🔹 A double bottom formation is now clearly developing.
If NEAR manages to close a daily candle above the $3 level, we could see the price double in the short term.
On the fundamental side, NEAR is preparing for a vote to reduce its inflation rate. If the proposal passes, the circulating supply will decrease, potentially triggering a strong bullish run. As a leading AI-focused project, NEAR could spearhead the next wave of AI-related gains in the market.
(Read here for details):
www.near.org
All technical and fundamental signs point upward.
Thanks for reading.
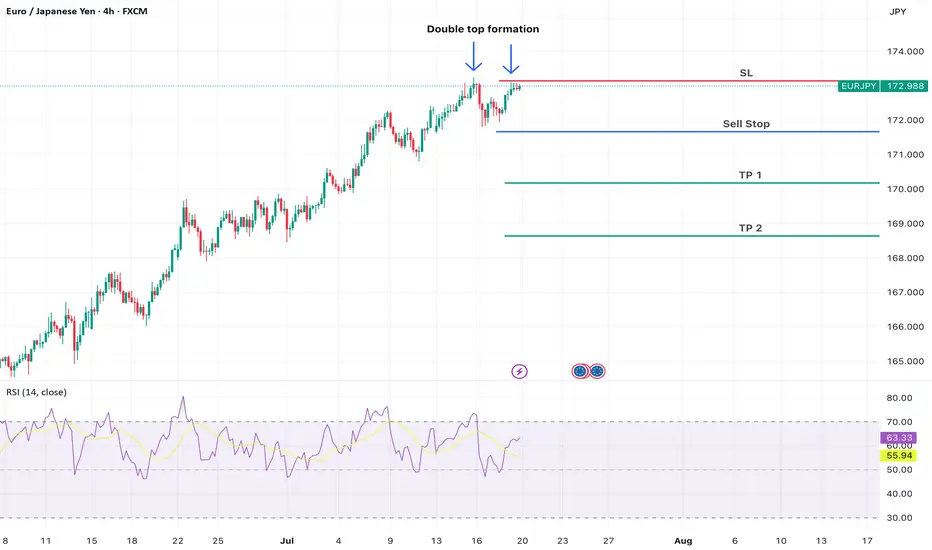
EUR/JPY – Double Top with RSI Divergence (Bearish Setup)Technical Analysis (Short Trade Idea)
EUR/JPY is forming a textbook double top pattern with notable bearish signals:
First top: 173.242
S econd top: 173.111 (lower high, indicating weakening bullish pressure)
Neckline: 171.650 – key support level, potential breakdown trigger
RSI divergence: Bearish divergence observed as RSI prints lower highs while price forms nearly equal tops, signaling momentum loss
This structure suggests a potential reversal from recent highs. A short opportunity may arise if price breaks below the neckline at 171.650 with confirmation.
Trade Setup
Sell Stop: 171.650
Stop Loss: 173.148
Take Profit 1: 170.180
Take Profit 2: 168.642
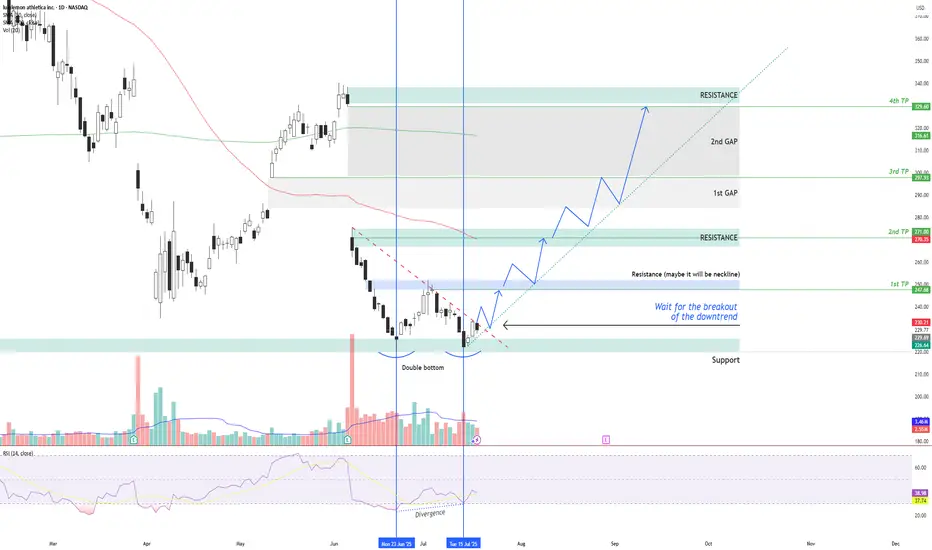
LULU – Double Bottom + RSI Divergence: Multi-Target Setup After LULU NASDAQ:LULU is showing signs of a potential bullish reversal after forming a double bottom structure around the $220 support zone , along with a bullish divergence on the RSI indicator.
Two vertical lines highlight the divergence: while price made a lower low, RSI formed a higher low – indicating a possible momentum shift in favor of buyers.
Currently, price is moving just below a descending trendline, which has been acting as dynamic resistance. The first condition for a long setup is a confirmed breakout above this trendline followed by a successful retest. If that happens, an entry can be considered .
📌 Entry Plan:
Entry: After a breakout and retest of the descending trendline.
1st TP: ~$247 — This level coincides with a local resistance zone, which may act as a neckline of the double bottom.
If price breaks above $247 and retests, it confirms bullish continuation.
📈 Target Structure:
2nd TP: ~$271 — next major resistance zone.
3rd TP: ~$297 — aligns with the first major gap zone.
4th TP: ~$329 — final gap resistance from previous sell-off levels.
This structure allows for scaling into the trade in stages — each breakout and retest offers a new confirmation and extension to the next target zone.
Volume analysis, price action, and RSI momentum all support the probability of a trend reversal — but confirmation is key.
Not financial advice. Always conduct your own research and risk management.