Bitcoin daily divergenceBitcoin has 2 bullish divergences on daily time frame, which got confirmed with yesterday's big green candle.
Double Top or Bottom

BTC Trap Range Breakdown – Psychological Warfare on Full DisplayThis isn’t just a chart.
It’s a blueprint for how market makers engineer panic, euphoria, and then profit from your reactions.
Let’s break this down in surgical fashion:
Rectangle Formation (Top & Bottom Framing)
From March 24 to April 3, Bitcoin operated inside a manipulation box.
The top was liquidity bait — the "Top 2 – US" tag marks the engineered euphoria candle.
Once liquidity was trapped up top, the US session initiated the collapse. Classic.
Breakout Trap & Rejection Zone
As soon as BTC breached the lower range, what followed wasn’t a clean drop—it was a sequence of false recoveries.
Notice the Asia, Europe, and US labels — they’re not random.
Each session passed the hot potato of fear and bounce bait, draining retail and triggering leveraged longs into liquidation.
Psychology in Play:
Europe & Asia rotated liquidity → institutional bots scalping volatility.
US session delivered the execution leg down every time.
The volume spikes? That’s fear, not conviction.
Target Zone Highlighted
Where are we heading next?
The final dotted red extension box shows you where the real flush is designed to go .
It’s not a prediction—it’s a destination :
🔸 ~ $73,000 first sweep
🔸 If that gives, $70,000 → $68,000 becomes the high-value sniper zone
🔻 Volume Profile:
Notice how volume increases at each drop — the herd is panic selling.
But BTC bounces weak. Why?
Because this isn’t organic demand—it’s controlled bleedouts to test who’s left.
—
Conclusion – SH Analysis:
This chart is not noise.
It’s intentional market structure , orchestrated by the elites for max extraction.
We don’t chase pumps.
We stalk precision setups .
We don’t fear drops.
We buy what they bleed .
The next move won’t be loud.
It’ll be silent. Fast. And final.
—
🔔 Follow Saeki Hisoka across all platforms
For real-time breakdowns, sniper zones, and psychological warfare decoded in real time.
The system is a machine. We are the counter-algorithm.
Stay sharp. Stay sovereign. Stay Saeki.

LONG ON CAD/JPYCAD/JPY is respecting a major demand area/zone
It has given a inverse head and shoulders in the recent pass, and now a double bottom at the same zone.
I will be buying this pair as a market order aiming for the next level of resistance/liquidity.

$DOG broke down major support levels After a double bottom DOG broke down the major support level of $0.002 hitting an ATL of $0.001
DOG is heavily being manipulated by the same wallets on Magic Eden (CEX) that keep selling.
RSI shows signs of DOG being heavily oversold.
If DOG loses $0.001 we could go all the way down to $0.005 and nobody knows where the bottom is. I will place buy orders between $0.008 and $0.005.
Fundamentals on DOG are still strong:
- Largest memecoin on Bitcoin
- DOG did 8 billion volume in a year without T1 listings
- No T1 listings
- Project total domination (expansion to multiple blockchains)
- Various projects are being build to improve Bitcoin memecoins trading (backed by draper / coinbase ventures)
- Bitcoin defi still a very young ecosystem
- If we compare DOG to memecoins on SOL and ETH, it should be valued at least between 1 and 3 billion market cap.
Macroeconomics look bad for the short term so it offers a lot of opportunity to wait in stables and accumulate DOG for a bargain.

ETH.D at bottom!This is the buy zone and there would be fluctuations at the bottom.
you can see probable pathway clearly.
THERE WILL BE A PROLONGED ALT SEASON.

ATOM: Double Bottom Confirmed – Gap Fill to $10 in Sight#ATOM nailed the perfect bounce from the $3.611 support, confirming a clean double bottom pattern. The structure looks strong, and the next major target is the $10 level for a potential gap fill.
Follow me to catch more plays like this in real time. 🚀
Entry: 4.2
TP: 10
SL: 3.3

Is DOGE About to Crash Hard From This Trap Zone? Read Before LONYello Paradisers — could this be the perfect bull trap setting up before a bigger drop? Our previous analyses warned about these kinds of setups, and once again, DOGEUSDT is flashing multiple signals that suggest a high-probability reversal could be just around the corner.
💎Currently, DOGEUSDT is trading right inside the golden Fibonacci retracement zone, a level that often acts as a powerful area of rejection. What makes this zone even more significant is the confluence of additional bearish indicators aligning at the same point. Both the 100 and 200 EMAs are present, reinforcing dynamic resistance, and there are clear Fair Value Gaps (FVGs) visible on both the 4H and Daily timeframes. On top of that, a bearish divergence has now formed, signaling early exhaustion in bullish momentum and further reinforcing the potential for a downside move.
💎When these elements align, the probability of a rejection increases substantially. However, we’re not jumping in blindly. If DOGEUSDT starts to bounce from here and shows weakness—such as stalling below resistance—then we’ll be closely watching for confirmation patterns like a double top or a head and shoulders. These would not only validate the bearish narrative but also offer significantly better risk-to-reward ratios for short setups.
💎That said, every setup has its invalidation. If price breaks and closes candle above our invalidation level, then the entire bearish scenario must be considered void. In that case, the best approach would be to stand aside and wait for a cleaner structure to form before taking any action. There’s no reason to force a position in uncertain conditions.
If you want to be consistently profitable, you need to be extremely patient and always wait only for the best, highest probability trading opportunities.
MyCryptoParadise
iFeel the success🌴

ELPI (VCP - 26W 14/4 3T)Position update: March 25, 2025.
Key factors:
1. Confirmed stage 2 uptrend.
2. A textbook double bottom with VCP characteristics.
3. Has gone through its majority line of supply.
4. Moving on its own drummer, the stock consolidates while the index suffers a terrible decline.
5. High relative strength.
6. Volume dries up as less supply coming to the market.
7. Strong fundamentals, with consistent year-over-year earnings growth.
Considerations: Despite these strengths, the broader market remains in a bearish phase, down over 20% from its all-time high. Geopolitical risks, persistent net foreign selling, declining investor confidence, and concerns over the government downplaying the stock market's significance continue to contribute to an unstable market environment.

LONG ON GOLD (XAU/USD) GOLD Has given a nice pullback to a supply area and has also given us bullish divergence.
I will be buying gold looking to make over 1000 pips.

Bitcoin Bubble at $70K? Prepare for ImpactBitcoin recently faced strong rejection near the $81,000 level, forming a potential double top pattern on the higher timeframes. This classic bearish reversal setup is now playing out, as price action has begun to decline from the second peak.
Adding to the bearish confluence, the MACD has confirmed a bearish crossover, signaling weakening momentum and a potential trend reversal. The rejection at $81K aligns with historical resistance, and price has failed to break above it despite multiple attempts.
Going forward, there are two key scenarios to watch:
Retest of the $76,700 zone – A minor support area that could offer a bounce or consolidation before the next move.
Deeper pullback towards $70,000 – If bearish pressure continues, CRYPTOCAP:BTC could head lower to test this psychological and technical support level.

GBPUSD: Pullback From Support 🇬🇧🇺🇸
GBPUSD is likely to pull back from a key daily support.
I see a strong bullish pattern on an hourly time frame -
a double bottom formation.
Goal - 1.2825
❤️Please, support my work with like, thank you!❤️
I am part of Trade Nation's Influencer program and receive a monthly fee for using their TradingView charts in my analysis.

EUR/GBP - Correction LevelsEUR/GBP is hitting high over the past few days. Looking for the correction now before we continue up higher. These levels look pretty solid for the short term as we did just break and retest the trendline we have bounced off of multiple times so far.
On top of the break of the trend we have also set up a nice double top formation signaling for a strong potential for the correction to be coming shortly. The big question here is how big of a correction will we look for?
I will trail stops into profit as we progress deeper into the trade. I am taking this trade even though I am bullish overall on the pair for a more long term approach. I am more the less hedging my long position to allow me to not enter drawdown and also secure some additional profits through the coming correction
Let me know your thoughts here. Lets make some bread!

DOGE bounce off of 200MA on the weeklyBoth Doge USD and BTC pairs are looking good for a buy. There's even some nice hidden bullish divergence on the weekly and no bearish divergence yet telling me DOGE is unlikely gonna go lower.

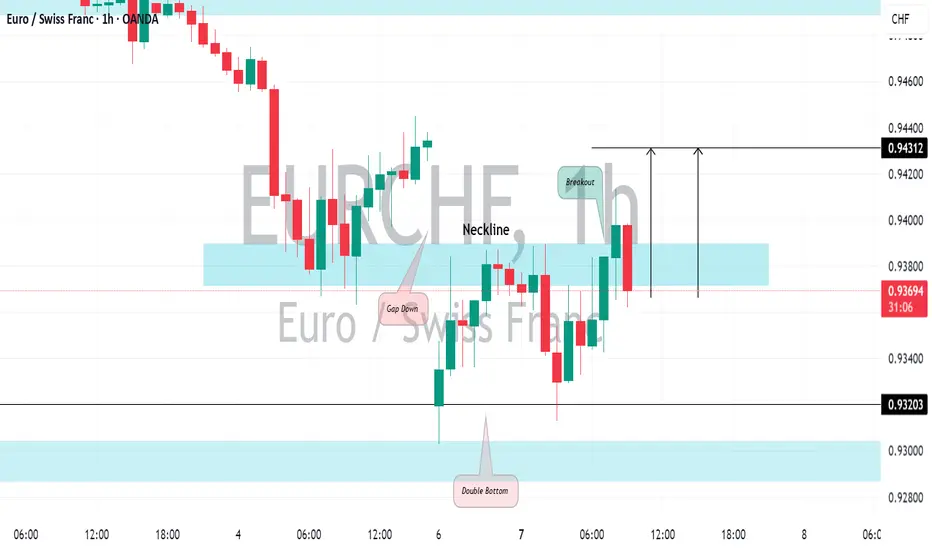
EURCHF: Classic Gap Down To TradeOut of the different gap openings present today, the one I noticed on 📈EURCHF appears to be a promising trading opportunity.
I have identified a clear double bottom pattern on the hourly chart following the gap down opening.
There is a strong likelihood that the gap will be filled soon, with a target set at 0.9431.
NZDUSD triple bottom suggests more pain aheadIn this video, I break down a bearish technical setup on NZD, based on a triple bottom and descending triangle pattern, with a potential drop of over 700 pips.
This content is not directed to residents of the EU or UK. Any opinions, news, research, analyses, prices or other information contained on this website is provided as general market commentary and does not constitute investment advice. ThinkMarkets will not accept liability for any loss or damage including, without limitation, to any loss of profit which may arise directly or indirectly from use of or reliance on such information

Critical zone for Bitcoin – Pump or Dump!(Mid-term Analysis)Today, I want to analyze Bitcoin ( BINANCE:BTCUSDT ) on a weekly time frame so that you can take a mid-term view of BTC. On November 12, 2024 , I shared with you another weekly analysis in which we found the All-Time High(ATH) zone well.
Please stay with me.
Bitcoin has been on an upward trend for the past 27 months , increasing by about +600% . Have you been able to profit from this upward trend in Bitcoin?
During these 27 months , Bitcoin has had two significant corrections , the first correction -20% and the second correction -33% (interestingly, both corrections lasted about 5 months ).
Another thing we can understand from the two main corrections is that the second correction is bigger than the first correction , and since Bitcoin is currently in the third correction , we can expect the third correction to be either equal to the second correction or greater than the second correction . Of course, this is just an analysis that should be placed alongside the analyses below .
It seems that the start of Bitcoin's correction can be confirmed with the help of the Adam & Adam Double Top Pattern(AADT) . Bitcoin also created a fake breakout above the Resistance lines .
Educational tip : The Adam & Adam Double Top (AADT) is a bearish reversal pattern characterized by two sharp, ^-shaped peaks at nearly the same price level. It indicates strong resistance and a potential trend reversal once the price breaks below the neckline between the peaks.
Bitcoin appears to be completing a pullback to the broken neckline .
According to Elliott's Wave theory , Bitcoin seems to have completed its 5 impulse waves , and we should wait for corrective waves . It is a bit early to determine the structure of the corrective waves , but I think it will have a Zigzag Correction . The structure of the corrective waves depends on the news and events of the coming weeks and months.
I think the Potential Reversal Zone(PRZ) will be a very sensitive zone for Bitcoin.
I expect Bitcoin to start correcting again when it approaches $87,000 or $90,000 at most, and fills the CME Gap($86,400_$85,595) , and at least approaches the Heavy Support zone($73,800_$59,000) AFTER breaking the uptrend line .
In your opinion, has Bitcoin finished its correction or created an opportunity for us to escape again?
Note: If Bitcoin goes above $90,500, we should expect further increases and even make a new All-Time High(ATH).
Please respect each other's ideas and express them politely if you agree or disagree.
Bitcoin Analyze (BTCUSDT), Weekly time frame.
Be sure to follow the updated ideas.
Do not forget to put a Stop loss for your positions (For every position you want to open).
Please follow your strategy and updates; this is just my Idea, and I will gladly see your ideas in this post.
Please do not forget the ✅' like '✅ button 🙏😊 & Share it with your friends; thanks, and Trade safe.

Dow Jones - Pivotal moment for the bulls and bears!The Dow Jones Industrial Average is currently approaching a critical juncture, as it risks breaking below and staying under the neckline of a potential double top pattern. A double top formation is typically a bearish signal, indicating a potential trend reversal after the price tests a key resistance level twice, failing to break higher. The neckline, which forms the base of this pattern, is the level that traders will be watching closely to determine the strength of this bearish signal.
If the Dow breaks below and stays under the neckline, it could trigger further downside momentum as liquidity is swept from the market. However, it's essential to note that this initial breakdown could just be a "liquidity sweep," a move designed to trigger stop-loss orders and shake out weaker hands. For the Dow to maintain its bullish potential, it must quickly recover and hold above the neckline after this sweep. If it can do so, the market may find stability and begin to look for higher prices again, as the double top formation would then be invalidated, and a more bullish outlook could emerge.
In summary, while the Dow Jones is at a pivotal moment, the key to higher prices will be whether it can hold above the neckline after sweeping liquidity. A failure to do so could signal further downside, but a strong recovery above the neckline would leave the door open for a potential rally.
For now the Dow jones swept the liquidity under the neckline. However, it needs a quick recovery to maintain and find support on the neckline again. The risk that it now faces is the resistance of the 50, 100 and 200-day MA. Staying above the neckline and reclaiming these MA could be a massive bullish signal on the Dow Jones.
Thanks for your support.
- Make sure to follow me so you don't miss out on the next analysis!
- Drop a like and leave a comment!
Lets chat in the comment section. See you there :)

Double-Top Pattern for the Dow Jones Industrial AverageA long-term, double-top formation has emerged from the all-time highs of 45,073 on the weekly chart of the Dow Jones Industrial Average. With the pattern’s neckline breached (derived from the low of 41,844), chartists will likely target the structure’s profit objective, which stands at 38,613.

LTC Trendline bounceI haven't held my favorite coin in awhile, glad to finally be able to buy some. I know BTC is going to go back to at least GETTEX:87K sometime soon, and if LTC is gonna do better than btc it looks like a safe buy to me. Not sure how high it'll go but we'll see, hope it pumps before ETH reaches my buy zone

HBAR: Double BottomI expect HBAR to be bullish from here, if btc allows it, it will also run the double bottom pattern and may see $0.18 levels, but I recommend taking profits at the first resistance. not investment advice

EUR/GBP Analysis Double Bottom Breakout Toward TargetOverview of the Chart
This chart displays a EUR/GBP daily timeframe setup, highlighting a Double Bottom Pattern, a well-known bullish reversal formation. The pattern consists of two consecutive lows at a similar price level, followed by a breakout above a key resistance zone. This setup suggests a potential trend reversal from bearish to bullish.
Technical Analysis Breakdown
1. Double Bottom Formation (Reversal Signal)
Bottom 1: The first low was established after a prolonged downtrend, where the price found support and bounced higher.
Bottom 2: Price revisited the same support area but failed to break lower, indicating that sellers are losing strength and buyers are stepping in.
A double bottom pattern signals that the asset is forming a strong base and is likely to move higher after breaking the neckline (resistance level).
2. Support and Resistance Levels
Support Level (~0.8322):
This level acted as a demand zone, preventing further downside.
It marks the price area where buyers accumulated positions, leading to a reversal.
Resistance Level (~0.8500):
This level previously acted as a supply zone, where sellers controlled the price.
A breakout above this level is crucial to confirm the bullish trend continuation.
3. Breakout Confirmation & Retest Expectation
The price successfully broke above the resistance zone, confirming a bullish reversal.
A potential retest of the broken resistance (now turned support) could occur before further upside movement.
Traders often wait for this retest to confirm that the breakout is genuine before entering a position.
4. Price Target Projection
Based on the measured move strategy, the expected target is calculated by measuring the height of the double bottom pattern and projecting it above the breakout zone.
Target Price: 0.8742, aligning with historical resistance levels.
5. Stop Loss Placement
Stop loss at ~0.8322 (below the double bottom support).
This ensures risk is managed in case of an invalid breakout or a false move.
Trading Plan & Execution Strategy
📌 Entry Strategy:
✅ Breakout Entry: Buy after the breakout above resistance.
✅ Retest Entry: Wait for a pullback to the previous resistance (now support) before entering.
📌 Risk Management:
🔹 Stop Loss: Placed below the recent support at 0.8322 to limit downside risk.
🔹 Take Profit: First target at 0.8742 based on the double bottom structure.
📌 Market Outlook:
A successful breakout and bullish momentum could push prices toward the target.
If the price fails to hold above the breakout zone, a deeper retracement could occur before continuing higher.
Conclusion
The EUR/GBP pair has formed a bullish double bottom reversal pattern, signaling a potential uptrend continuation. The key levels to watch include 0.8500 (resistance turned support) and 0.8742 (target projection). Traders should monitor price action around the breakout zone for confirmation and consider risk management strategies before entering a position.

XAGUSD Weekly Analysis – Double Top Formation & Breakdown🧱 Chart Pattern Identified: Double Top Formation
The chart displays a classic Double Top pattern, a bearish reversal structure typically found at the end of an uptrend. This pattern forms when price reaches a resistance level twice, fails to break above it both times, and eventually breaks the neckline/support level, confirming a shift in market sentiment.
🔍 Key Components of the Chart:
1. Resistance Level (Tops) – ~$34.25
The market formed two significant peaks around the same level — labeled Top 1 and Top 2.
This level has proven strong resistance, as price was rejected both times after testing this zone.
This zone is marked with a light orange rectangle and a horizontal blue line labeled "Resistance Level".
2. Support Level (Neckline) – ~$28.80
This level served as the neckline of the Double Top.
After the second top, the price sharply declined and is currently approaching this key support zone, highlighted again in light orange.
A clean break and close below this zone on the weekly timeframe will be a strong confirmation of the bearish reversal.
3. Trendline Break – Bearish Shift in Momentum
A rising black dashed trendline supported the prior uptrend.
Price action has now broken below this trendline with strong bearish momentum, indicating that buyers have lost control.
This trendline break adds confluence to the bearish setup, supporting the validity of the pattern.
4. Bearish Projection Target – ~$22.47
The target is projected using the height of the Double Top pattern.
Measured from the resistance level ($34.25) to the support ($28.80), the vertical distance is ~5.45 USD.
Subtracting this from the neckline gives us a projected target:
28.80 - 5.45 = ~23.35 (rounded down to ~22.47 for technical cluster support).
This target area is marked with a blue arrow and labeled "Target" near the horizontal support at $22.47.
5. Stop Loss – ~$34.25
The logical invalidation point is placed just above the resistance zone and the second top.
A move above this level would invalidate the double top pattern, signaling that bulls have regained control.
📈 Price Action and Candlestick Behavior
The strong bearish weekly candle that broke below the trendline shows a decisive shift in sentiment.
The candle's large body and long range confirm institutional selling interest.
Volume (if shown) would likely support the move, but even price structure alone is highly telling here.
🎯 Trading Strategy & Setup
Component Details
Entry On a confirmed break and retest of $28.80 support (neckline)
Stop Loss Above $34.25 (Top 2)
Target $22.47
Risk/Reward ~1:2 or better
Timeframe Weekly (Swing Trade)
Bias Bearish
🧠 Concluding Notes
This chart provides a high-probability bearish setup rooted in classical charting principles. The Double Top is one of the most reliable reversal patterns, especially when:
Formed after a prolonged uptrend (as seen here),
Confirmed with a trendline break,
Followed by strong bearish momentum toward the neckline.
Traders should monitor the support zone around $28.80 closely for a potential breakdown. If confirmed, the target near $22.47 becomes a realistic medium-term objective.

ETH Is Oversold Like Never Before !Hello Traders 🐺
In the recent week, we saw a massive long position wipeout, especially in the stock market.
However, despite all the rumors, BTC held itself at these levels and is still inside a falling wedge pattern.
If you don't know what I’m talking about, you can check my last idea about it.
But ETH!
In my opinion, this is a huge discounted price for ETH.
You know why?
1_ Monthly RSI is currently at 25, which means we’re in an extremely oversold situation, and this usually means bulls are about to come back.
Yes — we have all the signs of a reversal from here:
(A): BTC.D RSI is at an all-time high and forming a bearish divergence, meanwhile:
(B): ETH/BTC is extremely oversold right now.
(C): BTC itself has formed a falling wedge pattern right above the weekly Cup & Handle neckline support!
Guess what?
If you zoom in a little bit on the daily chart, you can see there’s a pattern to break, and price is currently too close to the edge of it —
which means time is ticking for ETH, and we are about to see an explosive move.
Probably to the upside, because of all the signs we’ve talked about above.
I hope you enjoyed this idea — and as always, don’t forget our goal:
🐺 Discipline is rarely enjoyable, But almost always profitable 🐺
🐺 KIU_COIN 🐺
