How to Identify Double Top Formation - A Long-Haul Bear?How to identify double top formation?
Is the US market still forming this double top formation, or has the pattern already completed, signaling a deeper correction to come?
In this discussion, we will focus on the latter question: whether this bear is going to be a long-haul bear.
3 parts of today tutorial:
1. How to Identify Double Top Formation is completed technically?
2. How to cross reference to its related markets?
3. How do the fundamental developments confirm these technical studies?
E-mini Dow Jones Index Futures & Options
Ticker: YM
Minimum fluctuation:
1.00 index point = $5.00
Micro E-mini Dow Jones Index Futures
Ticker: MYM
Minimum fluctuation:
1.0 index points = $0.50
Disclaimer:
• What presented here is not a recommendation, please consult your licensed broker.
• Our mission is to create lateral thinking skills for every investor and trader, knowing when to take a calculated risk with market uncertainty and a bolder risk when opportunity arises.
CME Real-time Market Data help identify trading set-ups in real-time and express my market views. If you have futures in your trading portfolio, you can check out on CME Group data plans available that suit your trading needs www.tradingview.com
Trading the Micro: www.cmegroup.com
Double Top or Bottom

GBPUSD: Potential Pullback Trade Explained 🇬🇧🇺🇸
GBPUSD closed this week, respecting a key daily horizontal support cluster.
Analyzing the intraday price action, I spotted a nice double bottom pattern
on an hourly time frame.
To buy the pair with a confirmation after the market opening,
I suggest waiting for a bullish breakout of its neckline.
An hourly candle close above will confirm a violation.
A bullish move will be expected at least to 1.296 level then.
❤️Please, support my work with like, thank you!❤️
I am part of Trade Nation's Influencer program and receive a monthly fee for using their TradingView charts in my analysis.

Detailed Analysis of Silver (XAG/USD) – Double Top BreakoutThe chart represents a technical analysis of Silver (XAG/USD) on the daily timeframe (1D). A Double Top pattern, one of the most reliable bearish reversal formations, is developing. This signals a potential downtrend, with key price levels and trendlines confirming weakness in bullish momentum. Below is a full breakdown of the pattern, price action, and trading setup.
1️⃣ Pattern Formation: Double Top – Bearish Reversal
A Double Top pattern occurs when the price reaches a resistance level twice, failing to break higher. It indicates a shift from a bullish trend to a bearish one.
🔹 Characteristics of the Double Top in This Chart:
First Peak (Top 1 - Resistance at ~$34.57):
The price made a strong move upward, reaching a high near $34.57.
Selling pressure at this level pushed the price downward, forming a support level near $30 (Neckline).
Pullback & Temporary Support (~$30 Neckline):
Buyers stepped in at the support zone, causing a bounce back towards resistance.
This level acted as strong demand, preventing further decline temporarily.
Second Peak (Top 2 - Rejection at Resistance Again):
Price attempted to break above the previous peak but failed.
This failure to form a higher high confirms the presence of strong sellers.
The second rejection strengthens the resistance level at $34.57, signaling exhaustion in buying momentum.
Break of the Trendline Support (Bearish Shift):
A previously ascending trendline (black dashed line) was providing support for the uptrend.
Price broke below this trendline, indicating a possible trend reversal from bullish to bearish.
2️⃣ Key Technical Levels & Trading Setup
🔸 Resistance Zone (~$34.57 - Stop Loss Area)
This is the major resistance level, tested twice and confirmed as a supply zone.
A move above $34.57 would invalidate the bearish pattern, making this an ideal stop-loss level.
🔹 Support Level / Neckline (~$30 - Breakdown Confirmation)
The neckline acts as a critical level. If the price breaks below $30, the Double Top formation is confirmed.
If the price retests this level from below and rejects (fails to reclaim it as support), it becomes a strong short entry signal.
🔻 Target Price (Projected Move - $23.01)
The target is based on the measured move rule of a Double Top:
Distance from resistance ($34.57) to neckline ($30) ≈ $4.57.
Projecting this same distance downward gives a target of ~$23.01.
This aligns with historical demand zones, increasing the probability of price reaching this level.
3️⃣ Trading Plan: Short Setup Execution
🔽 Short Entry (Breakdown Confirmation Below $30)
Ideal entry point is after the neckline breaks and confirms resistance upon a retest.
A breakdown with strong volume enhances the validity of the setup.
🚨 Stop Loss Placement (Above $34.57 Resistance Level)
Placing a stop above the second peak ($34.57) ensures protection against invalidation.
If price moves back above this level, the pattern fails, indicating a potential return to bullish momentum.
🎯 Target Price ($23.01) – Measured Move Projection
The price target aligns with the pattern structure and historical support levels.
Traders can take partial profits at intermediary levels ($27–$26) before full target realization.
4️⃣ Additional Confirmation Factors – Confluence for Bearish Bias
1️⃣ Momentum Indicators: RSI & MACD Bearish Signals
If RSI (Relative Strength Index) drops below 50, it confirms weakening bullish momentum.
A MACD bearish crossover (signal line crossing below the MACD line) would further validate the downtrend.
2️⃣ Volume Analysis – Breakout Confirmation
A high volume breakout below $30 confirms selling pressure.
Low-volume breakdowns can lead to false breakouts, making volume a crucial factor to watch.
3️⃣ Fundamental Factors – Macro Outlook on Silver (XAG/USD)
Silver prices are influenced by interest rates, inflation, and USD strength.
If USD strengthens, silver could face more selling pressure, aligning with this bearish technical setup.
Any hawkish monetary policy statements could accelerate the downside movement.
5️⃣ Risk Management & Alternative Scenarios
✔️ Ideal Risk-Reward Ratio
Risk: Stop loss at $34.57 (~4.5% above entry)
Reward: Target at $23.01 (~23% move)
Risk-Reward Ratio: ~1:5 (highly favorable for short trades)
⚠️ Bullish Invalidations – When to Avoid the Trade?
If Silver reclaims $34.57 and holds above, the pattern fails.
A false breakout scenario could occur if price breaks below $30 but quickly moves back above.
Watching for bullish divergence on indicators like RSI before entering a short position is recommended.
Final Conclusion: Bearish Bias with Strong Downside Potential
📉 Summary of the Bearish Case:
✔️ Double Top pattern confirms a bearish reversal if the neckline breaks.
✔️ Break of ascending trendline signals increasing seller control.
✔️ Key levels: Stop-loss above $34.57 | Entry below $30 | Target $23.01.
✔️ Additional confluence: RSI, MACD, and volume confirmation strengthen the trade setup.
🚀 If price action aligns with this analysis, this setup presents a high-probability short opportunity.
Would you like any refinements or additional insights? 🔥

DOLLAR INDEX (DXY): Long-Awaited Recover
It looks like Dollar Index is going to pullback
after a test of a significant support cluster on a daily.
A strong bullish imbalance candle that was formed on an hourly
time frame shows a strong buying interest from that zone.
I expect a bullish movement at least to 102.35
❤️Please, support my work with like, thank you!❤️

GBPCAD LONGS! GBPCAD LONGS
(PLEASE WATCH THE FULL VIDEO!)
* gbocad is extremely bullish and NFP is tomorrow
* Price is making higher highs and higher lows

Euro is getting hotA massive double bottom is forming inside the triangle. The upper vortex is working as a downtrend line from 2008. Imagine the break out. It could come at any time. I don't have a position here yet, but if you want to save cash do it in Euros.

PEPE/USDT:FREE SIGNALHello dear friends
Given the price drop we had in the specified support range, a double bottom pattern has formed, indicating the entry of buyers.
Now, given the good support of buyers for the price, we can buy in steps with capital and risk management and move to the specified targets.
*Trade safely with us*

DKNG Update | Second Fractal | Extended TargetsPrice action looks very similar to the '23 Q3 play where we saw a double bottom move taking off from $26 - $49 which is also the ABC move that carried the 3rd impulse wave of the original fractal.
We're still in correction wave 4 and are about to start wave 5 shortly from now to July.
It's possible we could see price action higher than $74 based on the new fractal overlay and with the help of the fib extension.

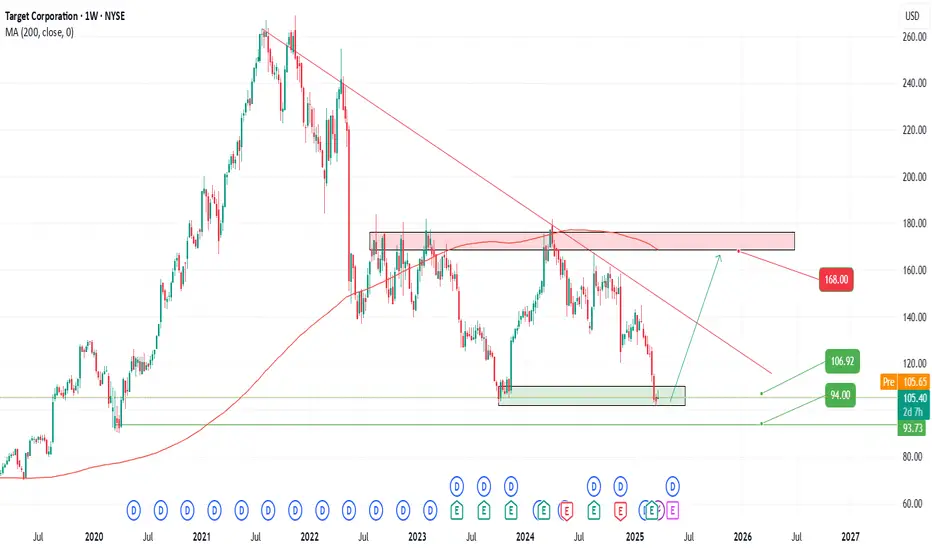
TGT Trade Idea –2025🚨 NYSE:TGT is shaping up with some juicy potential in this current market cycle 📈
🎯 Entry Points (Buy Zones):
1️⃣ $107 – Aggressive entry for early birds
2️⃣ $100 – Solid mid-range level with strong historical support
3️⃣ $94 – Deep dip buy for the patient sniper
💸 Profit Targets:
✅ $141 – First take profit zone
✅ $158 – Stretch target
🚀 $168+ – Blue sky potential if momentum keeps rolling
🧠 Risk Management:
Always position size properly and consider a stop loss based on your risk tolerance. Nothing goes up in a straight line – keep your strategy tight.
📝 Disclaimer: This is not financial advice. These are personal trading ideas based on current chart trends and market sentiment. Always do your own research and consult with a licensed financial advisor before making any investment decisions.
Stay sharp & trade smart! 💼📊
NZDJPY: Pullback From Support 🇳🇿🇯🇵
There is a high chance that NZDJPY will pull back from support.
As a confirmation, I see a double bottom pattern on an hourly time frame
and a breakout of its neckline.
Goals: 85.30 / 85.58
❤️Please, support my work with like, thank you!❤️
I am part of Trade Nation's Influencer program and receive a monthly fee for using their TradingView charts in my analysis.

DXYThe US Dollar Index (DXY) remains bullish, with a strong uptrend. The Commitment of Traders (COT) report shows increased long positions from speculators, indicating positive sentiment towards the USD. Rising market participation supports the bullish outlook.

EURJPY Double Top - Bearish Reversal Ahead Toward Target!🔍 Chart Analysis: Identifying the Double Top Pattern
The EURJPY (Euro/Japanese Yen) 1-hour chart shows a classic Double Top pattern, which is a strong bearish reversal formation. This pattern occurs when the price reaches a significant resistance level twice but fails to break above it, indicating a potential shift from bullish momentum to bearish control.
1️⃣ Top 1: The first peak formed as buyers pushed the price higher, but strong resistance forced a pullback.
2️⃣ Top 2: The price attempted to break the same resistance level again but failed, forming a second peak at approximately 164.165, confirming that sellers are overpowering buyers.
3️⃣ Neckline (Support Level): The critical support level around 160.000 acted as a trigger for the bearish move. Once this level broke, the double top pattern was confirmed.
📌 Key Levels and Market Structure
🔹 Resistance (164.165): The highest level where sellers dominated, preventing further upward movement.
🔹 Support/Neckline (160.000): This level acted as a crucial pivot. Once broken, it signaled a trend reversal.
🔹 Take Profit Levels:
TP1 – 159.036: This serves as the first profit target, aligning with a prior demand zone.
TP2 – 157.200: The full projected downside move based on the double top pattern.
🔹 Stop Loss (SL): Above 164.165, ensuring a risk-managed approach in case of trend invalidation.
📉 Trading Strategy: How to Trade This Setup?
1️⃣ Entry Confirmation:
The ideal entry was after the price broke the neckline at 160.000 and retested it as resistance.
A breakdown candle with high volume confirmed seller dominance.
2️⃣ Stop-Loss Placement:
A stop-loss above 164.165 provides room for price fluctuations while protecting against false breakouts.
3️⃣ Profit Targets:
TP1: 159.036, securing partial profits.
TP2: 157.200, completing the double top measured move.
📊 Market Psychology & Price Action Insights
The double top pattern reflects a shift in market sentiment from bullish to bearish.
The repeated rejection at 164.165 signals a lack of buying strength, increasing the probability of a downward move.
The breakdown of the 160.000 neckline confirms that sellers have taken control.
The price action also shows a lower-high formation, reinforcing bearish momentum.
✅ Conclusion: Bearish Bias Until 157.200
This setup strongly favors short positions, as long as the price stays below 162.500.
A break above 164.165 invalidates the bearish setup, signaling a potential reversal.
Until then, the market remains bearish, with TP1 & TP2 as achievable downside targets.
💬 What’s your outlook on EURJPY? Drop your analysis below! 👇

USDCHF: Consolidation ContinuesDuring our daily interaction class today, we observed that the 📉USDCHF pair is consolidating within a horizontal range on a 4-hour time frame.
After testing its resistance, there was a downward movement in the market which led to the breach of the neckline of a double top pattern, indicating a strong bearish signal for intraday trade.
As a result, I anticipate that the price could decline to the 0.8789 level in the near future.

$NVDA | A Double Bottom in the Making? We’re spotting the early structure of a double bottom pattern forming on NASDAQ:NVDA — a classic bullish reversal signal. After a steep decline, price action is showing signs of stabilization, testing support twice, and trying to recover from the lows.
But there’s a catch...
📌 No confirmation yet.
The neckline still needs to be broken with strong momentum to validate this formation and trigger potential upside.
⚠️ Today’s tariff-related news could be the catalyst. A strong reaction may either confirm the breakout or invalidate the pattern entirely.
What to watch:
Break above the neckline with volume = potential entry ✅
Failure + breakdown = more pain to come ❌
This is a key technical level. Stay sharp and let price action lead the way.

SPY Divergence - Bullish Comeback?SPY is showing quite a significant bullish divergence on the Daily timeframe. This appears to concur with a potential double-bottom formation. We also see the RSI beginning to poke up through it's moving average:
Alongside this we see a Rug Pull target on the 4h timeframe of the ES1! S&P futures ticker.
Rug-pull events on this ticker have seen a great degree of accuracy over the past few years, as seen below:
This rug-pull target alongside strong divergence on the higher timeframes indicates a high probability the markets will trend towards the upside in the near future.

Play On LevelsRetested the Breakout Level around 180 - 185 &
Closed just above a Very Important fib level around
188.
But, 188 - 195 is Very Important Resistance as of now.
If 195 is Crossed with Good Volumes, 212 - 215 can be
touched initially.
Couple of Positive Weekly Candles with comparatively good
volumes may confirm HL on Monthly basis.
On the flip side, 175 - 184 is a Support Zone & also Double
Bottom around 175 - 176, so Short Term Traders may
expect a bounce from this level.

TESLA **SELL**TESLA Contain 3 patterns
Douple Top Neck Line 700 Closing under it now Target of pattern 155$
Head and Shoulders Closing under Neck Line Target of pattern 156$
Bulish Crab Target 182 to 140 $ it strong Buy Zone

AUDCHF sell long termWe have double bottom, strong level, and bearish Triangle. After broking trend line - need buy until weekly trendline.

GBPJPY BULLISH OUTLOOK WITH DEFINED RISK *GBP/JPY Trade Opportunity: Bullish Outlook with Defined Risk*
A potential buying opportunity has emerged in the GBP/JPY currency pair, with a defined risk management strategy in place.
*Trade Setup:*
- *Buy*: 192
- *Take Profit (TP)*: 197
- *Stop Loss (SL)*: 190
This trade setup is based on a bullish outlook for the GBP/JPY pair, driven by both technical and fundamental factors.
*Fundamental Analysis:*
The British pound (GBP) has been gaining strength against the Japanese yen (JPY) due to:
1. *Interest Rate Divergence*: The Bank of England (BoE) has maintained a hawkish stance, while the Bank of Japan (BoJ) continues to pursue a dovish monetary policy. This divergence in interest rates has created an attractive carry trade opportunity.
2. *Economic Growth*: The UK economy has shown resilience despite Brexit uncertainties, while Japan's economic growth remains sluggish.
3. *Trade Tensions*: The ongoing trade tensions between the US and China have led to a decline in the value of the yen, making it an attractive currency to sell against the pound.
*Technical Analysis:*
From a technical perspective, the GBP/JPY pair has broken out of a consolidation range and is now trending upwards. The relative strength index (RSI) is below 70, indicating that the pair is not overbought yet.
*Risk Management:*
To manage risk, a stop loss has been set at 190, which is below the recent swing low. This will limit potential losses if the market moves against the position.
*Conclusion:*
The GBP/JPY trade setup offers a bullish opportunity with defined risk. The combination of interest rate divergence, economic growth, and trade tensions provides a solid fundamental basis for the trade.
Keep your best wishes to the Travis 👍

EURAUDEURAUD Potential Short Setup upon the next Retracement
Confluences :
Break of Brick wall
Price Failed to make Previous highs, instead price formed Double Top Pattern
Break of Previous Structure HL

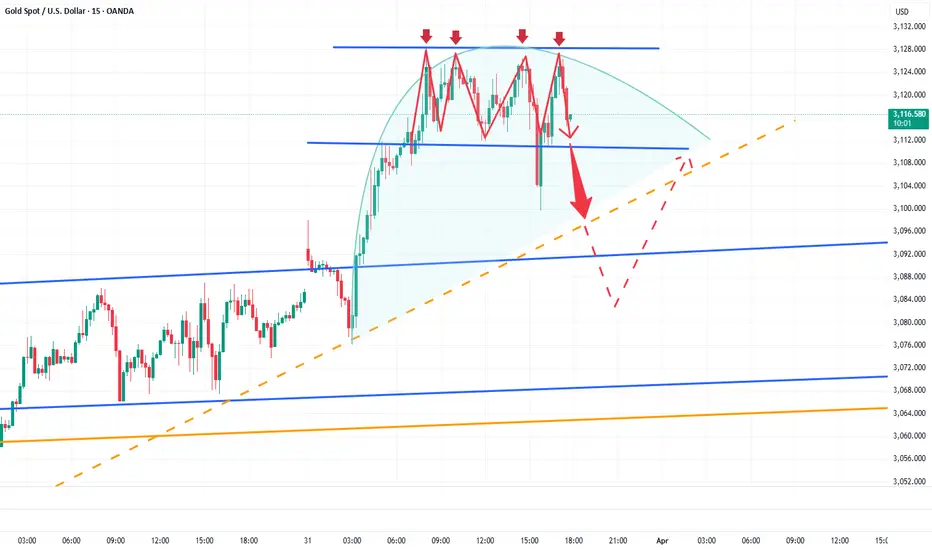
Good news for bears, gold will fall back to 3095-3085Driven by Trump’s tariff policies and geopolitical risks, gold has sustained a strong upward trajectory. However, after reaching around 3128, its momentum has visibly slowed, with multiple signs of pullbacks emerging within the short-term structure.
From the candlestick chart, it’s evident that gold has faced repeated rejection signals above 3125, characterized by long upper shadows. The 3125 level has now formed a notable resistance zone and appears to be acting as a short-term consolidation high. This price action increases the likelihood of a potential top formation.
Moreover, gold’s recent strength is largely attributed to growing concerns of a global trade war sparked by Trump’s tariff policies, prompting investors to rotate out of risk assets like equities and into safe-haven assets such as gold. However, if Trump softens his stance on the tariffs or adopts a more diplomatic approach to maintain confidence in the U.S. dollar, risk appetite may recover. This would likely drive funds back into equities and other risk assets, leading to an outflow from gold.
For gold trading, I prefer to avoid aggressively chasing long positions at this stage, as downside risks persist. If gold fails to decisively break through the 3125-3135 resistance zone, the bullish momentum may weaken, increasing the likelihood of a downward move. If gold break below the 3100 level during a pullback, it could accelerate further declines, with potential targets in the 3095-3085 range.
The trading strategy verification accuracy rate is more than 90%; one step ahead, exclusive access to trading strategies and real-time trading settings

Multiple top signs appear, short gold!Although gold rebounded quickly after hitting 3100, it does not rule out the process of testing and confirming the top. I think that in the short term, we can still short gold in batches with the help of 3025-3035 zone suppression. Then wait patiently for gold to retrace!
If gold can fall below the 3100-3095 zone during the decline, gold may accelerate downward to the area around 3085 under the stimulation of selling. Let us wait and see!
The trading strategy verification accuracy rate is more than 90%; one step ahead, exclusive access to trading strategies and real-time trading settings
NEARUSDT: double bottomThere is a possibility of a double bottom in NEARUSDT, this position is extremely risky, please take this into consideration and perform your transaction, this is not an investment advice.
