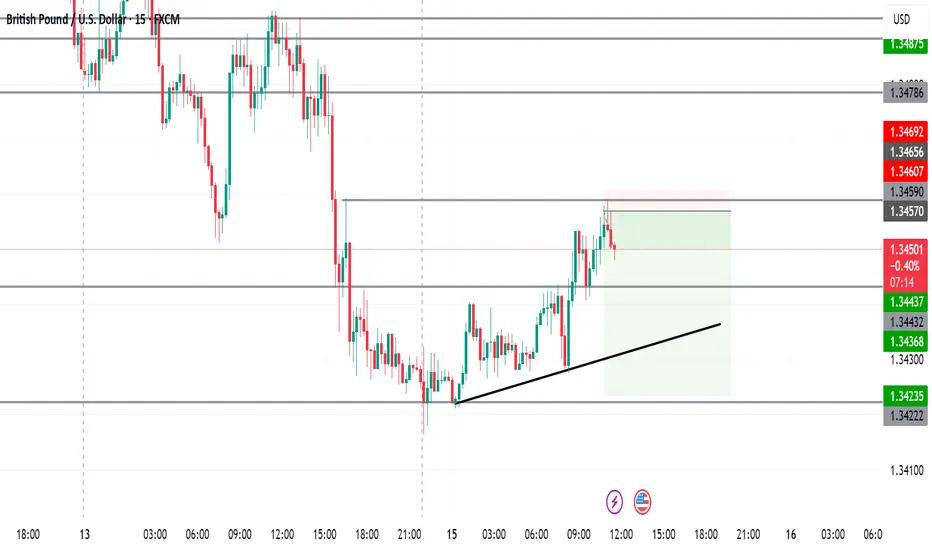
GBPUSD London PlayWhat I see and what I am in, already 1:3RR and will keep an eye for news in 2 hours as well as the lower levels marked
Double Top or Bottom
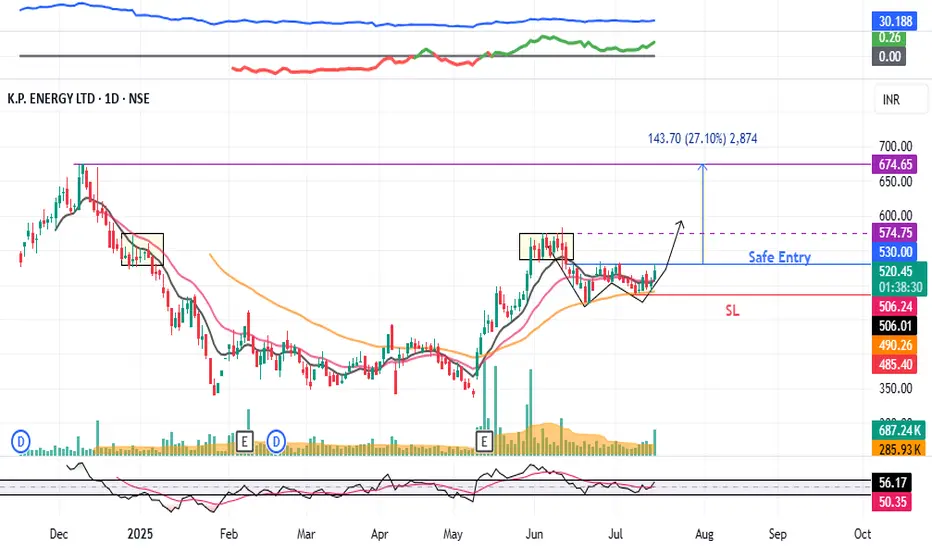
KPEL : Breakout stock#KPEL #swingtrade #breakoutstock #Wpattern #patterntrading
KPEL : Swing Trade
>> Trending Stock
>> W Pattern Breakout soon
>> Good Volumes & Strength
>> Good upside potential
Swing Traders can lock profit at 10% and keep trailing
Pls Boost, Comment & Follow for more analysis
Disc : Charts shared are for Learning purpose not a Trade Recommendation, Take postions only after consulting your Financial Advisor or a SEBI Registered Advisor.
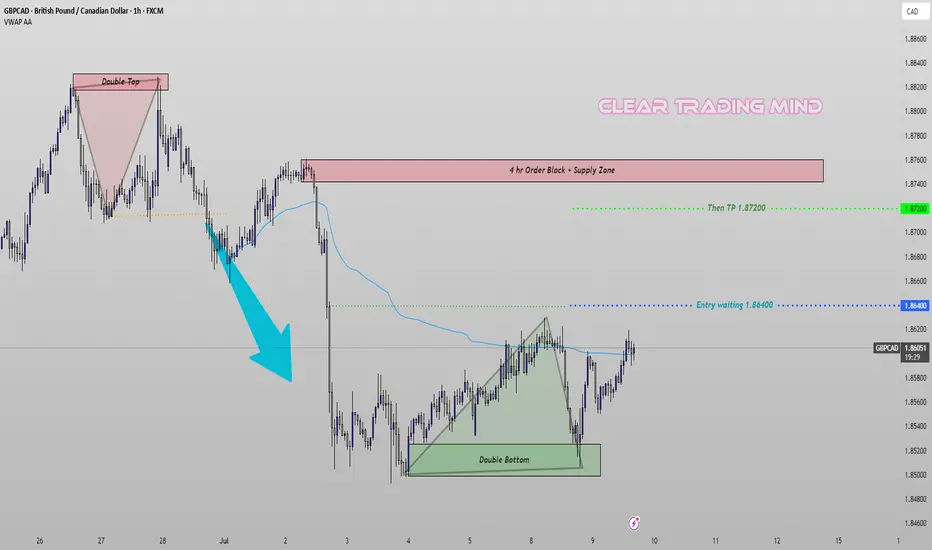
GBPCAD Bulls Preparing – Watching Break Above VWAP🔹 Current View:
The pair has formed a Double Bottom pattern around 1.8500 after a strong bearish drop from a Double Top near the 4H Supply Zone. This indicates a potential reversal.
🔹 VWAP Insight:
The blue line is VWAP, acting as dynamic resistance. Price is currently testing this area. A clean break above it could confirm bullish momentum.
🔹 My Trading Plan:
I’m waiting for the price to move above the VWAP and reach my key level at 1.86400 to enter a long trade.
➡️ Entry: 1.86400
➡️ Target: 1.87200 (near previous supply zone high)
🔹 Technical Summary:
- Bearish Pressure Origin: Double Top + 4H Order Block
- Bullish Signal: Double Bottom formation
- VWAP Breakout Watch: Key for confirming strength
If the price clears VWAP and hits the entry, I’ll look for a move toward the 1.87200 resistance zone.
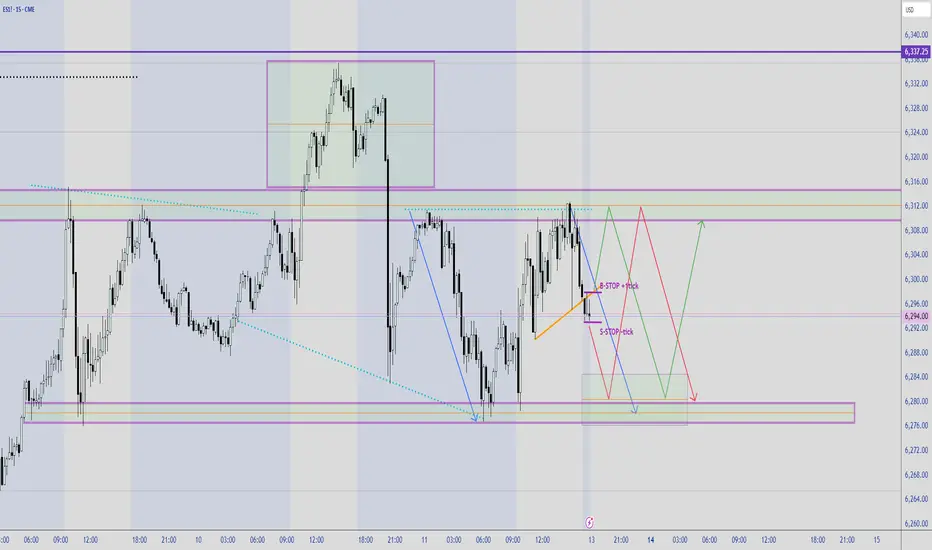
TRADING RANGE - ES!DT on the daily, ES! may pullback a little bit lower before moving up and breakout to a establish a new high. Last Friday was a High2 pullback, close lower than the previous bar. Looks like a consolidation or a trading range between 6336 to 6246. On the 15min paints 2 potential move either up or down, and bias seems to be bearish to complete the symmetry of the previous down leg then reverse back up. Rule of thumb buy or sell stop 1 tick above or below the marked lines.
It was good that you waited. Now here's a way to get involved. Over the weekend we took a look at Silver and predicted that we'd probably see an emotional reaction on the open where a lot of (casual traders) look to get involved (due to the headlines) and unfortunately, pay the price for being late.
Now that, that initial group has been shaken out of the market, I want to revisit the metal and show my preferred area for entry along with a conservative approach that you can use if you want to get in earlier.
Please leave any questions, comments, or your trading ideas below.
Give me a follow that way you don't miss my next trading idea.
Akil

AUDUSD: Pullback From Support 🇦🇺🇺🇸
There is a high chance to see a pullback from the underlined
key horizontal support on AUDUSD.
As a confirmation, I see a bullish imbalance candle on an hourly time frame.
Goal - 0.658
❤️Please, support my work with like, thank you!❤️
I am part of Trade Nation's Influencer program and receive a monthly fee for using their TradingView charts in my analysis.

XAUUSD Inverted head and Shoulder and Double Top FormationThis chart is only for educational purpose. Please do your own analysis before taking any trades.

Crypto 2021-22 Rerun?Crypto ex-BTC looks like an identical setup with high, divergent higher high, dead cat bounce, with the same level of resistance in play (both double top and 'right shoulders')
Shitcoins and crypto are much less popular among retail this time around, which has me thinking a FOMO surge to new highs is off the table this time.
I think there's a short setup here, but posting before a break confirmation has occurred anyway (so technically still neutral today). I dont trade crypto, but follow the trends and this just stood out to me enough to share.

What do you think!!Hi all
I believe we can go with BCHUSD for long as showing, but we need to wait for more confirmation
Again am not professional and am sharing my thoughts depend on my analysis :)

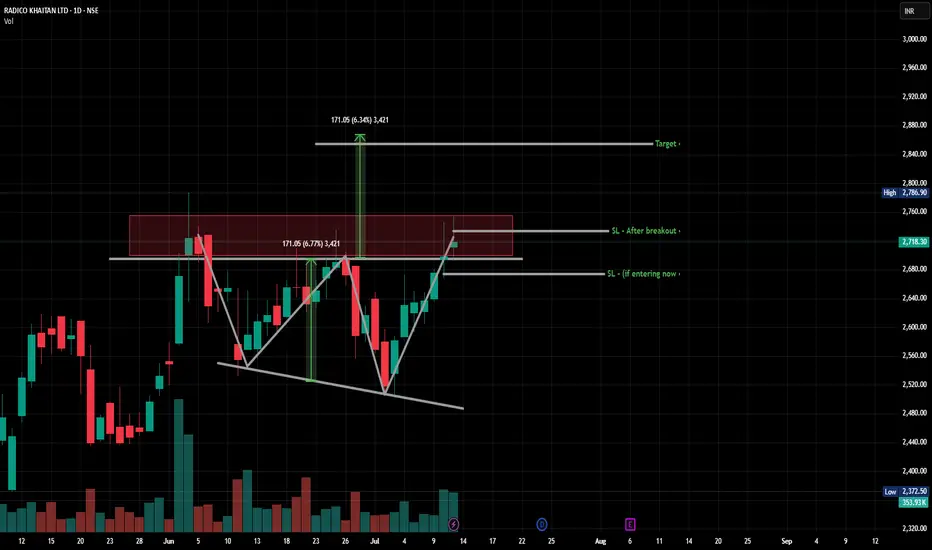
RADICO: Clean W patternNSE:RADICO : A clean W Pattern has formed. But it is kind of screwing up on the resistance. I am waiting till it maybe breaks out of that range because:
High volume
Not looking good :(
HBARUSD has 3 bullish patterns stacked on top of eachotherThe inverse head and shoulders in the light blue, the light tan is the bull flag, and the pink is the double bottom. Currently price is above the Bullflag and the Inverse head and shoulders pattern. The bullflag also counts as a descending channel pattern as well. We just recently retested the neckline of the inverse head and shoulders as exact wick support which is a good sign. All 3 should provide eachother with the bullish confluence needed for them to be validated, but in addition to this technical bullishness we have some fundamental bullishness occurring just recently too as NVIDIA just announced their new Blackwell chips — claiming them to be the future backbone of AI infrastructure — which are integrating verifiable compute which has its fundamental trust layer built on Hedera. This also provides great bullish confluence and heightens the probability these 3 chart patterns will all be validated and reach their full targets. I will keep updating this post as they do so. *not financial advice*

Invert Head and shoulder + cup with handle + 2x Double bottomOkay so I tried naming this pattern but gave up halfway because:
There’s a clean Inverted Head & Shoulders
A perfectly awkward Cup with Handle
And not one but two Double Bottoms, stacked like technical lasagna
All that drama right under the same resistance zone
👹 The red rectangle? It’s been tested five times already. FIVE.
If this level breaks, it won’t just be a breakout — it’ll be a ritual summoning. A support level forged in volume, trauma, and the unholy power of pattern layering.
If it flips, this zone is gonna be support backed by every TA demon in the book.
(W) Bearish Setup in PlayNYSE:CPAY – BEARISH 2618
Weekly chart confirms a Technical Double Top pattern around $370–$380, followed by a textbook Bearish 2618 retracement.
🔍 Key Confluences:
Double Top confirmed, neckline broken.
Price retested 0.618 Fib retracement at $350.51 (aligning with weekly resistance).
Bearish 2618 pattern projects downside potential toward $227.13.
First support to watch: $313.97, followed by $269.02.
🧭 Bearish outlook favored unless weekly close reclaims $355+. As long as price stays below that level, sellers remain in control.

USOIL - Bearish Double TOPHello Traders !
The USOIL failed to create a new higher high.
The price formed a double top pattern.
Currently, The neckline is broken !
So, I expect a bearish move📉
________________
TARGET: 64.970🎯

AUDCHF: Pullback From Resistance 🇦🇺🇨🇭
AUDCHF is going to retrace from a key daily resistance.
As a confirmation, I spotted a double top pattern on 30 minutes time frame
and a very bearish reaction after CHF fundamental news releases an hour ago.
Goal - 0.5238
❤️Please, support my work with like, thank you!❤️
I am part of Trade Nation's Influencer program and receive a monthly fee for using their TradingView charts in my analysis.

NAS100 (Cash100) Double Top H8Potential short on NAS100.
Risk/reward = 5.4.
Entry = 22 956
Stop loss = 23 059
TP level 1 = 22 473 (50% of position)
T level 2 = 22 303 (50% of position)
RSI divergence.
Waiting for closure of current H8 candle to close in range.
Looking for lower volume on H8 closure, however, will make exception id higher since top 1 was on Thursday the 3rd and markets closed early.

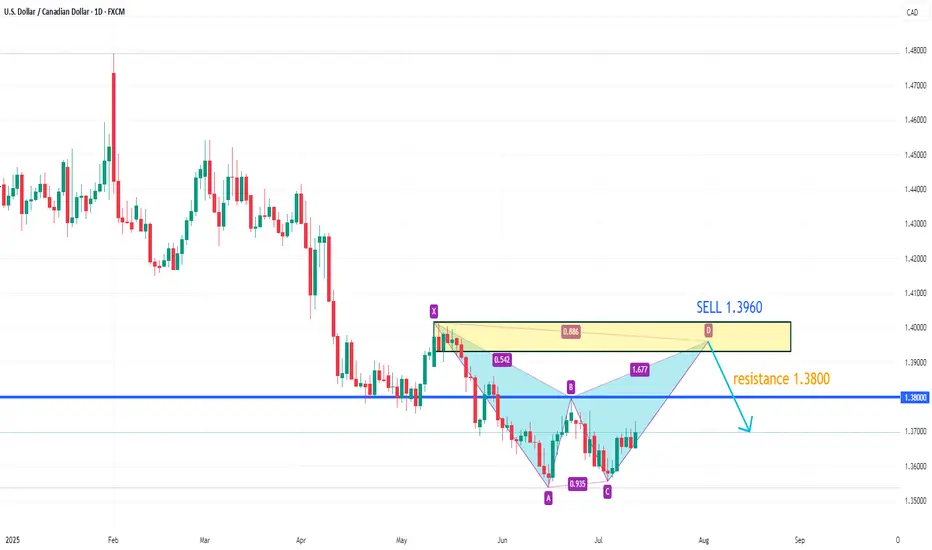
USDCAD upside target 1.3960On the 4-hour chart, USDCAD stabilized and moved upward, with bulls taking the upper hand. The current market has formed a potential double bottom pattern. In the short term, attention can be paid to the resistance near 1.380. A breakthrough will hopefully continue to move higher, with the upward target around 1.3960. When the price reaches 1.3960, attention can be paid to the bearish bat pattern.
GBPNZD: One More Pullback Trade I notice another potentially profitable pullback trade opportunity on 📉GBPNZD.
The price formed a double top pattern after testing a significant daily/intraday resistance and has broken through its neckline.
Currently, we are witnessing a retest, and the pair could pull back to the 2.2391 level.


ZRO/USDT Wave AnalysisSince 2024, CSE:ZRO established a key level around $3. Moving into 2025, the price experienced a sharp decline, breaking below $3 and finding support near $1.5.
In mid-March, the long-term downtrend channel was decisively broken with a +140% move. However, the price failed to reclaim the $3 key level on the back-test, resulting in a prolonged sideways range between $2.3 and $3.
During this consolidation phase, there was a notable upthrust right at the $3 key level, which triggered another strong correction, sending price back to retest the $1.5 support zone.
Currently, we are seeing a clear breakout from the descending channel. With Bitcoin reaching new all-time highs, the outlook for CSE:ZRO has turned positive, and a new bullish wave is expected. The primary target remains a break above the $3 key level. Importantly, this breakout is developing with a healthier structure compared to the rapid, unsustainable move in March.
Risk management: Place stop-loss orders below $1.7 to protect capital.

GER40 Breaks Resistance – Eyes Set on 25,000 The index has broken above the key resistance at 24,367 🔼, turning it into fresh support. This breakout confirms bullish momentum, with strong upward structure and follow-through candles.
Support Levels: 24,367 🔽, 23,718 🔽
Resistance Levels: 25,000 🔼
Bias:
🔼 Bullish: If price holds above 24,367, we may see a continued push toward 25,000.
🔽 Bearish: A drop below 24,367 could invalidate the breakout and shift momentum back to 23,718.
📛 Disclaimer: This is not financial advice. Trade at your own risk.

GOLD (XAUUSD): Time to Recover?!
Gold reached an important rising trend line on a daily.
I see 2 nice intraday bullish reactions to that on a 4H time frame
and a double bottom pattern formation.
Its neckline breakout and a 4H candle close above 3309
will confirm a start of a bullish correctional movement.
Goal will be 3327.
Alternatively, a bearish breakout of the trend line will push
the prices lower.
❤️Please, support my work with like, thank you!❤️
I am part of Trade Nation's Influencer program and receive a monthly fee for using their TradingView charts in my analysis.

Buy Gold! The short-term bottom may have appeared!Gold continued to retreat yesterday and hit a recent low, reaching around 3287. Then gold gradually rebounded to above 3300. Relatively speaking, the rebound momentum was weak. It is expected that the long and short sides will fight fiercely around 3300. However, from the recent characteristics of gold operation, it can be seen that although the short position of gold is strong, it is difficult to continue in the short term, and I think the short-term decline of gold is basically in place, so at this stage, in terms of short-term trading, I do not advocate shorting gold directly;
As gold did not continue to fall after reaching around 3287, on the contrary, it gradually rebounded to above 3300, which may strengthen the market's consensus on the short-term bottom, thereby attracting the favor of off-site funds; from the current gold structure, if gold can maintain above 3300-3295, it may be combined with the 3287 low to build a "W" double bottom structure, which is conducive to supporting the rebound of gold.
However, as gold fell below 3300 again, the bearish trend is relatively strong, so we need to moderately lower our expectations for a gold rebound. In the short term, gold is under pressure in the 3315-3325 area, so we can temporarily look to this area for the rebound target. Therefore, in short-term trading, I do not advocate shorting gold directly, and you can first consider going long on gold in the 3300-3295 area, TP: 3310-3320-3330.
