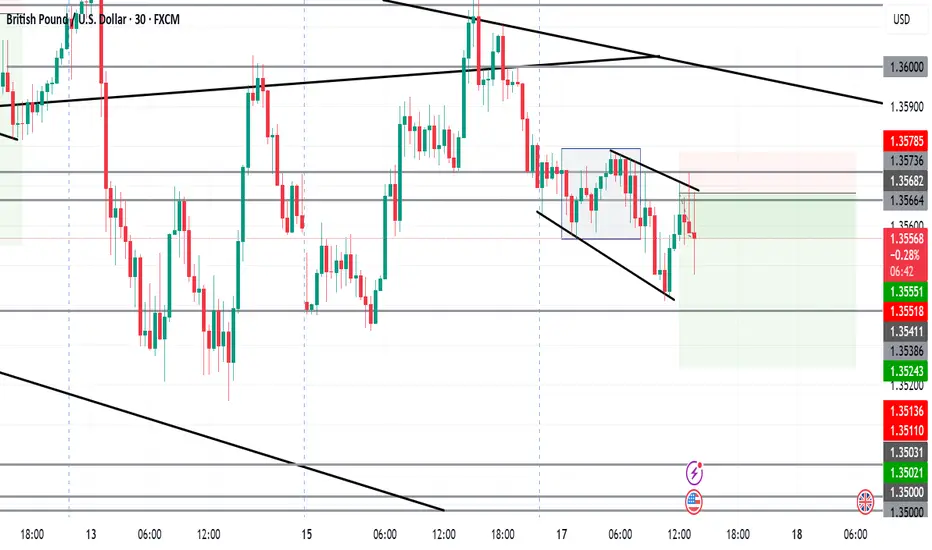
GBPUSD London ShortsWhat I see and we could have one massive push down to setup a mid reversal today/tomorrow
Double Top or Bottom

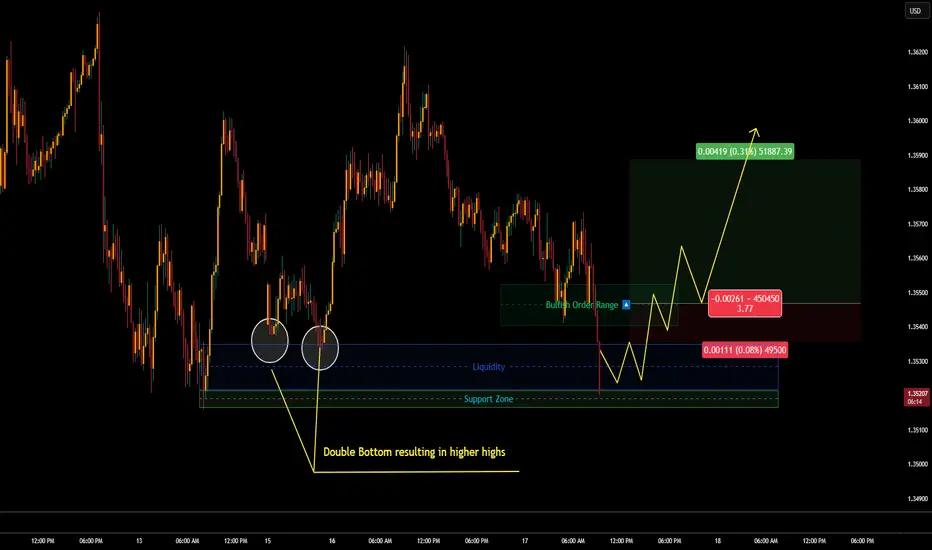
GBP/USD June 17th 20205 (Long)Just going to leave this here. Price is already extending below a secondary VWAP band. Its headed towards a low where liquidity was left from a double bottom.
This double bottom resulted in a set of higher highs. This shows significant buying levels at these prices. Liquidity sitting just above the supper area.
My entry model for today is:
Long @ 1.35468
Final Target: 1.35887
I would open this with 3 contracts on a 50k account
1st TP @ 1.35642 to close out 2 contracts.
High Risk/reward Ratio for ODAS Long TradeI believe ODAS has not much time for breakout. Stop level should be weekly closure below 4.5 TL which is the testing area of double bottom. Take Profit should be set to fibonacci level 8TL.

GBPUSD Pre-NY + News SetupPressure to the downside ... until mid-week reversal
Snacking with this one:
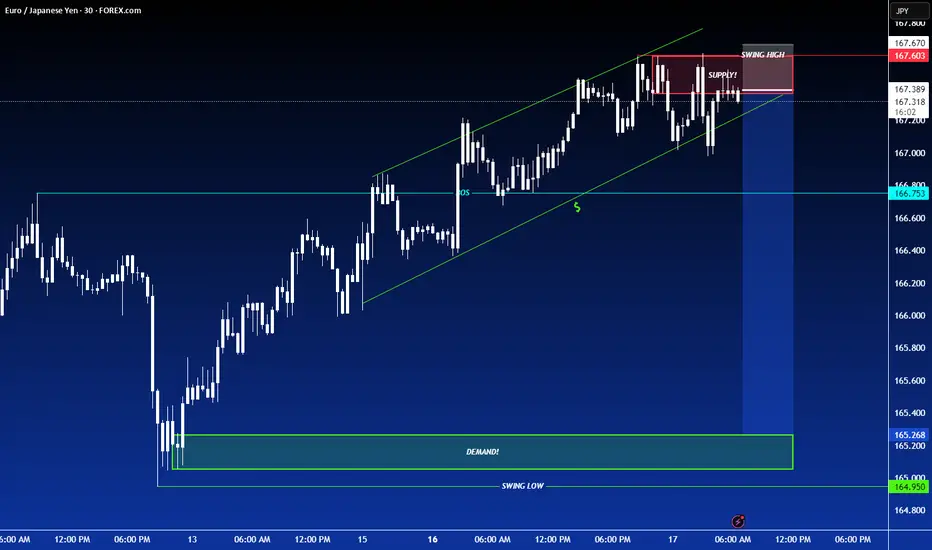
SHORT ON EUR/JPYEJ has created a (Rising Channel) with a (Double Top) at a major resistance zone.
Both Chart Patterns are Bearish Reversal Patterns.
I will be Selling EJ to the next demand level as it seeks out liquidity to the downside for 100-200 pips.
AUDJPY - Double Bottom PatternHello Traders !
As we talked in the previous analysis, The AUDJPY price formed a double bottom pattern.
The price has pulled back to neckline and will now continue its bullish movement.
So, I expect a bullish move🚀
______________
TARGET: 95.110🎯

NVDA 15mins Short Market Context:
After a corrective decline, NVDA is showing temporary bullish momentum, forming higher lows on the lower timeframes. However, the overall structure remains bearish-biased, and this upside is likely part of a liquidity run rather than a genuine reversal.
Liquidity Magnet at $149
There is resting liquidity above recent highs near $149, a zone where retail buy stops are likely positioned.
Smart Money typically pushes price into such highs to induce late longs and liquidate early shorts before a major move.
Momentum Shift Already in Progress
The current bullish move lacks aggressive expansion — it's showing divergent momentum and weaker impulse candles compared to the prior leg down.
This signals the upside may terminate as a liquidity hunt, not trend continuation.
Structural Setup for the Short
Once price taps $149, observe for a sharp rejection or breakdown of internal short-term structure (i.e., break of a local low with displacement).
This signals the smart money exit and bearish intent.
The shift from engineered buy-side pressure into sell-side delivery confirms short bias.
I expect NVDA to run higher into $149 to sweep liquidity, then break down sharply toward $135. I will look for internal bearish structure to form right after the sweep and will short only upon confirmation of intent (displacement and lower low).

ADAUSDT Is Warming Up for a Major MoveYello, Paradisers! Did you notice what just happened on ADAUSDT? After sweeping liquidity, the pair has now printed a bullish internal change of character (I-CHoCH), confirmed by bullish divergence. This confluence significantly increases the probability of a bullish move from here—but only if you play it smart.
💎From the current price levels, the risk-to-reward ratio isn’t the most attractive for conservative entries. Aggressive traders might still consider taking a position with a tighter invalidation, but the trade needs to be managed with precision.
💎For those who prefer safer setups, it’s much wiser to wait for a pullback into the key support zone. A confirmed retest from there could offer a much cleaner risk-to-reward structure and a clearly defined invalidation level.
💎However, if the price breaks down and closes below that invalidation level, this entire bullish setup becomes invalid. In that case, it's best to stay patient and wait for a new structure to form before jumping back in. Entering too early in uncertain territory can turn a high-probability setup into a costly mistake.
🎖Strive for consistency, not quick profits. Treat the market as a professional, not a gambler. Discipline and timing are what separate the winners from the crowd. Be patient, wait for the high-quality trades, and execute with confidence. That’s how long-term success is built in this game.
MyCryptoParadise
iFeel the success🌴

$EURUSD Analysis | Bearish Confluences in PlayPEPPERSTONE:EURUSD
The Fiber is currently testing multiple technical barriers, including the golden Fibonacci zone, channel resistance , and bearish harmonic patterns. A lower-degree double top has led to a potential bearish 2618 setup, suggesting short-term downside risk.
📉 Fractal Structure Zones
🔸 Daily fractal resistance (short-term): 1.1631
🔸 Weekly fractal resistance (mid-term): 1.1573
🔸 Intraday resistance (4H): 1.1569
🔸 Intraday support (4H): 1.1523
🔸 Daily fractal support: 1.1371
🔸 Monthly fractal resistance (long-term): 1.1213
🔸 Weekly fractal support: 1.1065
🔸 Monthly fractal support: 1.0177
A rejection below intraday support may validate the bearish setup, while a sustained break above daily resistance would question the harmonic scenario.
Happy Trading,
André Cardoso

SHOT ON EUR/USDEUR/USD Has given us a nice double top at a major resistance level.
Since then it has broken the neckline of that double bottom, creating a new low, engineering liquidity, sweeping it and now getting ready to tap into supply before it should fall.
The Dxy is also getting ready to rise from a demand level so this should also aid in pushing EU down.
Looking to catch over 200 pips.

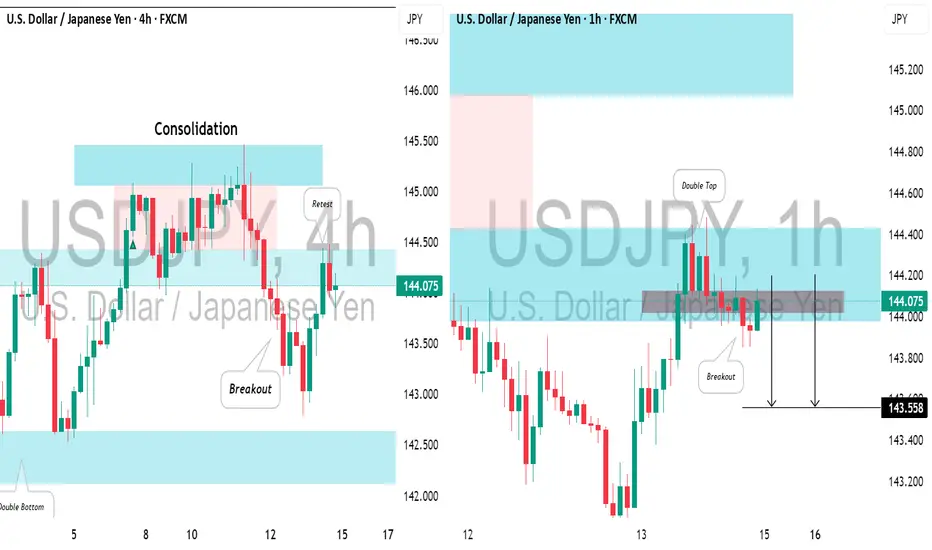
USDJPY: Intraday Bearish ConfirmationIn the middle of last week, I spotted a valid confirmed structure breakout on 📉USDJPY on a 4-hour timeframe.
Currently, the pair is retesting the broken structure, and the price has formed a strong bearish confirmation on the hourly chart.
I see a double top pattern and a violation of its neckline.
With high probability, the price will fall and reach the 144.02 level.
#BTC Double Top Breakdown? Key Levels to Watch: 100K, 92K, 74Bitcoin has recently formed a double top pattern near its all-time high at $112K–$110K, signaling potential exhaustion in the bullish momentum. After a strong rejection from the $106K resistance — a critical zone that has historically failed to close above on the daily timeframe — BTC is showing increasing bearish pressure.
All major indicators — RSI, MACD, and Stochastic RSI — are aligning to confirm this potential downtrend.
Here’s the projected bearish scenario if key supports break:
A break below $100K could trigger a fall to $97K, followed by a bounce and retest.
Rejection from $100K again may lead to a drop toward $92K.
Failure to reclaim $95K–$90K could send BTC directly down to $88K.
Another failed attempt near $90K might push Bitcoin to crash toward $74K, echoing the 2024 summer correction pattern.
This setup mirrors past seasonal moves and could mark a significant shift in market structure if confirmed.
📉 Watch these key zones:
$106K – Major resistance
$100K – Psychological and structural support
$92K / $88K / $74K – Potential targets if bearish continuation plays out
⚠️ Stay alert for retests and confirmations before entries.

W's all day on ondo is it possible?Just seeing all these Ws wishful thinking but is it possible 🧐🤔? 15m to 1hour also showing W's

Circle’s IPO and the Crypto Listing Wave: The Market EntersOn June 14, 2025, the U.S. stock market witnessed a pivotal moment for the crypto industry. Circle, issuer of the USDC stablecoin and a major player in the sector, successfully went public. Shares opened at $31 and soared to over $134 by the end of the first trading day—an explosive 330% gain.
This isn’t just a one-off success. It marks the beginning of a new chapter: the public crypto era, where leading crypto companies are stepping into the spotlight of traditional finance.
Why It Matters
Circle’s IPO signals the maturation of the crypto market. Just three years ago, crypto companies were seen as high-risk, unregulated tech startups. Now, they’re structured fintech firms with clear business models, institutional backing, and regulatory compliance.
Who’s Next in Line
Following Circle, a wave of major crypto firms is preparing for their own IPOs:
eToro – the social trading platform with crypto features has finalized its SPAC merger and is set to debut on NASDAQ.
Gemini – the exchange founded by the Winklevoss twins filed for an IPO in mid-May.
Galaxy Digital and Ripple – both confirmed listing plans for the second half of 2025.
Kraken is exploring a listing in Europe, where requirements are more flexible than in the U.S.
These companies are waiting for the right moment—regulatory clarity, growing interest in crypto ETFs, and progress in U.S. Congress (with the CLARITY and GENIUS bills gaining momentum).
What It Means for the Industry
Increased Investor Trust – Public companies must disclose financials, pass audits, and comply with regulations. This builds confidence in the broader crypto sector.
Institutional Capital Inflow – IPOs unlock access to capital from pension funds, hedge funds, and asset managers that cannot invest in private crypto startups.
Marketing Power – Going public draws media attention and boosts brand awareness. Every IPO is a PR win for the entire industry.
Risks and Challenges
Regulatory Uncertainty – Despite progress, the SEC could change direction, especially with potential political shifts.
Overvaluation Concerns – Circle’s stock is already raising eyebrows, with a P/E ratio over 200 and trading volume growing faster than revenue.
Crypto Market Dependency – If crypto prices crash, the valuations of these companies could quickly collapse.
What’s Next
Expect up to 10 more crypto IPOs over the next 6–12 months, including players in DeFi, blockchain infrastructure, and Web3. This is the next stage in crypto’s journey toward mainstream legitimacy.
What was once the domain of tech rebels and early adopters is now becoming a business—with a stock ticker and quarterly earnings. And that changes everything.

Ondo possible reversal?Just planning out ondo, keep in mind plans don't always play out... we will see in time.

GOLD ANALYSIS BULLISH 13 JUNE 2025
As per previous analysis gold moved in the way as I was expecting. Gold is still strongly bullish, this is all due to geopolitics Iran and Israel war. As #gold made high to 3444 also took correction and now continue to it's bullish rally. Due to this war gold may surge to new high, for today I am again expecting to break yesterdays high. I will recommend please don't trade when there is such war and geopolitics issues because this is just analysis but market behavior is not normal and it will move in unwanted direction. Plan your trade accordingly and do trade. Key points 3402, 3415, 3424, 3440.
Comment and like for analysis. Love it then follow
Any Query Reach Us or comment down.
Follow for more updates.
Rudra Vasaikar Wishes You A Great And Very Amazing Trading Life. Trade Safe, Trade Right.
RISK WARNING 🔴 🔴 🔴
There is high risk of loss in Trading Forex, Crypto, Indices, CFDs, Features and Stocks. Choose your trade wisely and confidently, please see if such trading is appropriate for you or not. Past performance is not indicative of future results. Highly recommended - Information provided by Pro Trading Point are for Educational purpose only. Do your investment according to your own risk. Any type of loss is not our responsibility.
HAPPY TRADING.
#gold #xauusd #xauusdtrading #goldtrading #goldanalysis #forextrading #forex #trendline #goldsignals #goldnews goldlatestanalysis #xauusdtradesetup #forextradingguide #fxgold
beyong technical analysis, chart patterns, gold, goldanalysis, goldideas, goldlong, goldsignals, goldlatestanalysis, goldtrading, goldtradingview, technical indicators, xauusdanalysis,

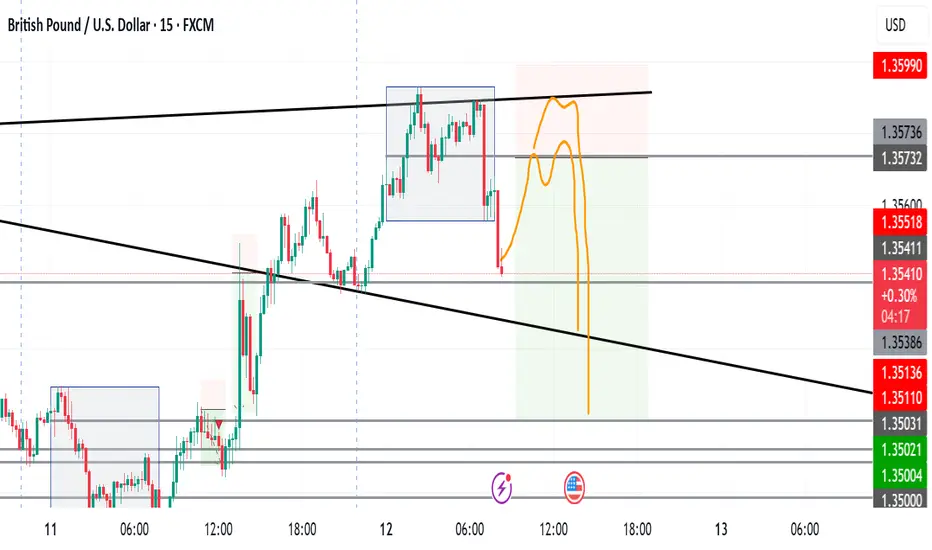
London Take 1 - GBPUSD - 12/6/2025SO this is what I see and anticipating ...more updates will follow.
PINK ZONE initially is ENTRY/KILL ZONE not entry and stoploss, screenshots after I am in the trade will update to atual short position with EP, SL & TP and my notes will elaborate.
News later at NY ...will be staying safe but looking to catch some pips

Short ABCLThis company is a train wreck financially. Why there is hype right now is beyond my understanding. How someone can look at this chart and buy is wild. Rule # 1, dont fight the trend. I believe this will rip a little bit longer, than the nothing burger will arrive.

6/11 Gold Analysis and Trading SignalsGood afternoon, traders!
Gold remains capped below the key resistance at 3350, with repeated failed breakouts. Meanwhile, strong support zones below are keeping the price range-bound in a narrow consolidation channel.
📉 Technical Outlook:
As higher lows continue to form, the trendline support is gradually shifting upwards. On the 30-minute chart, we now observe a potential double top pattern forming. If confirmed, it would signal a bearish reversal with the possibility of further downside.
🔍 Key Support Levels:
Watch for the 3330 level as initial support. If it’s broken decisively and the market fails to recover quickly, this may confirm the short-term double top and open the door for more aggressive selling.
On a broader timeframe, focus on 3320 as a critical support area.
📊 Fundamental Focus:
The key event today is the release of U.S. CPI data, which carries significant market-moving potential. A strong reading could be bearish for gold, supporting a shift in sentiment toward the downside.
📌 Today’s Trading Plan:
✅ Buy Zone: 3289–3272
✅ Sell Zone: 3358–3373
🔄 Intraday Levels for Flexible Scalping:
3348 / 3332 / 3319 / 3307 / 3293
Trade cautiously ahead of the CPI report, and keep position sizes moderate to mitigate volatility risk.

INDIGOPNTS - Bullish view potential of 28 to 45% ROIAll details are given on chart for educational purpose only. If you like the analyses please do share it with your friends, like and follow me for more such interesting charts.
Disc - Am not a SEBI registered analyst. Please do your own analyses before taking position. Details provided on chart is only for educational purposes and not a trading recommendation

GBPCAD Counter-Trend SELL(Weekly) - Price hit previous extreme high at (1.85932 - 1.87820) and was rejected forming double top neckline at (1.81470 - 1.80561) .
(Weekly) - Previous Week Candle Close is Shooting Star showing sellers taking action at Key Resistance level.
(Daily) - Price formed double top inside our resistance level at (1.85932 - 1.87820).
(Daily) - Price broke double neckline at (1.85533 - 1.85774).
(H4) - Price was in distribution at (1.86602 - 1.85774).
(H4) - Rising Trendline that price broke connecting (1.80561 - 1.86011).
Trade Entry.
(H4) - Wait for price to retest our daily double top neckline & low of the distribution at (1.85533 - 1.85774) to join the reversal.
(H4) - Take profit at Weekly Double Top Neckline at (1.81470 - 1.80561).

Gold Futures – Double Top Leads to Bearish SetupGold Futures on the MCX chart is showing a classic Elliott Wave pattern in play. After forming a regular flat correction with a double top near the 99,300–99,200 zone, prices have started to drift lower. The double top structure—combined with the completion of Wave B—suggests that a Wave C decline is underway.
Wave A took the price down to around 90,890, followed by a corrective Wave B that failed to break the previous high convincingly.
The near-term outlook on the 4-hour timeframe remains bearish. I am anticipating five waves down within Wave C, which may take price back toward the previous Wave A low or slightly lower, possibly ending in a diagonal pattern, before a bullish reversal can be expected.
Disclaimer: This analysis is for educational purposes only and does not constitute investment advice. Please do your own research (DYOR) before making any trading decisions.
