DOW Elliott Wave Analysis for Monday 18/09/2023The primary expectation is that we will go back into the wave ((b)) area to take out the previous high. That would mean we get an additional correction up as a wave ((b)). This move should be followed by further downside as a wave ((c)).
DOW

DOW JONES: Rejected on the 2week Resistance. Any change to recovDow Jones is having a sharp opening pullback on the 1H timeframe but remains on a bullish 4H technical outlook (RSI = 58.586, MACD = 126.970, ADX = 41.565), as the HL trendline of the Bullish Megaphone is holding. The reason for the pullback is the rejection on the R1 Zone (35,100 - 35,030). A 4H MACD Bearish Cross will most likely take the price to the HL trendline and the 4H MA50 (TP = 34730) in order to test the buying accumulation at the bottom of the Megaphone.
A buy signal consists over the R1 Zone, whose target will be the Megaphone's HH trendline (TP = 35,400).
Prior idea:
## If you like our free content follow our profile to get more daily ideas. ##
## Comments and likes are greatly appreciated. ##

DOW Elliott Wave Analysis for Friday 15/09/2023 (+ Higher TF)For traders (lower timeframe):
The primary expectation is now that we will go back into the wave ((b)) area to take out the previous high. That would mean we get an additional correction up as a wave ((b)). This move should be followed by further downside as a wave ((c)).
For investors (higher timeframe):
In the higher timeframe, investors should wait for the completion of the abc pullback. The wave 2 area is a nice buying opportunity for investors.

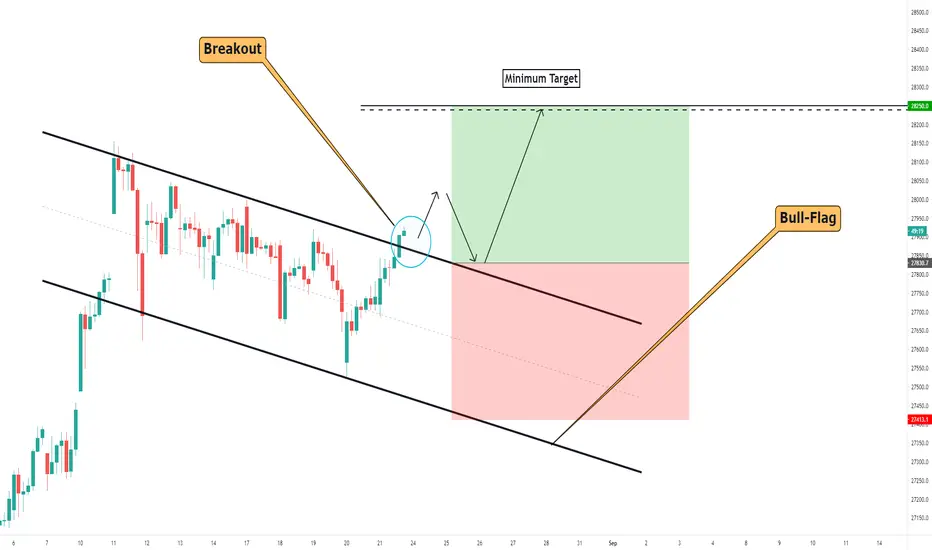
DOW JONES, Clean Breakout Of The Descending-Triangle!________________________________________________________________________________________________
Hi Traders, this is a signal I give to you for free today. The DOW INDEX has formed a clear triangle breakout
with volatility and completed above the 400-EMA where entry with pull back is possible.
________________________________________________________________________________________________
ENTRY: 27800-27300
MINIMUM TARGET: 28500
STOP LOSS: 26300
MINIMUM RISK REWARD: 1
REASON: Descending-Triangle Breakout
________________________________________________________________________________________________
In this manner, thank you for watching and support for more market insight.
Information provided is only educational and should not be used to take action in the markets.
________________________________________________________________________________________________

D-JONES, The Gap Filled Properly And Sourced High Volatility!Hello Traders Investors And Community,
Welcome to this update-analysis where we are looking at the DJIA 4-hour timeframe perspective, the index has recently shown high volatility movements to the downside which was expected after the gap-fill and the ending of the wave-count as pointed out previously this move now confirmed and the index testing the back-up-zone if you did not see this analysis already I highly recommend it by going on my account and watch it to have a full-depth-overview. Now there are important mechanisms the index has to show when considering a possible recovery there are significant levels to confirm, in this case, I detected the important zones and possible outcomes we should anticipate currently with the index destinies.
Looking at my chart you can watch there the index confirmed the preliminary short-zone bearish to the downside and now testing the blue back-up-cluster where several supports lying, firstly the EMA and secondly the upper boundary of the channel besides that it is a support zone formed by past price action. This cluster is highly important to hold when considering a bullish continuation and test of higher levels again because when the cluster does not hold and price moves below bearishness will increase till there is solid support found where the price can stabilize again, for a continuation the index needs to confirm the cluster and consolidate there as it is seen in my chart, a possible continuation can be confirmed when the index moves to the 28800 level again.
The index is in a situation where it has to show if the support levels can hold sustainably or lower levels will visit next times, when the index does not manage to stay above the back-up-cluster and closes below the next level to considered to be visited is the 27.000. Fundamentally speaking the decline was supported by the big divergences still existing in the real economy and stock market where the real economy is still damaged by corona increase it is important that these two factors grow together to provide a healthy market environment. Next times will show how the index can possibly stabilize however we should not keep the bearish case by side which will follow up when the index closes below the cluster, therefore it is inevitable to wait on the mentioned confirmation before going in the proper direction.
In this manner, thank you for watching, support for more market insight, good weekend to you and all the best!
"The ambition to transform opportunity into hold remains the most significant tool for a trader."
Information provided is only educational and should not be used to take action in the markets.

US30USD: Potential Right Shoulder and Bearish Gartley at HOPThe Dow Jones Industrial Average is forming a Potential Right Shoulder within an Ascending Broadening Wedge pattern and in this Right Shoulder, we can see a Potential Bearish Gartley at the HOP level with PPO confirmation. If it plays out, we will confirm a Partial Rise and increase the chances of a full on breakdown below this wedge pattern which at the very least would take us to the lows of the entire range.

DJIA, Flag-Formation Confirmed, Continuation Ahead!________________________________________________________________________________________________
Hi Traders, this is a signal I give to you for free today. Support will be great with a like and follow when useful.
________________________________________________________________________________________________
ENTRY: 27820-27950
MINIMUM TARGET: 28250
STOP LOSS: 27410
MINIMUM RISK REWARD: 1
REASON: Bull-Flag Confirmation
________________________________________________________________________________________________
In this manner, thank you for watching and support for more market insight.
Information provided is only educational and should not be used to take action in the markets.
________________________________________________________________________________________________
DOW Elliott Wave Analysis for Thursday 14/09/2023The primary expectation is now that we will go back into the wave ((b)) area to take out the previous high. That would mean we get an additional correction up as a wave ((b)). This move should be followed by further downside as a wave ((c)).

DOW: Downhill ⛷️Within the turquoise B wave, the Dow is currently in a downtrend. We expect this decline to continue to the turquoise target zone between $51.53 and $48.47, where we expect the reversal to occur. If the bulls prevent a decline until then and push the price above the resistance at $56.49, which we consider to be 34% probable, the price would establish the high of the magenta wave alt. a little higher.

DOW JONES 1st 1W Bullish Cross since 2016. Can we see 42k next?Dow Jones (DJI) is forming this week the first MA50 (blue trend-line) / MA100 (green trend-line) Bullish Cross (when the former crosses above the latter) on the 1W time-frame since September 2016 (assuming January/ February 2021 was flat due to the COVIC flash crash).
This on its own is a major long-term buy signal, especially since the 1W MA50 has been supporting since March. As you can see the 2022 - 2023 price action is very similar to the 2015 - 2016 sequence. Both fractals started on a Bear Cycle under Lower Highs, which bottomed after marginally breaking below the 1W MA200 (orange trend-line). The new Bull Cycle was confirmed after the price broke above the Lower Highs trend-line and turned it into a Support being formerly a Resistance. The 1W MA50/100 Bearish Cross signified the bottom. Notice how even the 1W RSI and 1W MACD fractals are identical with their respective Higher Lows.
It appears that Dow is currently past the initial Channel Down and on the Circle pattern, which in 2016 was the final consolidation before a hyper aggressive rally that topped in January 2018. Before that top it reached the 1.5 and 1.786 Fibonacci extensions.
We treat the current pull-back as the last opportunity to buy this upcoming rally while the price is still that low. Having relatively low expectations, we expect to see at least 42000 (1.5 Fibonacci) by the end of Q1 - start of Q2 2024.
-------------------------------------------------------------------------------
** Please LIKE 👍, FOLLOW ✅, SHARE 🙌 and COMMENT ✍ if you enjoy this idea! Also share your ideas and charts in the comments section below! **
-------------------------------------------------------------------------------
💸💸💸💸💸💸
👇 👇 👇 👇 👇 👇

D-JONES, Important Levels To Consider Next Times!Hello Traders Investors And Community, welcome to this update-analysis where we are looking at the DOW JONES Industry Index 4-hour timeframe perspective, the recent price-action, the current importances in the structure, what to consider next times and how to handle upcoming situations in the right manner. As the overall stock-market is recovering from its corona-breakdowns seen this year there are major indices which already filled important key-levels such as the huge gap in the SPX which I mentioned and now filled properly, the DOW is still below these levels and could possibly follow-up with its gap-fill. In this case I detected some important signals which can make this happen when the DOW moves correctly within its range, but this does not mean the market is comptletely bullish as the bear-market is still not confirmedly over bearish action can increase again as markets approaching solid supply zones.
Looking at my chart you can watch there that the index just moved above its descending-channel-formation and formed this smaller ascending-channel-formation where it also moved above the upper boundary, these factors give an increased bullish pace within here and can indicate continuation to the upside which will be given when the index manages to travel above the last rising resistance of its channel as you can watch it in my chart, it is either possible to form a consolidation before doing this or a immediate breakthrough, a consolidation is more likely within this structure. When this properly plays out the index will look for the gap to be filled which will be crucial as this can be a point where supply enters the market as people taking profit and the price moves to the downside therefore it can also be considered a possible short-zone as you can watch it marked in my chart.
It is highly important to take note that although the index sending some decent bullish signals at the moment it is still not confirmedly bullish not only because there are still remaining strong resistance-levels but also because there is still a huge difference between real economy and stock-market as stock-market is showing gains real economy is in a decline, to provide a healthy unspeculative market environment these two need definitely move together. When the index approaches the higher levels we need to elevate and be prepared for possible bearish signs as this will be crucial level where selling pressure can enter while many retailers rushed into the market to do not pass away the rally smart-money is still not fully in the market and in the sidelines this can be a indication for more bearish pressure assuming over the course of next weeks and months.
In this manner, thank you for watching, support for more market insight and have a good day!
“Forecast is a mixed fortune in todays market environment. ”
Information provided is only educational and should not be used to take action in the markets

DOW Elliott Wave Analysis for Wednesday 13/09/2023The primary expectation is now that we will go back into the wave ((b)) area to take out the previous high. That would mean we get an additional correction up as a wave ((b)). This move should be followed by further downside as a wave ((c)).

D-JONES, Double Bottom, Possibility On The Long-Side!________________________________________________________________________________________________
Hi Traders, this is a signal I give to you for free today. Support will be great with a like and follow when useful.
________________________________________________________________________________________________
ENTRY: 25850-26000
MINIMUM TARGET: 26900
STOP LOSS: 25395
MINIMUM RISK REWARD: 2.55
REASON: Double Bottom
________________________________________________________________________________________________
In this manner, thank you for watching and support for more market insight.
Information provided is only educational and should not be used to take action in the markets.
________________________________________________________________________________________________

DOW Elliott Wave Analysis for Tuesday 12/09/2023The primary expectation is now that we will go back into the wave ((b)) area to take out the previous high. That would mean we get an additional correction up as a wave ((b)). This move should be followed by further downside as a wave ((c)).

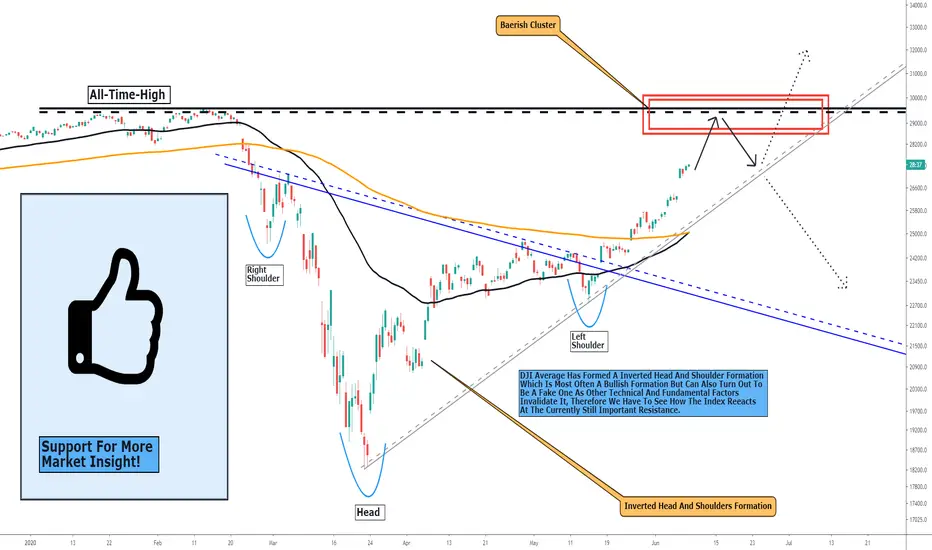
D-JONES, It Will Be An Huge Historical Test In Stock-History!Hello Traders Investors And Community, welcome to this analysis about the recent events, the current price-formation-structure and what we can expect the next times in one of the major leading stock-indices worldwide and one of the oldest participants in stock-markets the DOW JONES INDUSTRIAL AVERAGE, after we have seen the huge corona-crisis-breakdown which hit all global markets heavily we see a slowly moving uptrend right now, the big question which we have to ask our selves at the moment is if this uptrend is a stabile uptrend which will continue on a solid foundation or if it is just a huge bull-trap selling the shares to smart money on higher prices. As there are not only fundamental but also technical signals which I detected and which play an important role in the further outcome of the market we are looking at the 4-hour local timeframe.
When considering an index which builds the stock-market we have to also compare it with the current real economic situation and the things going on worldwide, and this situation is in fact a high volatile right now as the real economy is still damaged from the corona-crisis which has caused big failures due to lockdowns and the conservatism of the investors in this time. Also, we have massive protests going on worldwide which hasn't been seen since many 10th of years in that a mass-fashion. So taking all these factors together we can examine a divergence in the real economy and the stock market which shouldn't be the case because it is unnatural for the market and when it goes on for longer it has a big speculative impact on the market because the real economy isn't growing but the stock-market due to massive money printing from central banks, therefore, these two should build the same line together to provide a possibility for prosperity.
Technically speaking we see the index currently approaching a historical resistance level which is also the all-time-high-level you can see marked in my chart in red, when we approach this level firstly we can expect an pull-back because it is still a strong resistance level when this happened there are basically two possible scenarios which can play out within the index, once it is a second test of the resistance level where the price can succeed and make a new all-time-high to continue further and the second case will be that we break the current uptrend line you can see in my chart marked in grey to the downside which will cause bearish pressure and a test of the neckline of the inverted head and shoulder formation. When considering the bullish case it is important to keep in mind that the breakout needs to confirm with high volatility and sustainable price-action otherwise it can be a bull trap factly till the head and shoulders formation target confirmed.
It has to be noted that when we confirm a new high and advance further this will be a highly speculative rally as the real economy and the stock-market are still in divergence together firstly when these both run together we can get a healthy market environment. When considering the bearish side we can get bearish pressure after the uptrend line crossed to the downside, from that point it is possible for the index to test the neckline of the head and shoulder formation from where we can form a reversal and advance further but it can also turn out to come more bearish pressure to the downside which can invalidate the head and shoulder formation, therefore when we cross the 22690 mark to the downside this will get a definite bearish breakdown and need to be kept in the schedule for further considerations. At all the test of the resistance will be the critical factor in the further continuation of the index.
In this manner, thank you everybody for watching, support for more market insight and all the best!
There are many roads to prosperity in the modern economy, but one must be contemplated.
Information provided is only educational and should not be used to take action in the markets.
DOW Elliott Wave Analysis for Monday 11/09/2023 (+ Higher TF)For traders (lower timeframe):
The primary expectation is now that we will go back into the wave ((b)) area to take out the previous high. That would mean we get an additional correction up as a wave ((b)). This move should be followed by further downside as a wave ((c)).
For investors (higher timeframe):
In the higher timeframe, investors should wait for the completion of the abc pullback. The wave 2 area is a nice buying opportunity for investors.

DOW JONES - Streamlining My Long-Term View For Clarity..."As mentioned previously, I decided to take a hiatus from chart analysis to focus on personal growth. I'm committed to delivering high-quality insights and refuse to share subpar ideas just for the sake of it. Continuous improvement is my mantra, and stagnation isn't an option for me.
During this break, I've reevaluated my bearish stance to gain a fresh perspective. This shift in outlook has enabled me to grasp the potential bullish future of cryptocurrencies. Understanding the 'why' behind these possibilities has been crucial, and my chart-free period has been instrumental in achieving this clarity.

DOW JONES Bottom formation completed.Dow Jones / US30 has formed the 2nd leg of the bottom sequence on the Rising Support and the 0.236 Fibonacci level at the bottom of the Channel Up.
This is a similar formation to May, also on a Rising Support. Once the Falling Resistance broke, the price almost reached the 0.786 Fibonacci level, before making a Higher High.
The CCI between the two patterns is also indentical.
If the price crosses over the 4hour MA50, buy and target 35200.
Previous chart:
Follow us, like the idea and leave a comment below!!

DOW JONES: The Channel bottomed. Strong buy opportunity.Dow Jones is once more near the HL of the five month Channel Up. The neutral 1D technical outlook (RSI = 46.013, MACD = -68.570, ADX = 21.330) further suggests that this is a low risk buy opportunity. The HL on the 1D RSI is consistent with the trendlines of May 31st and March 22nd all of whom where bottoms. As long as the 1D MA100 holds, we will be on a long position aiming at a +6 rise in total (TP = 36,000).
Prior idea:
## If you like our free content follow our profile to get more daily ideas. ##
## Comments and likes are greatly appreciated. ##

DOW Elliott Wave Analysis for Friday 08/09/2023The primary scenario is playing out and we are reversing from the wave ((b)) area. More downside is expected. The surprise would be that we get a double correction to the upside.

DOW JONES Last buy opportunity on the 1D MA50.Dow Jones (DJI) got rejected on August 31 on the 4H MA200 (orange trend-line) and that made the price pull-back. We are now close to the 1D MA50 (red trend-line) again, which is where the initial rebound started on August 25, exactly at the bottom (Higher Lows trend-line) of the Channel Up.
This is the final buy opportunity on this pattern, as any closing below it would be a pattern invalidation and the trend would change to bearish on the long-term. Key to this, is the formation of a 4H Golden Cross, which could be only 4-5 days away. The last such formation was on June 09 and as with the one that preceded that, it will be a bullish signal.
We will wait for either a new 1D MA50 test or a completed 4H Golden Cross in order to buy with the lowest risk possible. Target 1 will be 36000 and Target 2 36900 (just below the All Time High).
-------------------------------------------------------------------------------
** Please LIKE 👍, FOLLOW ✅, SHARE 🙌 and COMMENT ✍ if you enjoy this idea! Also share your ideas and charts in the comments section below! **
-------------------------------------------------------------------------------
💸💸💸💸💸💸
👇 👇 👇 👇 👇 👇

DOW Elliott Wave Analysis for Thursday 07/09/2023The primary scenario is playing out and we are reversing from the wave ((b)) area. More downside is expected. The surprise would be that we get a double correction to the upside.

US30 Dow Jones Technical Analysis and Trade IdeaIt's evident that the US30 index has been confined within a tight trading range from the latter part of the Asian session leading up to the London Open. In the preceding week, we observed a notable price surge toward a critical resistance level, but that advance was met with resistance, and now the index appears to be consolidating sideways.
I'm actively scouting for a prospective trading opportunity for the upcoming week, and examining the chart to pinpoint the likelihood of an early-week stop run. If such an occurrence materialises, it could serve as an advantageous intraday trading opportunity. Please be aware that all comprehensive explanations are provided in the accompanying video, and it is crucial to note that this analysis should not be construed as financial advice.
