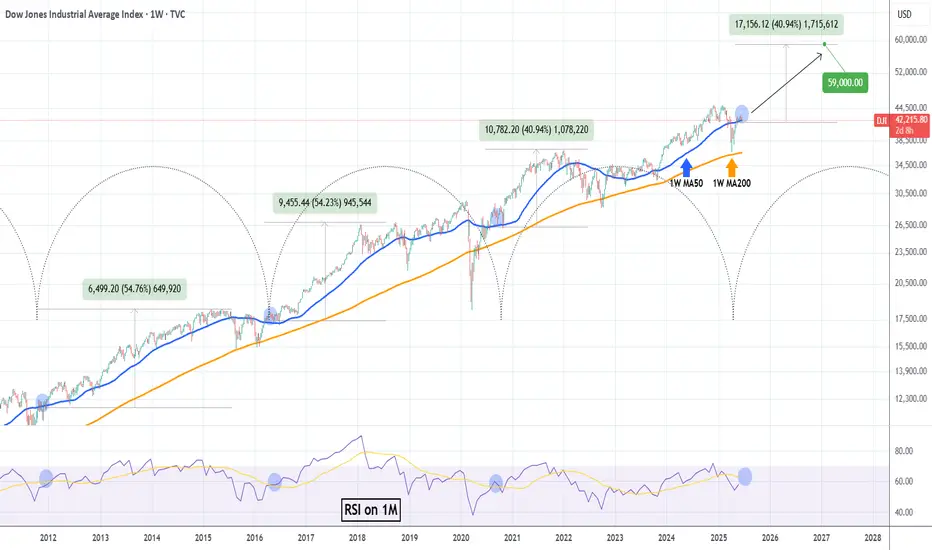
DOW JONES 15 year Cycles are coming to play.Dow Jones (DJI) is consolidating on its 1W MA50 (blue trend-line) for the past month. Based on a remarkable cyclical frequency as the Time Cycles show, every time this 1W MA50 consolidation takes place since October 2011, it turned into the long-term Support that supported rallies of at least +40.94%.
As their 1M RSI readings also sync, we can expect the current consolidation to end soon and drive the market to at least a +40.94% rise from the 1W MA50. Our long-term Target on this is 59000.
-------------------------------------------------------------------------------
** Please LIKE 👍, FOLLOW ✅, SHARE 🙌 and COMMENT ✍ if you enjoy this idea! Also share your ideas and charts in the comments section below! This is best way to keep it relevant, support us, keep the content here free and allow the idea to reach as many people as possible. **
-------------------------------------------------------------------------------
💸💸💸💸💸💸
👇 👇 👇 👇 👇 👇
DOW
DOW JONES: Will the 4H MA200 produce a rally?Dow is neutral on its 1D technical outlook (RSI = 51.949, MACD = 356.820, ADX = 20.639), trading between its 4H MA50 and MA200 in the past 2 days. The price just hit the 4H MA200 for the 2nd time again at the bottom of the Channel Up. As long as it holds, the pattern can initiate the new bullish wave. We exepct it to repeat the +3.74% rise of the one before, TP = 43,550.
See how our prior idea has worked out:
## If you like our free content follow our profile to get more daily ideas. ##
## Comments and likes are greatly appreciated. ##

DOW JONES Inverse Head and Shoulders close to a bullish breakoutDow Jones (DJI) has completed an Inverse Head and Shoulders (IH&S) pattern, having formed the Right Shoulder supported by the 1D MA50 (blue trend-line).
The price is now slowly rising to test the upper neckline and if broken, expect a strong movement upwards. Technically, such patterns target their 2.0 Fibonacci extensions. The current one is at 49200 and that's our long-term Target. If you seek lower risk, you may target the 1.5 Fib extension.
-------------------------------------------------------------------------------
** Please LIKE 👍, FOLLOW ✅, SHARE 🙌 and COMMENT ✍ if you enjoy this idea! Also share your ideas and charts in the comments section below! This is best way to keep it relevant, support us, keep the content here free and allow the idea to reach as many people as possible. **
-------------------------------------------------------------------------------
Disclosure: I am part of Trade Nation's Influencer program and receive a monthly fee for using their TradingView charts in my analysis.
💸💸💸💸💸💸
👇 👇 👇 👇 👇 👇

Dow Jones Struggles to Reach 43,000 PointsThe Dow Jones has gained more than 1% over the last three trading sessions and is now attempting to consistently reach price levels not seen since March of this year. The bullish bias has remained steady as investor confidence has recovered, driven by ongoing economic negotiations between the United States and China. The potential easing of trade tensions has helped stabilize market sentiment in the short term, and if this trend continues positively, consistent buying pressure could emerge in the index's movements over the near term.
Sustained Uptrend
Since early April, the Dow Jones has maintained a steady upward trend, and so far, selling corrections have been insufficient to break that trend. However, price action continues to face resistance at the trendline, and if this ongoing neutrality persists, the trendline could come under pressure in the coming sessions.
MACD
The MACD histogram continues to oscillate very close to the neutral 0 line, indicating that momentum between the moving averages remains balanced. As long as this behavior persists, the current neutral tone could become even more pronounced in upcoming sessions.
ADX
The ADX line remains below the neutral 20 level in the short term, signaling that average volatility has been steadily decreasing over the past sessions. This has further intensified the market’s neutral tone near the current resistance zone where the price is trading.
Key Levels:
42,700 points: Current resistance zone, aligned with the recent multi-week highs. This level could become the base for a broader short-term consolidation.
43,800 points: A level not seen since February of this year. A return to this area could reinforce the bullish bias and support a more sustained upward trend.
41,000 points: A critical support level that coincides with the 200-day simple moving average. A move toward this level on the downside could threaten the current bullish structure.
Written by Julian Pineda, CFA – Market Analyst

Dow Jones H1 | Overlap support at 50% Fibonacci retracementThe Dow Jones (US30) is falling towards an overlap support and could potentially bounce off this level to climb higher.
Buy entry is at 42,562.05 which is an overlap support that aligns with the 50.0% Fibonacci retracement.
Stop loss is at 42,196.55 which is a level that lies underneath a swing-low support and the 61.8% Fibonacci retracement.
Take profit is at 42,865.41 which is a multi-swing-high resistance.
High Risk Investment Warning
Trading Forex/CFDs on margin carries a high level of risk and may not be suitable for all investors. Leverage can work against you.
Stratos Markets Limited (tradu.com ):
CFDs are complex instruments and come with a high risk of losing money rapidly due to leverage. 63% of retail investor accounts lose money when trading CFDs with this provider. You should consider whether you understand how CFDs work and whether you can afford to take the high risk of losing your money.
Stratos Europe Ltd (tradu.com ):
CFDs are complex instruments and come with a high risk of losing money rapidly due to leverage. 63% of retail investor accounts lose money when trading CFDs with this provider. You should consider whether you understand how CFDs work and whether you can afford to take the high risk of losing your money.
Stratos Global LLC (tradu.com ):
Losses can exceed deposits.
Please be advised that the information presented on TradingView is provided to Tradu (‘Company’, ‘we’) by a third-party provider (‘TFA Global Pte Ltd’). Please be reminded that you are solely responsible for the trading decisions on your account. There is a very high degree of risk involved in trading. Any information and/or content is intended entirely for research, educational and informational purposes only and does not constitute investment or consultation advice or investment strategy. The information is not tailored to the investment needs of any specific person and therefore does not involve a consideration of any of the investment objectives, financial situation or needs of any viewer that may receive it. Kindly also note that past performance is not a reliable indicator of future results. Actual results may differ materially from those anticipated in forward-looking or past performance statements. We assume no liability as to the accuracy or completeness of any of the information and/or content provided herein and the Company cannot be held responsible for any omission, mistake nor for any loss or damage including without limitation to any loss of profit which may arise from reliance on any information supplied by TFA Global Pte Ltd.
The speaker(s) is neither an employee, agent nor representative of Tradu and is therefore acting independently. The opinions given are their own, constitute general market commentary, and do not constitute the opinion or advice of Tradu or any form of personal or investment advice. Tradu neither endorses nor guarantees offerings of third-party speakers, nor is Tradu responsible for the content, veracity or opinions of third-party speakers, presenters or participants.

DOW JONES: Turning sideways for summer. Massive rise afterwards.Dow Jones is bullish on its 1D technical outlook (RSI = 58.389, MACD = 425.040, ADX = 23.083) but 1W is neutral, a natural outcome of the ranged trading within the 1D MA200 and 1D MA50in the last 3 weeks. It is possible to see the index staying sideways until the end of August and then attempt to complete a +39.50% rise from its bottom, like both prior bullish waves did. Regardless of this a test of the Channel Up top trendline, gives us a fair TP = 48,000 for the end of the year.
## If you like our free content follow our profile to get more daily ideas. ##
## Comments and likes are greatly appreciated. ##

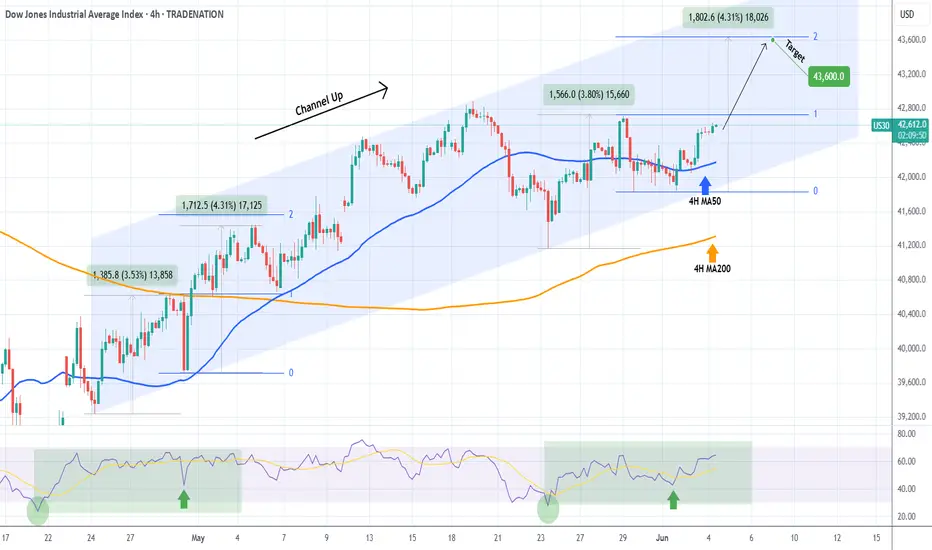
DOW JONES starting the new Bullish Leg.Dow Jones (DJI) is rallying off its 4H MA50 (blue trend-line), shortly after making a new Higher Low on its 6-week Channel Up. Technically that is the start of its new Bullish Leg.
With the 4H RSI being identical to the Bullish Leg at the start of the Channel Up, we expect it to again rise by +4.30% and touch the 2.0 Fibonacci extension. Target 43600.
-------------------------------------------------------------------------------
** Please LIKE 👍, FOLLOW ✅, SHARE 🙌 and COMMENT ✍ if you enjoy this idea! Also share your ideas and charts in the comments section below! This is best way to keep it relevant, support us, keep the content here free and allow the idea to reach as many people as possible. **
-------------------------------------------------------------------------------
Disclosure: I am part of Trade Nation's Influencer program and receive a monthly fee for using their TradingView charts in my analysis.
💸💸💸💸💸💸
👇 👇 👇 👇 👇 👇
US30 – Key Resistance at 42690 Ahead of ADP-Driven VolatilityUS30
The indices market is expected to be highly volatile today due to upcoming data releases, especially the ADP employment report.
Dow Jones (US30) appears to be continuing its bullish scenario toward 42690.
A break above 42690 may push the price further toward 42810, and if momentum holds, toward 43200.
However, stability below 42690 could trigger a strong correction toward 42460.
A sustained move below the pivot line at 42570 would shift the trend to bearish.
Resistance: 42690, 42810, 43200
Support: 42460, 42260, 42080

DOW JONES TO 111 THOUSAND..in the the 2030's.
as an investor you must be thinking 2 decades down the line.
NOT 2 quarters.
They can not
stop
printing #FIAT
it's in the code.
A 8% compound rate puts the Dow Jones at 85,000 in 2034.
I'm long forever.

DOW JONES: Inverse Head and Shoulders looking for a breakout.Dow Jones is marginally bullish on its 1D technical outlook (RSI = 55.600, MACD = 267.860, ADX = 21.901) as just now it is attempting to be detached from the 4H MA50. Technically this could be the attempt to break towards the 2.0 Fibonacci extension, after having formed the RS of an Inverse head and Shoulders pattern. With the 4H MACD close to a Bullish Cross, we are bullish, TP = 44,250.
## If you like our free content follow our profile to get more daily ideas. ##
## Comments and likes are greatly appreciated. ##

DOW JONES: Channel Up targeting 43,400.Dow Jones is practically neutral on its 1D technical outlook (RSI = 55.880, MACD = 380.350, ADX = 13.770) as the price is consolidating on its 4H MA50. Despite the neutrality, it remains inside the Channel Up, that is supported by the 4H MA200 and whose 4H RSI squeeze indicates we might be on a similar slow uptrend as late April's. We expect a similar +5.60% rise from the HL bottom, TP = 43,300.
## If you like our free content follow our profile to get more daily ideas. ##
## Comments and likes are greatly appreciated. ##

The Dow Jones Begins to Stabilize Around 42,500 PointsThe U.S. index has halted the advance of its recent bullish moves near this resistance zone, mainly because the market is awaiting the release of the Federal Reserve minutes later today, along with Nvidia’s earnings report, expected after the stock market close. For now, investor anticipation has created a neutral sentiment in the index's recent movements as it approaches the 42,500-point resistance, and these upcoming events are likely to provide deeper insight into the market’s direction in the coming sessions.
Possible Bullish Channel
Since early April, the Dow Jones has shown consistent buying movements, attempting to maintain a potential bullish channel. So far, there have been no signs of significant bearish corrections in the price, which suggests that the current bullish pattern remains the dominant structure to monitor in the short term. However, a strong selling correction could put this trend at risk.
Neutrality Intensifies:
MACD: The MACD histogram continues to hover around the zero line, reflecting a sustained equilibrium in the momentum of the moving averages. This highlights a lack of clear direction in the market over the short term.
ADX: The ADX line remains below the 20 level, indicating that volatility is low, a condition not seen since February of this year.
Both indicators point to persistent neutrality, likely driven by market indecision ahead of key fundamental events, as well as the technical resistance zone, which is currently limiting price advances.
Key Levels to Watch:
42,500 points: Current resistance level aligned with the 200-period moving average. It may act as a potential point for bearish corrections.
43,800 points: A distant resistance level not seen since February. If the price rallies to this level, it could reinforce the current bullish formation and strengthen the prevailing upward channel.
41,100 points: A key support aligned with the 50-period moving average. A drop near this level could jeopardize the bullish formation and potentially shift momentum toward a bearish bias.
Written by Julian Pineda, CFA – Market Analyst

DOW JONES Holding the 1D MA50 can propel it to 45000.Dow Jones (DJI) contained Friday's Trump-led pull-back just above its 1D MA50 (blue trend-line), marking the strongest correction since April 21. So far that is purely a technical reaction to the Resistance 1 (42855) rejection a day earlier.
This is forming an Inverse Head and Shoulders (IH&S) but above all, as long as the 1D MA50 holds, it is a bullish continuation of April's rebound/ Bullish Leg at the bottom of the long-term Bullish Megaphone pattern and on the 1W MA200 (red trend-line).
As you can see, the 1W MA200 has been the ultimate Support of this pattern and last time it started a rebound that broke above the 1D MA50 and retested it, was on the first Bullish on November 09 2023.
That pull-back held the 1D MA50 and the price action continued the bullish trend until it completed a +23.69% rise, before the next 1D MA50 break.
As a result, as long as the 1D MA50 holds, we expect at least another +23.69% rise on the medium-term, which this times falls on the Resistance 2 level (45100), aligning perfectly for a technical test. Our Target will be a little lower at 45000.
-------------------------------------------------------------------------------
** Please LIKE 👍, FOLLOW ✅, SHARE 🙌 and COMMENT ✍ if you enjoy this idea! Also share your ideas and charts in the comments section below! This is best way to keep it relevant, support us, keep the content here free and allow the idea to reach as many people as possible. **
-------------------------------------------------------------------------------
Disclosure: I am part of Trade Nation's Influencer program and receive a monthly fee for using their TradingView charts in my analysis.
💸💸💸💸💸💸
👇 👇 👇 👇 👇 👇

DOW JONES Inverse Head and Shoulders starting new rally.Dow Jones/ US30 has found support today on its 1day MA50 despite the strong correction.
The long term pattern is an Inverse Head and Shoulders and today's 1day MA50 hold may complete its Right Shoulder.
Go long and target the 2.0 Fibonacci extension at 50000.
Follow us, like the idea and leave a comment below!!

DOW JONES new Bull Cycle has started.Dow Jones / US30 has now crossed above its 1week MA50 and has restored the long term bullish trend.
That trend was in risk of getting invalidated but last month's rebound at the bottom of the long term Channel Up and holding Support A, kickstarted the new Bull Cycle.
Every Support A rebound inside this Channel Up technically started a new Bull Cycle.
The less aggressive of those was +57.76%.
This is where long term investors buy and target 57700.
Previous chart:
Follow us, like the idea and leave a comment below!!

DOW JONES: Looks to extend gains to 43,500Dow Jone remains bullish on its 1D technical outlook (RSI = 62.492, MACD = 410.840, ADX = 32.007) as it maintains the medium term bullish trend inside its 1 month Channel Up. Since the index kept the 4H MA50 intact, it established it as its Support and is now halfway on the new bullish wave. The 2 prior rose by +4.30%, which gives a clear technical target (TP = 43,500)for the next HH.
## If you like our free content follow our profile to get more daily ideas. ##
## Comments and likes are greatly appreciated. ##
Dow ready to go above 200 MA?The Dow has been coiling for the past few days underneath its 200-day moving average, as it watched the tech-heavy Nasdaq 100 break higher. But yesterday support at 41,780 held and this led to a strong bounce. The resulting price action created a hammer candle on the daily time frame. With this latest bull signal, can the index now break above its 200 MA and move higher? The underlying trend is looking increasingly bullish.
By Fawad Razaqzada, market analyst with FOREX.com

Bearish Forecast for the Dow Jones Starting May 15, 2025Bearish Forecast for the Dow Jones Starting May 15, 2025
The Dow Jones Industrial Average is poised to begin a significant decline, potentially as early as today, May 15, 2025, targeting a retest of the price low from April 7, 2025 (~36,611.78), and possibly lower. This movement is driven by renewed trade tensions, disappointing economic data, and bearish market sentiment.
1. Fundamental Factors Driving Potential Decline
Fundamental factors provide the macroeconomic and policy-driven rationale for the anticipated downturn in the Dow Jones.
1.1. Renewed Uncertainty in Trade Policy
The Dow’s rally on May 12–13, 2025, was fueled by optimism over a temporary U.S.-China tariff reduction agreement (90-day truce) announced after talks in Switzerland on May 11, 2025. However, as of May 15, 2025, investor confidence is faltering due to a lack of progress in ongoing U.S.-China trade negotiations.
Trigger for May 15: A Reuters report from May 14, 2025, notes that U.S. Trade Representative Jamieson Greer and Treasury Secretary Scott Bessent are meeting with Chinese officials, but no new agreements have been confirmed. If today’s talks fail to deliver positive outcomes or if President Trump escalates tariff rhetoric, the Dow could plummet, as seen in early April when tariffs triggered a 5.5% single-day drop. The Dow, with its heavy weighting of multinational corporations, is particularly vulnerable to trade war fears, which could drive it toward the April 7 low as investors price in higher costs and slower global growth.
1.2. Disappointments in Economic Data
CPI Reaction: The April 2025 Consumer Price Index (CPI), released on May 14, 2025, showed inflation at 2.3% annually, below the expected 2.4%. However, the Dow’s decline (-0.6%) on May 14 suggests investors expected a lower figure to support Federal Reserve rate cuts, reflecting skepticism about inflation cooling further.
Producer Price Index (PPI) Release on May 15: The PPI for April 2025, due at 8:30 AM ET (2:30 PM CEST) on May 15, 2025, is critical. A higher-than-expected PPI, potentially driven by tariff-related cost pressures, could signal rising consumer prices, reducing hopes for Fed easing and triggering a sell-off. Consensus expects a 0.2% monthly increase; a reading above 0.3% could echo the April market reaction when GDP contraction fears pushed the Dow to 36,611.78.
Consumer Sentiment: The University of Michigan Consumer Sentiment Index for May 2025, released on May 14, likely showed continued weakness (April: 52.2, a multi-year low). A further decline could heighten concerns about reduced consumer spending, impacting Dow components like Walmart and Home Depot.
1.3. Concerns Over Federal Reserve Policy
On May 7, 2025, Fed Chair Jerome Powell cited “elevated uncertainty” due to trade policies, with markets expecting 75 basis points of rate cuts in 2025, starting in July. If today’s PPI or Initial Jobless Claims (8:30 AM ET) indicate persistent inflation or economic weakness, rate cut expectations could fade, increasing borrowing costs and pressuring Dow valuations, mirroring the April 7 recession fears.
2. Technical Analysis
The Dow’s initial decline in April was approximately -19.00%, with a second impulse of similar magnitude. Technical indicators suggest a bearish setup for May 15, 2025:
Current Level: The Dow closed at 42,051.06 on May 14, 2025, down 0.6%, testing support at 42,000.
Bearish Signals: A 12-hour timeframe analysis indicates alignment for a decline, with potential bearish candlestick patterns (e.g., bearish engulfing) and overbought RSI (70). A break below 42,000 could target the 200-day moving average (40,500) and the April 7 low of 36,611.78.
Price Targets:
Retest of April 7, 2025, low: ~36,611.78
Secondary target: ~35,970.70 (based on Fibonacci extensions and prior support zones).
3. Market Sentiment and Behavioral Factors
Fragile Optimism: The Dow’s 15% recovery from April lows was driven by trade truce hopes and select stock strength. Bloomberg’s May 14, 2025, report notes Wall Street’s rebound is “showing signs of exhaustion” due to trade risks. The Dow’s May 14 weakness, led by an 18% UnitedHealth drop, could spread if negative news emerges today.
Global Correlation: Mixed Asian market performance on May 14 (e.g., Nikkei up 1.43%, India’s Nifty 50 down 1.27%) suggests vulnerability. A lower Asian open on May 15, driven by U.S. declines or trade news, could amplify selling pressure on the Dow.
4. Evidence-Based Framework for the Forecast
4.1. Catalysts for Today’s Decline (May 15, 2025)
PPI Data (8:30 AM ET): A PPI reading above 0.3% could signal sticky inflation, reducing Fed rate cut odds and sparking a sell-off.
Trade Talk Updates: Negative U.S.-China trade comments (e.g., no Geneva deal) could reignite fears, mirroring April 7.
Initial Jobless Claims (8:30 AM ET): Claims above 220,000 (vs. prior 211,000) could signal labor market weakness, fueling recession concerns.
4.2. Dow Scenario
Expect a wave-like decline with corrections. The Dow could fall below 36,611.78, potentially reaching ~35,970.70 if trade and economic pressures intensify. Extreme caution is advised in 2025.
4.3. Global Scenario for S&P 500
I anticipate a wave-like decline with intermittent corrections. I wouldn’t be surprised if the S&P 500 falls below 4,700, potentially reaching 4,200. Extreme caution is warranted this year. There’s even a theory that, starting in 2025, the U.S. dollar could lose 50% of its purchasing power.
Idea:
New Screenshot:
4.4. Oil and Geopolitical Outlook
I expect oil (Brent) to decline to the $50+/- range, from which an upward trend may begin, potentially tied to future military conflicts:
· Europe vs. Russia
· India vs. Pakistan
· Iran vs. Israel
Brent (UKOIL):
Natural Gas:

DOW JONES History shows that we're now targeting 68000.Dow Jones (DJI) recovered its 1W MA50 (blue trend-line), sending a clear technical message that the 'Trade War' correction is over and the long-term bullish trend has been resumed.
The bottom of that correction was on the 1W MA200 (orange trend-line), which has been the absolute long-term Support trend-line for the index, having broken by a large extent only during the March 2020 COVID crash.
That was also a bottom for Dow's Bullish Megaphone pattern. The last time that the index handed a 1W MA200 bottom while trading within a Bullish Megaphone was on February 08 2016. On both bottoms, the 1W RSI hit the 30.00 oversold barrier.
In 2016 that bottom rebound initiated a (blue) Channel Up that lasted for almost 2 years and peaked on the 3.0 Fibonacci extension level. If Dow continues to replicate that pattern, we are looking at a 68000 Target (Fib 3.0 ext) by mid-2027.
-------------------------------------------------------------------------------
** Please LIKE 👍, FOLLOW ✅, SHARE 🙌 and COMMENT ✍ if you enjoy this idea! Also share your ideas and charts in the comments section below! This is best way to keep it relevant, support us, keep the content here free and allow the idea to reach as many people as possible. **
-------------------------------------------------------------------------------
💸💸💸💸💸💸
👇 👇 👇 👇 👇 👇

Trade Idea: US30 Long (BUY LIMIT)Justification:
Technical Analysis:
1. Daily Chart:
• Strong bullish reversal from recent lows.
• MACD is crossing up sharply, showing fresh bullish momentum.
• RSI at 62.33 — rising but not yet overbought (room to run).
• Price reclaiming key moving averages.
2. 15-Minute Chart:
• Clear uptrend continuation.
• MACD and RSI confirm bullish momentum.
• Price consolidating at recent highs — potential breakout formation.
3. 3-Minute Chart:
• Short-term consolidation near highs with low RSI (38.84) — possible dip-buy opportunity.
• MACD near zero — primed for a new short-term wave.
Fundamental Analysis (as of early May 2025 context):
• Likely market optimism surrounding softer inflation data and potential rate cuts.
• Dow components (industrials, financials) benefit from economic soft-landing expectations.
• VIX (if tracked) remains subdued, confirming risk-on sentiment.
⸻
Trade Plan (Long):
• Entry: 42,360
Near current consolidation zone on lower timeframes.
• Stop Loss (SL): 41,850
Below recent swing lows and key moving average support (approx. 510 pts risk).
• Take Profit (TP): 43,380
Targeting previous resistance area on the Daily chart (approx. 1020 pts reward).
FUSIONMARKETS:US30

DOW JONES: Breached the 1D MA200. Tariff War 2018 Recovery aheadDow Jones is on excellent bullish levels on its 1D technical outlook (RSI = 62.103, MACD = 203.720, ADX = 34.693) and as it crossed today above the 1D MA200 for the first time since April 2nd, and practically validates the recovery from the Tariff War correction, it draws strong comparisons with the last U.S.-China Tariff War in 2018. Both rebounded after highly oversold 1D RSI levels, and the 2019 recovery almost hit the 0.9 Fibonacci level before turning into a less aggressive recovery. The trade is long, TP = 44,100.
## If you like our free content follow our profile to get more daily ideas. ##
## Comments and likes are greatly appreciated. ##

Dow Jones Correction in May 2025: Key DriversDow Jones Correction in May 2025: Key Drivers
Summary: The Dow Jones Industrial Average (DIA) is under pressure and likely headed for a correction due to the Federal Reserve’s tight monetary policy, trade uncertainty from Trump’s tariffs, and weak economic data.
Key Drivers:
➖ Federal Reserve Policy: At the May 6–7 meeting, the Fed is expected to maintain the 4.25–4.5% interest rate due to persistent inflation (2.7% forecast for 2025) and a robust labor market (+177K jobs in April). This dampens hopes for rate cuts, pressuring stocks.
➖ Trump’s Tariffs: New tariffs raise inflation risks and recession fears, reducing the appeal of Dow Jones constituents like Caterpillar and Walmart.
➖ Weak GDP and Global Volatility: A 0.3% GDP contraction in Q1 2025 and declines in Asian markets (1.6–1.8%) signal global instability.
➖ Technical Indicators: DIA trades below its 200-day moving average (~420 USD), with fewer stocks above this level (down from 76% to 55% since January), indicating market weakness.
➖ Outlook: Analysts (Long Forecast) predict volatility, with a potential drop to 38,958 in May, despite an average forecast of 43,370 by month-end. Historically, corrections occur every 1.88 years, and current conditions (tariffs, inflation, GDP) heighten the likelihood of a 10–15% decline.
Target: My downside target for the Dow Jones is 38,555.00.
Current factors and historical trends strongly suggest a near-term correction.
Idea for S&P 500:

DOW JONES Can this Channel Up hold after the Fed Rate Decision?Dow Jones (DJIA) has been trading within a Channel Up since the April 24 Low and yesterday's correction (technically its Bearish Leg) stopped on the 4H MA50 (blue trend-line). Having formed already a Golden Cross, as long as this 4H MA50 holds, it should technically fuel the pattern's new Bullish Leg.
The 'weakest' Bullish Leg within this Channel Up has been +3.58%, so we expect a minimum repeat of that, giving a Target at 42100 on the short-term. This falls perfectly at the bottom of the 5 week Resistance Zone.
If this Channel Up doesn't get invalidated after today's Fed Rate Decision, it will most likely push the price there.
-------------------------------------------------------------------------------
** Please LIKE 👍, FOLLOW ✅, SHARE 🙌 and COMMENT ✍ if you enjoy this idea! Also share your ideas and charts in the comments section below! This is best way to keep it relevant, support us, keep the content here free and allow the idea to reach as many people as possible. **
-------------------------------------------------------------------------------
💸💸💸💸💸💸
👇 👇 👇 👇 👇 👇
