DOW JONES is aiming at a new Low unless the Resistance breaks.Dow Jones is trading inside the corrective wave of the long term Channel Up.
As long as Resistance A (34575) holds, sell and target the Channel's bottom and 1day MA100 at 33500.
If the Resistance A breaks, buy and target 34850.
For a long term buy, always look to buy inside the 4hour RSI's buy zone, which is on oversold territory.
Previous chart:
Follow us, like the idea and leave a comment below!!
DOW

DOW Elliott Wave Analysis for Wednesday 05/07/2023We have to wait for the next ABC pullback. When we have a clear ABC, we can go long again.

Dow jones buyIm buying this currency pair based of monthly key levels and the consistent higher highs on a daily time frame, it has higher lows also so i dont want to be caught selling.

DOW Elliott Wave Analysis for Monday 04/07/2023We have to wait for the next ABC pullback. When we have a clear ABC, we can go long again.

DOW JONES Take profit soon. Pull back expected.Dow Jones is almost on Resistance (1) at 34530 with the top of the dotted Channel Up just over it at 34700.
That is a level where the buy profits from the MA50 (1d) buys should be realized and then wait for a break out or pull back in order to continue buying.
Trading Plan:
1. Sell within 34600 - 34700.
2. Buy if the (1d) candle closes over 34700.
3. Buy on the MA200 (1d) at 33500.
Targets:
1. 33500 (MA200 1d).
2. 35400 (near the top of the yellow long term Channel Up).
3. 34900 (Resistance 2).
Tips:
1. The RSI (1d) is posting a sequence similar to the February top. That started a significant medium term correction.
Please like, follow and comment!!
Notes:
Past trading plan:

DOW Elliott Wave Analysis for Monday 03/07/2023We have to wait for the next ABC pullback. When we have a clear ABC, we can go long again.

DOW, Lower high with a deviation. DOW / 4H
Hello traders, welcome back to another market breakdown.
Dow jones index has been dealing with a deep pull-back, the price seems to find support around the previous pivotal point.
I'll be intersted to get in bull-backs, double bottoms, micro-double bottom...
Trade safely,
trader Leo.

DOW Elliott Wave Analysis Higher Timeframe (01/07/2023)The DOW looks bullish and might be preparing for a Wave 3 to the upside. However, the minimum requirements for a Wave 2 to the downside were not fulfilled. As long as we do not take out the Wave 1 high, it could be that we still make a new low as a Wave 2.

Dow Jones Industrials suddenly not looking too shabbyThe Dow Jones has been out on vacation for the first half of this year, not really participating in the melt-up, and instead, consolidating and working off that sharp rally from Q4 2022.
After all, it was one of the first indexes to bottom from the depths of the bear and start leading things higher.
But now after all of this sideways consolidation, it's starting to offer up a favorable reward-to-risk if it can build momentum over 34,500.
Perhaps a possible rotation into YTD leaders and back into industrials for the second half of the year? I'm not so sure about that yet, but it's a chart worth paying attention to.

Trading week recap for NASDAQ, DOW, DAX & FTSE (01/07/2023)We had successful trades with the NASDAQ and the DAX. Let's look back at the past trading week and learn from it. What went well? What could be better?
This is an experiment. Educational content to become a good waver. If you like this video, please let me know by commenting. Any suggestions? Please let me know.
Something went wrong with the recording for the last part on the FTSE. We continue the analysis on Monday.

DOW Elliott Wave Analysis for Friday 30/06/2023A pullback is ongoing in the lower timeframe. We see an opportunity for a long trade.

DOW JONES: Bullish as long as 1D MA50 holds. Bearish if broken.Dow Jones turned flat following the rebound on the 1D MA50 three days ago with both the 4H and 1D technicals neutral (RSI = 53.777, MACD = 111.180, ADX = 25.084). As long as the 1D candles closes over the 1D MA50, stay bullish and target the R2 (TP = 34,950). A crossing under the 1D MA50 will most likely target the 1D MA200 and possibly even lower at the bottom of the diverging Channel Up, aiming to complete a -5% decline (TP = 33,000). That can be an excellent long term buy entry. However if the RSI rebounds on its HL trendline, then enter the buy earlier regardless of a 1D MA200 hit or not.
Prior idea:
## If you like our free content follow our profile to get more daily ideas. ##
## Comments and likes are greatly appreciated. ##

DOW Elliott Wave Analysis for Thursday 29/06/2023A pullback is ongoing in the lower timeframe. We see an opportunity for a long trade.

DOW Elliott Wave Analysis for Wednesday 28/06/2023A pullback is ongoing in the lower timeframe. We see an opportunity for a long trade.

DOW Elliott Wave Analysis for Tuesday 27/06/2023A pullback is ongoing in the lower timeframe. We see an opportunity for a long trade.

DOW Elliott Wave Analysis for Monday 26/06/2023A pullback is ongoing in the lower timeframe. We see an opportunity for a long trade.

DOW Elliott Wave Analysis Higher Timeframe (24/06/2023)The DOW looks bullish and might be preparing for a Wave 3 to the upside. However, minimum requirements for a Wave 2 to the downside were not fullfilled. As long as we do not take out the Wave 1 high, it could be that we still make a new low as a Wave 2.

DOW JONES - The hidden truth in a large complex correctionAs a trader, I've always been fascinated by market indexes and the insights they provide. The Dow Jones Industrial Average (DJIA), affectionately known as the "Dow" or "Dow Jones" by some, is undoubtedly one of the most closely watched indexes. It consists of 30 large, publicly traded companies based in the United States, making it a useful barometer for the overall health of the stock market and the US economy.
Throughout 2022, the Dow Jones, like many other indexes, experienced a downward trend. But something remarkable happened in November 2022 – a strong uptrend emerged, breaking the resistance level that had been a formidable barrier in January, April, and August of that year. This shift signaled a potential change in market sentiment, as the index successfully retested the breakout level in March 2023.
Fast forward to today, and we find ourselves up against yet another level of resistance, evident on the chart when we reached 34,100 points just a couple of weeks ago. The big question on everyone's mind is whether the Dow will break through this time. Analyzing the market structure from November 2022 to March 2023, we observe what appears to be a corrective pattern, possibly an ABC or WXY correction. Although I won't delve into the specifics of the subdivisions, it's clear that this correction took several months to play out.
Now, as we approach the 2023 highs, it's crucial to recognize the current market conditions. Despite a prevailing bearish sentiment, the bulls seem to be in control. The bears may need to see a pullback to around 32,800 points to be satisfied – a move that would create a textbook inverted head and shoulders pattern, however this time as a continuation pattern rather than a reversal. Compare to the Apple, Inc idea I shared weeks ago.
If this scenario plays out , the target could be a retest of the all-time high for the DJI index, approximately 37,000 points. This move could catch bears off guard and lead to widespread bullish sentiment , potentially draining the accounts of the bears before the financial crisis catches up with us.
As beginner or intermediate traders, it's essential to stay informed about market trends and patterns. Observing indexes like the DJI can help you make better-informed decisions in your trading journey. While no one can predict the future with certainty, understanding market dynamics and key resistance levels can provide valuable insight into possible market scenarios. Always remember to trade responsibly and consider the risks involved.

DOW Elliott Wave Analysis for Friday 23/06/2023Although the DOW looks bullish in the higher timeframe, we expect a pullback in the lower timeframe. We see two areas where to go long. Traders can choose a shallow retracement (wave 4) or a deeper retracement (wave 2).

DOW JONES Double buy entry on the MA50 and MA200 (1d).Dow Jones got heavily rejected on Resistance (1) and is pulling back to the MA50 (1d).
The index is trading inside a double Channel Up pattern.
The MA50 and MA200 (1d) each serve as a Support level and potential buy entry.
The pattern so far is much alike the December 20th - January 20th fractal and that dipped much lower after its rejection.
Trading Plan:
1. Buy on the MA50 (1d).
2. Sell if the (1d) candle closes under the MA50 (1d).
3. Buy on the MA200 (1d).
Targets:
1. 34530 (Resistance 1).
2. 33000 (MA200 1d and bottom of white Channel Up).
3. 34800 (under Resistance 2).
Tips:
1. The RSI (1d) is printing an identical pattern to December - January so far. This favors a rebound but from a lower level such as the MA200 (1d).
Please like, follow and comment!!
Notes:
Past trading plan:

DOW Elliott Wave Analysis for Thursday 22/06/2023Although the DOW looks bullish in the higher timeframe, we expect a pullback in the lower timeframe. We see two areas where to go long. Traders can choose for a shallow retracement (wave 4) or a deeper retracement (wave 2).

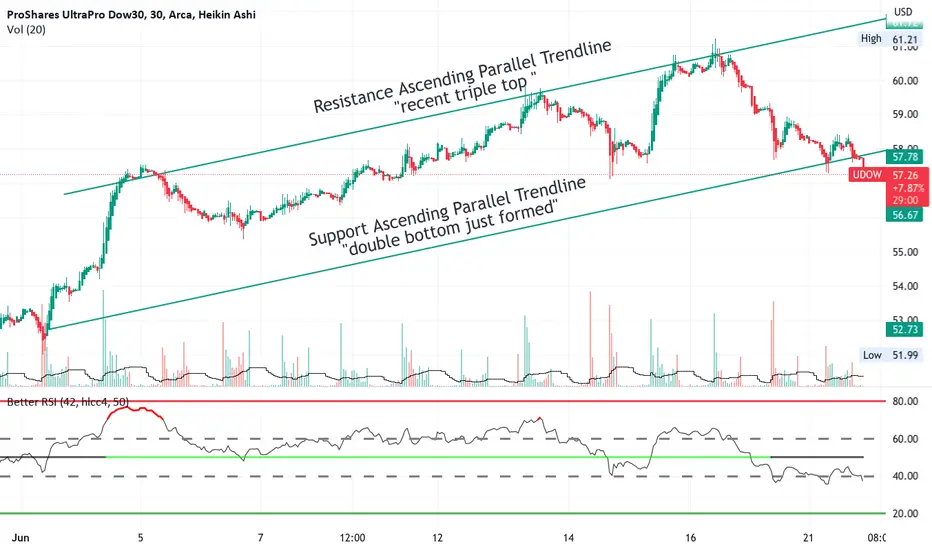
UDOW a triple leveraged ETF of the DOW indexUDOW is shown here on the 30-minute chart rising over the past month in an ascending
parallel channel. The chart shows the price currently situated near to the bottom of
the channel which is the support trendline drawn onto the chart with the resistance
trendline as well. My trading plan is I will take a long trade of 50 shares with a stop loss
immediately below the support trendline. I see a targets as $ 62 and $ 65 making for
a very favorable reward for the risk taken. For the entry, I will use the 5- minute chart
and enter when the HA candles are green and the RSI is above 50. I realize that the DOW
has less volatility than the S & P or NASDAQ but with that is less overall risk of reversals
and pullbacks. I tend to take higher-risk trades but see this as having a balancing effect
in my overall portfolio.
DAX technical say = pick buy above green arrow personally I belive Dax going to 19000 area(filo 161% weekly show 19000) , so be careful from any sell
above 3 green arrow , when on 15-60-240-daily you see buypinbar, dont fear buy with SL in pinbar low, understand?
wish you win
