Dow Jones - DIA DJIBoy, are these markets something else. Since before 2008, markets correlated relatively close to economic data. Since the introduction of Fed intervention with slashed rates and Quantitative Easing, "markets" were able to "shrug" off even the worst geopolitical and economic events. In fact, it defies all logic.
Logically, markets can and should ignore all TA when an economy is hurting significantly. There isn't a bright spot in the economic data. The consumer is badly beaten and barely holding on. Discretionary spending, credit card debt, personal debt, consumer sentiment, and consumer confidence show us that the average American is at their limit for what they can spend and do. A new study showed that 1 in 4 Americans are skipping Thanksgiving Dinner altogether because of the costs. Keep in mind the collapsing retail, collapsing freight by sea, and now the threat of rail strikes in December which is quickly becoming a reality.
This of course is one of countless statistics that show the pain of average American. Other statistics show savings rates have plummeted and credit card debt is at record levels as people's pay-checks are no longer covering their expenditures.
We've about peaked in this market, looking at a double top from August 2022.. but again, TA doesn't matter as it did before. MACD and RSI have PLENTY of room on the downside. Look at the economic data, even the TA for the short term and position accordingly.
This chart can and will most likely reflect majority of stocks from S&P, Nasdaq, QQQ, SPY, IWM or Russell 2000.
DOW


DOW JONES: Inverse Head and Shoulders possibleDow Jones may be close at completing an Inverse Head and Shoulders pattern while being bullish both on the 4H (RSI = 60.932, MACD = 165.930, ADX = 34.060) and the 1D timeframes. A pullback to 32,800 and then rebound would confirm that. Even without it, we are ready to buy the breakout above the Channel Down, targeting the bottom of the R1 Zone (TP = 34,350).
If the Inverse Head and Shoulders is indeed confirmed, we will target R3 and Fibonacci 2.0 by late May (TP = 35,900).
Prior idea:
## If you like our free content follow our profile to get more daily ideas. ##
## Comments and likes are greatly appreciated. ##

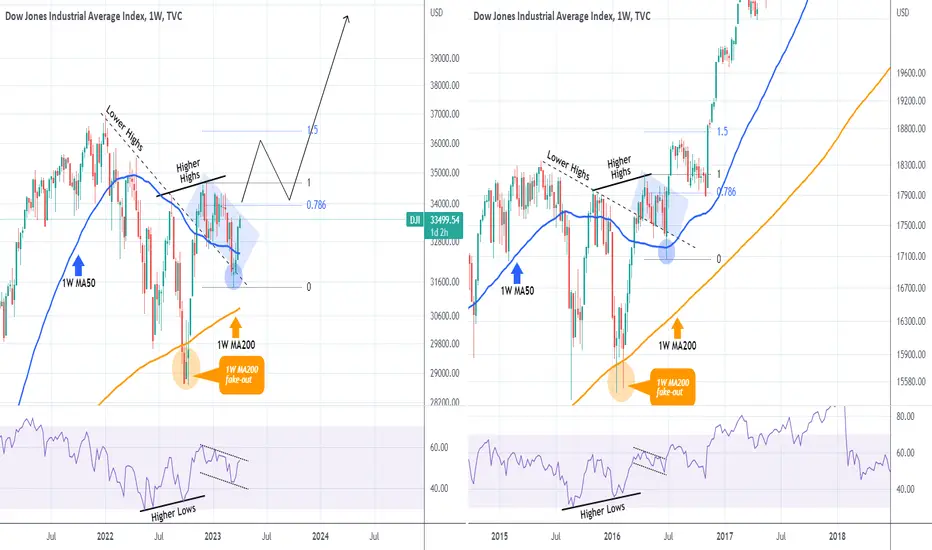
DOW JONES has started a rally that will amaze mostDow Jones is currently on the 3rd straight green 1W (weekly) candle above the 1W MA50 (blue trend-line), testing the top of the 4-month Channel Down. We have previously seen almost the same pattern during the 2015-2016 correction (E.U./ China/ Oil crisis). A fake-out below the 1W MA200 (orange trend-line) initiated a rebound above the correction's Lower Highs trend-line and formed a Channel Down.
This Channel Down in 2016 was nothing but a Bull Flag pattern which after another fake-out, this time below the 1W MA50, it rebounded and almost reached the 1.5 Fibonacci extension with a final pull-back on Fib 0.786 that kick-started a very aggressive rally. Even the 1W RSI patterns match. Do you think that's the blue-print for Dow?
-------------------------------------------------------------------------------
** Please LIKE 👍, FOLLOW ✅, SHARE 🙌 and COMMENT ✍ if you enjoy this idea! Also share your ideas and charts in the comments section below! **
-------------------------------------------------------------------------------
💸💸💸💸💸💸
👇 👇 👇 👇 👇 👇
DOW JONES Top of the Channel Down but will it stop there?Dow Jones reached today the top of the Channel Down pattern.
This is a rise almost proportional to July 14th-22nd (around 7%). Both crossed over the RSI Falling Resistance and at the same time the MA50 (1d).
Trading Plan:
1. Buy as long as the 1d candle close over the MA50 (1d).
2. Sell if it closes under.
Targets:
1. 34950 (Resistance 2).
2. 32600 (MA200 1d).
Tips:
1. RSI (1d) of the two rises is at the same level after the breakout. Also both started rising on the 30.00 level, giving us more the impression that they are indeed similar patterns under same market conditions.
Please like, follow and comment!!
Notes:
This is a continuation of this trading plan:

DJI Dow headed for a correction.. More pain ahead...If we look at the DJI we can see that on the chart the current price is jumping WAY outside the upper Bollinger Band and the 50 MA is actually above the midline of the Bollinger Band. That can signal a couple things.
1st the pricing being so far beyond the upper band means is due for a sharp downward correction towards the Midline at best and to the bottom band at worst.
2nd, with the 50 MA being above the midline of the Bollinger Band can signal that the local trend support is actually now future resistance. The trend of the bands has the midline the more likely of the 2 targets and that would put the dow in a local down trend in the short term.
Based on what the chart is showing me right now, I would say 31.5k Dow is way more likely to be hit before 34k dow. Depending on how long the correction last, it could be a catalyst for a bigger down trend with a much larger correction still to come later this year. Fed rate decisions, earnings data, lay offs, and a few more international trade issues like Yuan settlements, will play a large factor in the future larger correction timing.

YM1! US30USD DOW 2023 APR 03 WEEK
YM1! US30USD DOW 2023 APR 03 WEEK
Price was marked up on low volume =
possibility of trapping longs. Keep your stops tight
if you are holding long positions.
Possible scenarios:
1) Sell if False break of 33590, test and reject of
recent high
2) Long on test and accept of 32595 // 33590
Volume Analysis:
Weekly: Low vol up bar close off high =
possible selling, trapping longs
Daily: Wide spread low vol up bar close off high
= possible selling, trapping longs
Price reaction levels
Short on Test and Reject | Long on Test and Accept
35228 34605 33590
32595 31657
Remember to like and follow if you find this useful.
Have a profitable week ahead.

Updated Dow Count Looking at 2 scenarios but leaning towards crash wave 3 of 3 being at bat or warming up and getting ready to step up to the plate. There’s an alternate count should the confluence of red lines fail to cap this rally and a horizontal white line in the sand indicted which if exceeded would force a change of view to this is a larger bear rally in play. We’re close to the markets showing us which way this will go.
Previous count invalidated, but if the current count holds true, it’s forecasting a 3 of a 3 wave in an extension. Meaning a crash isn’t far off now.

US30 starting to stall at resistance. Hi traders, this is just a general observation, not a trade idea. Tonight we noticed that the US30 has started to fade at a previous level of resistance. With the Core PCE to come, could an expected jump to the upside add to the small seller momentum we are starting to see?
This week we have seen some decent buying so far, but could today’s action be a small hint at profit-taking starting to come in? If we see new buyer demand appear and price makes a new high today, then this idea could be canceled.
If we do see a pullback today and it remains at or above the trendline and moving average, this could set up a possible buy idea next week if buyer momentum continues.
Have a great weekend and good trading.

DOW JONES almost on our target. What's next?Two weeks ago, we gave the most optimal buy entry for Dow Jones (DJI) exactly at the bottom of its 4-month Channel Down:
The price has almost hit our 33100 Target and we think it is time to look into the longer term. We made a case on the idea above that Dow is currently repeating the October - November rally, as the RSI pattern is identical. In addition, that larger pattern could be an Inverse Head and Shoulders, which is a bullish reversal formation, in fact it may be characterized as the bottom formation of the 2022 Bear Phase.
As a result the target can be as high as the Shoulders Resistance, the Higher Highs trend-line. If it is inversely symmetrical to June, we can expect a +12.78% rise. This gives us a target for the next 4-6 weeks at 35400.
-------------------------------------------------------------------------------
** Please LIKE 👍, FOLLOW ✅, SHARE 🙌 and COMMENT ✍ if you enjoy this idea! Also share your ideas and charts in the comments section below! **
-------------------------------------------------------------------------------
💸💸💸💸💸💸
👇 👇 👇 👇 👇 👇

DOW JONES Only a week away from hitting our targetDow Jones hit today the 4hour MA200 and closed a candle above it for the first time since February 20th.
This price action is simply confirming our long term trading plan (see chart below) where we bought the bottom aiming at the top of the Channel Down.
Target intact at 33450 (is also a Harmonic Resistance).
Previous chart:
Follow us, like the idea and leave a comment below!!

US30 - Potential Move upDow and other indexes are showing strength. Looking for long positions. Targets are marked.

DOW JONES broke above the Falling Resistance. First buy signal.Dow Jones broke above the Falling Resistance for the first time in 2 weeks.
The is the first bullish signal since the Triple Bottom but has the Pivot Zone 1 and the MA200 (4h) to overcome.
Trading Plan:
1. Buy as this is a major bullish break out supported by the MA50 (4h).
Targets:
1. 33300 (Fibonacci 0.618).
Tips:
1. The RSI (4h) is on a Rising Support. In the past month, two similar technical structures ended up with a blow-off rise, even when in a downtrend.
Please like, follow and comment!!
Notes:
This is a continuation of this trading plan:

D #DJIA>32680
LONG
T1 33150
T2 33600
<33100
T1 30550
T2 29500
Due to time considerations, i will be skipping the part showing you the harmonics with the Fibs:)
Thank you
#Astrogumbo

DOW JONES: Ranged until it breaks the 4H MA200 and turns bullishDow Jones remains neutral on the 1D technicals (RSI = 47.239, MACD = -227.510, ADX = 31.577) as the price has been mostly ranging for 2 weeks between the 32,600 Symmetrical Resistance and 31,800 Symmetrical Support.
Todays rejection should give one more pull back to the Symmetrical Support if the 4H MA50 breaks. On the other hand, a full 4H candle closing over the Symmetrical Resistance, will most likely cross over the 4H MA200 too and target long term P1 at 33,450.
Prior idea:
## If you like our free content follow our profile to get more daily ideas. ##
## Comments and likes are greatly appreciated. ##

dow is about to go down againdow was strong for 6moths.
But looks like final bull run is about to over soon.
All governmets are trying to hide the factor of banking crisis.
This systematic problem will lead the great crash soon.
MACD lost its power.

Get ahead of the Game of Crypto with Dow TheoryWelcome to @TradingView , this is @Vestinda! We're excited to share with you our insights on the Dow Jones Theory and how it can benefit cryptocurrency traders.
Dow Theory, also known as Dow Jones Theory, is a trading strategy developed by Charles Dow in the late 1800s.
Charles Dow did not write any books during his lifetime, but he did co-found The Wall Street Journal and the Dow Jones & Company. He also wrote many editorials for The Wall Street Journal. Here is a quote from one of his editorials that is particularly insightful:
"The successful investor is usually an individual who is inherently interested in business problems."
Dow theory continues to dominate and is regarded as one of the most sophisticated contemporary studies on technical analysis even after 100 years.
What exactly is Dow Theory?
Charles H. Dow compared the stock market to the tides of the ocean in the Wall Street Journal on January 31, 1901.
"A person watching the tide come in and wanting to know the exact location of the high tide places a stick in the sand at the points reached by the incoming waves until the stick reaches a position where the waves do not come up to it and finally recedes enough to show that the tide has turned." This method is effective for observing and predicting the flood tide of the stock market."
Dow believed that the current state of the stock market could be used to analyse the current state of the economy.
The stock market can provide valuable measures for understanding the reasons for high and low trends in the economy or individual stocks.
How Does the Dow Theory Work?
The Dow Theory is based on several fundamental tenets, which are outlined below:
1. The Averages Reflect Everything:
The market price takes into account every known or unknown factor that may impact both supply and demand. According to this observation, the market reflects all available information, even information that is not in the public domain. However, natural disasters such as droughts, cyclones, floods, or earthquakes cannot be considered.
Major Geopolitical Events are Already Priced In:
All significant geopolitical events, trade wars, domestic policies, elections, GDP growth, changes in interest rates, earning projections, or expectations are already priced in the market.
Unexpected Events Affect Short-Term Trends:
While unexpected events may occur, they usually only affect short-term trends, and the primary trend remains unaffected.
Overall, the Dow Theory emphasises the importance of analysing the primary trend of the market and understanding that all available information is already reflected in the market price.
2. The Market Has Three Trends:
The primary trend:
It can be as long as one year to several years and is the ‘main movement’ of the market. These movements are typically referred to as bull and bear markets. This primary uptrend is called as bullish on the other hand primary downtrend can be considered as bearish trends.
The reality of the situation is that nobody knows where and when the primary uptrend or downtrend will end.
As you can see in the image above when a stock is moving in primary uptrend it makes new high followed by few lows not lower than the previous lows.
Similarly the same patterns follows when it is in primary downtrend.
The objective of Dow Theory is to utilize what we do know, not to make chaotic guess about what we don’t know. Through a set of guidelines from Dow Theory one can measure to identify the primary trend and stay with it.
The intermediate trend or secondary trend:
This trend can last between 3 weeks to several months. Secondary movements are reactionary in nature, think of them as corrections during bull market, or rallies & recoveries in the bear market.
In a bull market, a secondary trend is considered a correction. In a bear market, secondary trend are called reaction rallies.
So suppose if a stock during its primary uptrend made a high, it will retrace back to some points to make a low (known as intermediate trend or correction).
Likewise during an primary downtrend, a stock can make a high after falling for several months or years(known as bear market rallies).
The minor trend or daily fluctuations:
This trend is least reliable which can be lasting from several days to few hours. Dow theory suggests not to put much attention to these trends. As a Long-term investor it is just the part of corrections in secondary uptrend or downtrend rally.
This are just daily fluctuations happening in market on day to day basis. It constitutes of noise in market and perhaps be subject to manipulation.
Out of the three trends mentioned only primary and secondary trends are trustworthy. However, the study of daily price action can add valuable insight, if you look in context of the larger picture.
So when you are looking for daily price action of several days, or weeks try to evaluate bigger structure getting formed. By putting enough attention one can certainly benefit in short term rallies.
A few pieces of a structure are meaningless, yet at the same time, they are essential to complete the entire picture.
3.Major Trends Have Three Phases:
Dow significantly paid attention to the primary trends (major) in which he spotted three phases. These are Accumulation phase, Public participation phase and Distribution phase.
These phases are cyclic in nature and repeats over the time.
A) Accumulation phase:
This phase occurs when the market is in bearish trend, sentiments are negative with no hope for any upcoming uptrend. For example as we saw in Indian share market a steep low in mid cap stocks, making new lows every other day.
Most of the investors see them stay in this trend for unknown time period. However, this is the time when big investors, huge fund houses, institutional investors start accumulating them gradually.
This is known as smart money keeping their view for long term investment. Although you would see sellers in market still selling, they find the buyers easily.
B) Public participation phase:
At this phase the market have already absorbed the negativity with ‘smart money’ getting invested. This is the second stage of a primary bull market and is usually sees the largest advance in prices.
During this phase majority of public(retailers) also thinks to join in as the price is rapidly advancing. However most of them are left behind due to speed in rallies as well as the averages start heading higher.
If you are also a trader or investor you might have this experience and a regret of not able to participate with rally. It is a period followed by improved business conditions and increased valuations in stocks.
C) Distribution phase:
The third stage is the excess phase which eventually be turned to distribution phase. During the third and final stage, the public (retailers) gets fully involved in the market, as they get mesmerized by the bull market rally.
Some of them who felt left will still try to look for valuations and want to be part of the rally.
But this is the time when ‘smart money’ starts liquidating shares on every high. Whereas public will try to buy at this level absorbing all liquidating (sell-off) volumes made by big investors.
On contrary in the distribution phase, whenever the prices attempt to go higher, the smart money off loads their holdings.
This is the beginning of bear market, where sentiments will start turning negative, you will see more and more companies filing bankruptcy, change in economic growth etc.
During bear market the level of frustration rises among retail investors as they start loosing all hopes.
4.The Averages Must Confirm Each Other:
Dow used to say that unless both Industrial and Rail(transportation) Averages exceed a previous peak, there is no confirmation or continuation of a bull market.
Both the averages did not have to move simultaneously, but the quicker one followed another – the stronger the confirmation.
To put it differently, observe the image above, as you can see both the averages are in bull market, trending upward from Point A to C.
5. Volume Must Confirm the Trend:
Volume is a tool to know how many shares have been bought and sold in a given period of time. It helps in analysing the trends and patterns.
Now according to Dow theory, a stock must be in uptrend with high volume and low in corrections.
Volumes may not be an attractive piece of information but you should try to combine the volume data with resistance and support levels to get a clear picture.
6. Trend Is expected to Be Continued Until Definite Signals of Its Reversal:
Quite similar to Newton’s first law of motion which states that an object will remain at rest or in uniform motion in a straight line unless acted upon by an external force.
In simple words an object will remain in their state of motion unless a external force acts to change the motion.
Likewise, the market will continue to move in a primary direction until a force, such as a change in business conditions, is strong enough to change the direction of this primary move. You can also see the signals for reversals when a trend is about to change.
7.Signals and Identification of Trends:
One of the major challenges faced while implementing Dow theory is the accurate identification of trend reversals. Remember, if you are following the dow theory one should be not only looking for overall market direction, but also the definite reversal signals.
One of the main skill used to identify trend reversals in Dow theory is peak and trough or high and low analysis. A peak is defined as the highest price of a market movement, while a trough is seen as the lowest price of a market movement.
Dow theory suggests that the market doesn’t move in a straight line but from highs (peaks) to lows (troughs), with the overall moves of the market trending in a direction.
An upward trend in Dow theory is a series of successively higher peaks and higher troughs. A downward trend is a series of successively lower peaks and lower troughs.
8. Manipulation In the Market:
According to Charles dow the manipulation of the primary trend is not possible. where as Intraday, or day to day trading and perhaps even the secondary movements could be vulnerable to manipulation.
These short movements, from a few hours to a few weeks, could be subject to manipulation by large institutions, speculators, breaking news or rumors.
There is possibility that speculators, specialists or anyone else involved in the markets could manipulate the prices in short run.
Individual shares could be manipulated for example the security rise up and then falls back and continues the primary trend. With this in mind one need to be aware of the situations while trading and investing.
However, it would be next to impossible to manipulate the market as a whole. The market is simply too big for any kind of manipulation to occur.
Why Dow Theory Is Not Infallible?
Dow Theory is not a sure-fire means of beating the market hence it is not something which is infallible or fault-less. Some of the criticism received about Dow Theory is that it is really not a theory.
Charles Dow's principles and theories, while developed for the stock market, can still be applied to crypto investing.
Here are a few ways his knowledge can be used:
Follow the trend: Dow's first principle is that the market moves in trends. In crypto investing, you can identify trends by looking at price charts and technical analysis. If the price of a particular cryptocurrency is in an uptrend, it may be a good time to consider buying. If it's in a downtrend, you may want to consider selling or waiting for a better entry point.
Consider market breadth: Dow's second principle is that the market's movements should be confirmed by market breadth. This means looking beyond just the price of one cryptocurrency and examining the overall health of the market. For example, if a particular cryptocurrency is in an uptrend but the majority of other cryptocurrencies are in a downtrend, it may not be a sustainable trend.
Use volume as a confirmation: Dow's third principle is that volume should confirm the trend. In crypto investing, volume can provide insight into the strength of a trend. For example, if the price of a cryptocurrency is increasing with high volume, it may indicate a strong uptrend. On the other hand, if the price is increasing with low volume, it may not be a sustainable trend.
Be aware of market cycles: Dow's fourth principle is that the market moves in cycles. This means that there will be periods of growth and periods of decline. In crypto investing, it's important to be aware of these cycles and adjust your strategy accordingly. For example, during a bull market, you may want to focus on buying and holding, while during a bear market, you may want to consider shorting or staying on the sidelines.
Overall, while the crypto market is different from the stock market, many of Dow's principles can still be applied to crypto investing to help you make more informed decisions.
In conclusion, Dow Theory, developed by Charles Dow in the late 1800s, remains one of the most respected theories in financial market history.
The theory's primary tenets are based on the idea that the stock market reflects all available information, and there are three trends in the market: primary, intermediate, and minor.
The primary trend is the most important and can last several years, while the intermediate trend and minor trend are reactionary in nature.
Dow Theory provides an excellent framework for traders and investors to evaluate the current state of the economy, and it has remained relevant even after 100 years. Whether you are an intraday trader, a short-term trader, or a long-term investor, the knowledge of Dow Theory will undoubtedly help you develop various strategies for your investments.
So, in conclusion, Dow Theory is a respectful theory that has stood the test of time and continues to be an essential tool for anyone who trades or invests in the financial and crypto market.
Unleash Your Inner Trader — Read Story About Bulls and Bears That Will Change Your Mindset!
Hey there, our lovely friends! 😊 If you enjoyed reading this, please hit the "like" button 👍 and share it on your social media and groups. By doing so, more people can discover this interesting information, and we'll be encouraged to create even more awesome content for you! ♥️

I"M LOVING THIS US30 SETUP Seems toooo good to be true?
Taking short positions on US3 on RS and TL - follow for more

AUDUSD - Simple Bullish TrendUsing Dow Theory and checking RSI if there is a divergence - Picked up this simple trade based on trend analysis

✅US30 WILL KEEP FALLING|SHORT🔥
✅US30 is trading in a
Downtrend and the index
Made a good pullback
From the resistance cluster
So I am bearish biased
And I think that we will see
A further move down
After some local correction
To the upside on the
Smaller timeframes
SHORT🔥
✅Like and subscribe to never miss a new idea!✅

SPX - DJI - NDX - Going higher after small pullback ?Interest rate decision is in less than 15min and a 25bps hike is expected.
Markets have run ahead of it this week so a small pullback is likely but as long as prices stay above the dotted Invalidation levels, there's nothing to worry and we should resume higher tomorrow probably.
From a risk/reward perspective, I think it's a good idea to look to go long, may it be relatively strong individual names or simply buying the indexes.
It's also a good idea to go for some select names in the crypto space, like BTC, ETH or some newer ones like OP, CFX and VIB.

DOW a short term upwards move? 🦐DOW on the 4h chart after the recent low is trading at the 0.382 Fibonacci level.
The market cretes 2 equal lows with a lower spike in the middle that can also be seen as a inverted head and shoulder pattern.
The current situation makes us think that a further move to the upside can be seen in this last trading day of the week and IF the market will break above we can look for a short term long order according to the Planctonì's strategy rules.

Will the FOMC continue the US30s run higher?Traders will be looking forward to today’s FOMC seeking future direction on rates as inflation starts to cool but remains high. The new banking crisis has also significantly influenced the markets over the last several weeks.
Stocks have been one of the markets hardest hit by the uncertainty thrown up by the banking crisis. The US30, in particular, has been hard hit, and sellers cut just over 7% off the index in four weeks.
Looking at recent price action, we can see some buyer confidence returning after bailouts, and political action was taken to help stop the rout. The US30 held support and broke its tight range yesterday with a 0.98% rally.
Inflation and rates had been key influences before the banking issues arose. Today’s FOMC could play an important role in the short term. Rates are now basically priced in with a 25-point increase, and Fed trackers see a 15% chance of a hold at an 85% chance of a 25-point increase.
The statement for us is the important part unless we see a hold which would be unexpected and should give the US30 a boost through its trendline. If the Fed remains hawkish and discounts the banking issues, this could set off selling with worry over higher rates and possible inaction to support the sector. If the message is more to the dovish side, we will be looking for further upside from the new up leg, and hopefully, a break of the current trend could show signs that the correction could be starting to wain.
Minor resistance remains at 32,600, and support is seen at 31,850. Price continues to hold a series of LHs and LLs, but a new push higher could break that pattern.
The short term comes down to the fed message, which will be released at 05:00 am AEDT with the Federal funds rate. The press conference follows at 05:30 am.
