DOW JONES: The most critical 1D MA50 of all.Dow Jones is neutral on its 1D technical outlook (RSI = 52.914, MACD = -282.250, ADX = 30.751) but has completed 5 green 1D candles in a row, going for the all important Resistance test of the 1D MA50. This trendline has been intact since March 3rd and is on a crucial Resistance cluster as this is where the LH trendline from the ATH is. The 1D RSI is already on an Inverse H&S, which is a positive sign but we need to see a candle closing over the 1D MA50 to validate the restoration of the long term bullish trend. If succesful, we will turn long and target the ATH Resistance (TP = 45,000), which is also just under the 2.0 Fib extension.
## If you like our free content follow our profile to get more daily ideas. ##
## Comments and likes are greatly appreciated. ##
DOW

US30 Trading Into Major Resistance - Look For Dow Jones Retrace🔍 US30 Analysis: At the moment, I'm watching the US30 as it looks overextended 📈 and is trading into previous highs. 🧱 If you look left on the chart, it's approaching a key resistance level on both the weekly and daily timeframes.
I’m expecting a potential retracement 🔁 and monitoring for a bearish break of structure on the 30-minute timeframe ⏱️ as a possible setup for a counter-trend short 📉 — aiming for the imbalance zone visible on that timeframe.
📏 Drawing a Fibonacci retracement from the recent swing low to high, the 50% equilibrium 🔄 lines up perfectly with the imbalance area, adding confluence to the idea.
📚 This is shared for educational purposes only and should not be considered financial advice 💼.

DOW JONES Are you willing to bet against a 15 year pattern?Dow Jones (DJI) will close the month today with a massive rebound 1M candle after almost touching its 1M MA50 (blue trend-line). Since the October 2010 break above the 1M MA50, after the market recovered from the 2008 Housing Crisis, the 1M MA50 has been the ultimate long-term Buy Entry as it has always signaled rallies that ranged from +58% to +67%.
The 1M MA50 has also kept the index mostly within the 0.382 - 0.786 Fibonacci range (blue zone) of the multi-year Channel Up. Given also that the 1W RSI also reached in April its ultimate Buy Zone (green), we view this as the best long-term Buy Signal the index handed to us since the September 2022 bottom of the Inflation Crisis.
Since the Bullish Legs that followed have been fairly consistent on average, we expect another 58% rise minimum. Assuming a 'bad-case' scenario of being contained within the 0.786 Fib, then a 56000 long-term Target seems more than fair.
Are you willing to go against this pattern?
-------------------------------------------------------------------------------
** Please LIKE 👍, FOLLOW ✅, SHARE 🙌 and COMMENT ✍ if you enjoy this idea! Also share your ideas and charts in the comments section below! This is best way to keep it relevant, support us, keep the content here free and allow the idea to reach as many people as possible. **
-------------------------------------------------------------------------------
💸💸💸💸💸💸
👇 👇 👇 👇 👇 👇

Weekly Price Action: Dow Jones DJI Tuesday 4/29/2025In this video, we will be looking into the potential price action DJI.

US30 LOCAL SHORT|
✅DOW JONES is going up now
But a strong resistance level is ahead at 40,947
Thus I am expecting a pullback
And a move down towards the target of 40,314
SHORT🔥
✅Like and subscribe to never miss a new idea!✅
Disclosure: I am part of Trade Nation's Influencer program and receive a monthly fee for using their TradingView charts in my analysis.

DOW JONES New long-term bottom being formed on the 1W MA200.Dow Jones (DJI) hasn't yet broken above its 1D MA50 (blue trend-line) following the April 07 Low, but is nonetheless consolidating and holding the 1W MA200 (red trend-line), which hasn't broken as Support since October 17 2022.
That was a few days after the bottom of the 2022 Inflation Crisis was formed and the current Channel Up started. In fact, the rallies that started on both Channel Up bottoms since, have been almost identical in range (+22.60% and +23.80% respectively) so technically we should be expecting at least 44800 (+22.60% from April's Low) on the medium-term.
-------------------------------------------------------------------------------
** Please LIKE 👍, FOLLOW ✅, SHARE 🙌 and COMMENT ✍ if you enjoy this idea! Also share your ideas and charts in the comments section below! This is best way to keep it relevant, support us, keep the content here free and allow the idea to reach as many people as possible. **
-------------------------------------------------------------------------------
Disclosure: I am part of Trade Nation's Influencer program and receive a monthly fee for using their TradingView charts in my analysis.
💸💸💸💸💸💸
👇 👇 👇 👇 👇 👇

Dow Inc.: Low in PlaceDow Inc. managed to hold and respond well within our active Target Zone(s) between $35.93 and $22.83 at the relevant Fibonacci levels. We currently assume that wave (II) in blue has been successfully completed, which leads us to anticipate a rise above the two indicated resistance levels ($55.67 and $71.86). Our zones remain active and could still be used for entering long positions. However, it should be noted that the price range could be tested further, and a completely new low is even possible under our alternative scenario: this wave count outlines a significantly stronger setback with the blue wave alt.(II), which would mean breaking through our dark green-blue Target Zones (probability: 35%).

AUDNZD DOW Theory 1 hour chart Lower Highs and Lower Lows : SellAUDNZD DOW Theory 1 hour chart Lower Highs and Lower Lows : Sell
Risk Reward Your Take Profit Level
Risk Reward 1:1 1.0602
Risk Reward 1:2 1.0522

DOW Theory 1 hour chart AUDUSD Higher Highs and Higher LowsStop Loss:
Risk Reward Your Take Profit Level
Risk Reward 1:1 0.6503
Risk Reward 1:2 0.6569

DOW Theory GBPUSD 1 HOUR CHART Higher Highs and Higher LowsDOW Theory GBPUSD 1 HOUR CHART Higher Highs and Higher Lows

Daily Price Action DOW Jones DJI Tuesday 4/22/2025In this video, we will be looking into the potential price action of DJI.

Areas to watch DJI Trend lines to watch in the coming weeks for the DJI
if the initial one breaks down a test of the Covid trend line might come
Lets see how it goes
Daily timeframe

DOW fulfilled all Market Bottom conditions. 2year rally started!Dow Jones (DJI) has cemented a strong Support zone last week. Not only did it almost test its 1W MA200 (orange trend-line) and successfully held but also the former All Time High (ATH) Resistance trend-line that started from the previous Cycle Top and now turned into Support.
This previous ATH trend-line held and offered its Support on the previous 2 major market bottoms as well (October 03 2022 and March 23 2020). Actually on all 3 previous Cycle bottoms that turned out to be the best level to buy long-term, the 1W RSI was oversold on the 30.00 limit.
All the above conditions were fulfilled on last week's (April 07 2025) Low. Even though Dow is expected to reach 53000 on its next Top in around 2 years, the most optimal Sell Signal has been given by the 1W RSI. After the 1W RSI breaks for the first time above the 70.00 overbought limit again, the best Sell Signal would be after it drops and re-tests again 70.00 for the 2nd time.
-------------------------------------------------------------------------------
** Please LIKE 👍, FOLLOW ✅, SHARE 🙌 and COMMENT ✍ if you enjoy this idea! Also share your ideas and charts in the comments section below! This is best way to keep it relevant, support us, keep the content here free and allow the idea to reach as many people as possible. **
-------------------------------------------------------------------------------
Disclosure: I am part of Trade Nation's Influencer program and receive a monthly fee for using their TradingView charts in my analysis.
💸💸💸💸💸💸
👇 👇 👇 👇 👇 👇

DOW JONES: Just triggered the most historic buy signal (1M MA50)Despite the bearishness on the lower timeframes, Dow is neutral on the ultimate long term chart, the 1M (RSI = 51.044, MACD = 1991.530, ADX = 44.038) and that is due to the fact it almost touched its 1M MA50. This neutral technical setting is a great reset for the Channel Up and stands as the most ideal long term buy entry and was tested before on all 4 major market bottoms (September 2022, March 2020, January 2016, October 2011). In all incidents it set in motion the new Bull Cycle, technically the bullish wave of the Channel Up. The most common price increase is +70% and along those lines, we anticipate Dow to hit 60,000 by the end of 2027.
## If you like our free content follow our profile to get more daily ideas. ##
## Comments and likes are greatly appreciated. ##

DOW JONES: High volatility but clear picture long term.Dow Jones turned bearish on its 1D technical outlook (RSI = 40.021, MACD = -1063.380, ADX = 32.380) as it is correcting brutally yesterday's gains on uncertainty regarding the 90-day pause of tariffs. We can't overlook however the fact that yesterday's rebound happened on the 1W MA200 and at the bottom (HL) of the Bullish Megaphone. The very same sequence of events unfolded during the last big U.S.-China trade war that bottomed in December 2018. First a Channel Down bottomed on the 1W MA200 and started the Bullish Megaphone that bottomed on the 2018 trade war.
Both trade war corrections were -19% and if what follows replicates the 2019 rise, then we are up for a +35% rally. Potential TP = 49,000.
## If you like our free content follow our profile to get more daily ideas. ##
## Comments and likes are greatly appreciated. ##

Trumpenomics - Market Volitility - How low will it go?What we know:
When Trump entered office he said the stock market was too high and he was not investing in the markets.
The Tariffs have caused volatility and a decline in the markets.
Market drops in the past have been between 30% and 60%.
How far do you think the market will drop this time?

DOW 104% TARIFFS on China activated. Can the market be saved?Dow Jones (DJIA) is almost on its 1W MA200 (orange trend-line) and earlier today President Trump activated 104% duties on Chinese imports. This is far from being an encouraging development especially after Monday's attempt for the market to recover.
Most of the gains were lost yesterday and today it is a wait-and-see game in anticipation of the market reaction on the opening bell of Wall Street.
From a long-term technical perspective however, Dow is on a huge buy level that we've only seen another 4 times since the Housing Bubble bottom in March 2009. That buy level consists of two conditions: price touching the 1W MA200 and the 1W RSI hits (or comes extremely close to) the 30.00 oversold limit.
As you can see that has happened last time on September 19 2022 (Inflation Crisis bottom), March 09 2020 (COVID crash), August 24 2015 (China slowdown, Grexit) and August 08 2011 (first correction since 2009 Housing Crisis). The situation most similar to the current, is the COVID crash as it was the fastest drop to the 1W MA200 and 1W RSI to 30.00.
Despite the brutal correction, it took the market 'only' 43 weeks (301 days) to reach again the 0.786 Fibonacci retracement level. That is the top of the Blue Zone of the Fibonacci Channel Up that started on the March 2009 Housing bottom. The Blue Zone, consisting of the 0.786 - 0.382 Fib range, is important as it has dominated the multi-year bullish trend and contained the price action inside it, with only a few occasions diverging outside of it.
The longest it took Dow to reach the 0.786 Fib again after such correction was 110 weeks (770 days) and that interestingly enough happened two out of the four times. Practically reaching the 0.786 Fib constitutes a Cycle Top.
So essentially, despite the uncertainty and panic, the market is technically on a Support level that in 16 years we've only seen another 4 times, that's once every 4 years, which is a fair sample of a Cycle size. As a result, assuming stability comes to the world through trade deals (and why not Rate Cut announcements), we may see Dow reaching its 0.786 Fib again (and make new ATH) the fastest by February 02 2026, hitting 49000 and the longest by May 17 2027, hitting 56000 roughly.
-------------------------------------------------------------------------------
** Please LIKE 👍, FOLLOW ✅, SHARE 🙌 and COMMENT ✍ if you enjoy this idea! Also share your ideas and charts in the comments section below! This is best way to keep it relevant, support us, keep the content here free and allow the idea to reach as many people as possible. **
-------------------------------------------------------------------------------
💸💸💸💸💸💸
👇 👇 👇 👇 👇 👇

DOW Inc | DOW | Long at $27.59NYSE:DOW Inc is a strong company with good fundamentals currently trading at a good value (it just may take time for the value to truly show).
P/E = 18x
Dividend Yield = 7.74%
Price/Cahs Flow = 6.9x
Debt/Equity = 0.94x
Price/Book = 1.14x
Insiders buying and awarded options
Thus, at $27.59, NYSE:DOW is in a personal buy zone.
Targets:
$34.00
$40.00
$44.00

Party's OverDow Futures daily forming a downwards channel with price targets potentially down to 34k and 31k. These drops would be about 20-40% which is considered a true market crash. The falling wedge pattern plays out until potentially June of 2027, but wedges from the top of the range are dangerous as they can turn into bull traps.
- Economic fundamentals have been disconnected from the financial system for some time but as the underlying economy begins to falter (ex. unemployment wave) markets begin to price in data such as falling retail sales.
- President Trump is going through with mass layoffs in the Federal Government which creates unemployment as the private sector has been going through layoffs and has halted actual new hiring since 2023.
- As more traders have become accustomed to "bad news is good news," they will most likely be wiped out trying to buy dips or chase false breakouts doing what they have always done.
- Tariffs regionalize trade which make global economies and supply chains less interconnected. A global economy that is also very levered up on USD denominated debt needs dollar liquidity to continue to function. By regionalizing trade that liquidity is starved which can lead to financial problems on a global scale if not handled carefully.
- Markets are likely to price in these risks over the next 2-3 months leading asset prices and interest rates lower. Expect individual companies to do well at times but then rotate to others while the Dow index itself falls.
- Even if the Dow were to play out the wedge during 2026, without significant improvements to the global financial system expect that move to be a bull trap or a best lead to minimal gains without a new wave of monetary inflation.

DOW JONES Will the 1week MA200 save the day?Dow Jones / US30 almost reached its 1week MA200 today and immediately rebounded.
Last time it approached it so closely was on October 23rd 2023 and last it crossed under it was September 19th 2022.
The most recent was the first higher low of the 3 year Channel Up and the latter was the bottom of the last bear market.
The 1week RSI hasn't been this low since June 13th 2022, which was again a near 1week MA200 test that caused an immediate rebound to the 1week MA50 before the rejection to the eventual bear market bottom.
As long as the 1week MA200 holds and closes the candles over it, we expect the Channel Up to start a near bullish wave like post October 2023.
Target 45200 (same as the March 2024 rally) which is around the All Time High.
Follow us, like the idea and leave a comment below!!

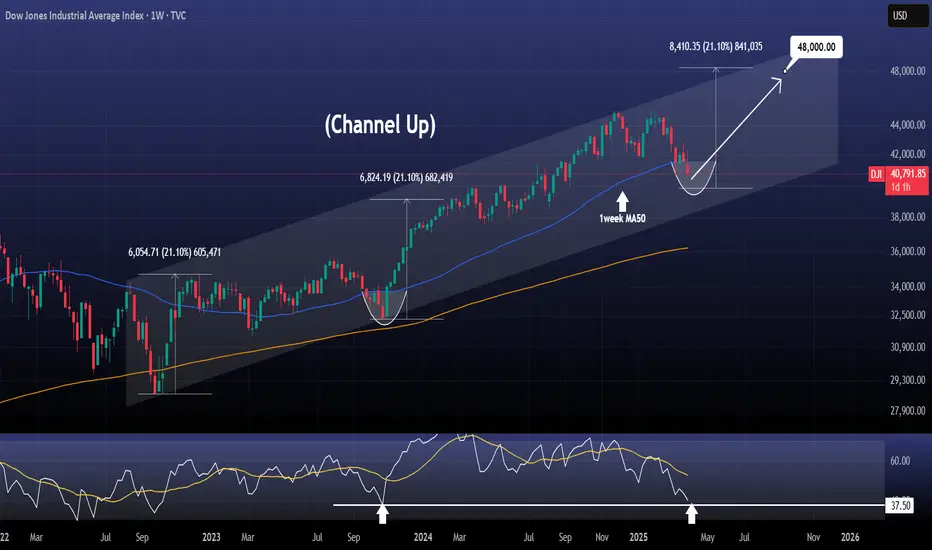
DOW JONES You will regret not taking this buyDow Jones / US30 remains under heavy selling pressure as it has been yet again rejected under the 1week MA50, failing to hold the closings over it of the past 3 candles.
This is the strongest correction of the index since the September 26th 2022 bottom and the start of the Channel Up.
Despite the negatives, the 1week RSI is almost on the 37.50 level, which is where the last higher low of the Channel Up was formed on October 23rd 2023, again under the 1week MA50.
Obviously even though the downside may continue for a few more days, the extent is limited technically, especially since the worst of the tariffs have been priced and only new and more aggressive ones can inflict more non-technical fear on the market.
This is a unique long term buy opportunity, the likes of which saw 2 rallies before of +21.10%.
Even in the event of one more dip, a 48000 target towards the end of the year is very realistic.
Follow us, like the idea and leave a comment below!!
DOW JONES One break away from a rally back to 45000.Dow Jones (DJIA) got stopped on the 4H MA50 (blue trend-line) as the market paused ahead of today's tariffs implementation. This is the 2nd technical rejection since the March 13 bottom, the first being n the 4H MA200 (orange trend-line) last Wednesday.
This bottom is technically the start of the new Bullish Leg of the 1-year Bullish Megaphone pattern, and is very similar, both in 1D RSI and price terms, to the first one (April 19 - May 20 2024). As you can see, we are currently within the sane 0.5 - 0.786 Fib range, where the price consolidated before the eventual 4H MA200 bullish break-out.
If it continues to replicate the 2024 Bullish Leg, then be ready for a straight Resistance test once the 4H MA200 breaks. Our Target is 45000.
-------------------------------------------------------------------------------
** Please LIKE 👍, FOLLOW ✅, SHARE 🙌 and COMMENT ✍ if you enjoy this idea! Also share your ideas and charts in the comments section below! This is best way to keep it relevant, support us, keep the content here free and allow the idea to reach as many people as possible. **
-------------------------------------------------------------------------------
💸💸💸💸💸💸
👇 👇 👇 👇 👇 👇

DOW JONES: 4 week bottom on the 1W MA50. Best time to buy.Dow Jones turned neutral again on its 1D technical outlook (RSI = 46.611, MACD = -297.980, ADX = 37.851) as it is recovering today and more importantly keeps its price action above the 1W MA50. This is the 4th straight week that it trades and holds the 1W MA50, which is shaping up to be the natural long term support. That is keeping the 1W RSI neutral (47.224), which technically suggets that it is the most low risk level to buy. The 1W RSI made a double bottom due to this consolidation and the 1W MACD printed the first light red bar, all of which are similar to the October 23rd 2023 bottom.
Both have been bottoms after bearish waves of the 1.5 year Channel Up and as a matter of fact similar in decline rate (-9.50%). The highest probability level for a rebound and start of the new bullish wave is this, and based on the previous, it should aim for the 2.0 Fibonacci extension (TP = 49,000).
## If you like our free content follow our profile to get more daily ideas. ##
## Comments and likes are greatly appreciated. ##
