DXY EXTREME BEARISH DIVERGENCE > ABOUT TO COME STRAIGHT DOWN!DXY Has been on a tear but I think thats about to end and I think it will end very quickly. There is multiple very strong bearish divergences on the weekly, across multiple indicators showing that a major move down is coming. I think we have reached the top for the DXY for a while and its about to tank. Dont know whats around the corner as far as news but something big is about to come out thats going to kill the DXY. This is not trading or financial advice this is just my opinion. If you apprecaite my work please consider giving this chart a boost and follow me for more updates. Thank you and good luck my friends.
DOW

DOW a short term upwards move? 🦐DOW after the double bottom over the daily support at the 28800 started a retracement move to the upside.
The price is currently testing the 0.5 Fib level and a possible test of the 0.618 can be seen.
How can i approach this scenario?
I will wait for the test of the upper level and if the price will show us a sign of inversion i will consider a nice short order according to the Plancton's strategy rules.
––––
Follow the Shrimp 🦐
Keep in mind.
• 🟣 Purple structure -> Monthly structure.
• 🔴 Red structure -> Weekly structure.
• 🔵 Blue structure -> Daily structure.
• 🟡 Yellow structure -> 4h structure.
• ⚫️ Black structure -> >4h structure.
Here is the Plancton0618 technical analysis , please comment below if you have any question.
The ENTRY in the market will be taken only if the condition of the Plancton0618 strategy will trigger

Stocks Face HeadwindsDespite plenty of negative sentiment in the news and a week packed with data, including the Fed's redbook and housing price indexes on Tuesday, GDP on Thursday and PCE on Friday. We hit a high of 3792. We tweeted on Sunday night that this small rally was likely to be short lived and sure enough we are seeing a pull back. The APAC markets are selling dramatically , as investors are worried about Asia's economic future. This is likely to bleed into the US markets as well. If so, we could see support at 3645 again. We expect resistance at 3792 to hold but if not, 3909 is the next target.

big short is coming and nobody knowsI am very much concern about the credit suisse's debt problem.
I believed that market has bottoomed but it seems like another one more crash is waiting for us.
This bearish trend is indicating that lower volume.
Not many investors can created remarkable volume.
So stock isn't cheap yet.

10/23/22 HONHoneywell International Inc. ( NASDAQ:HON )
Sector: Producer Manufacturing (Industrial Conglomerates)
Market Capitalization: 123.158B
Current Price: $182.81
Breakout price trigger: $185.85
Buy Zone (Top/Bottom Range): $182.00-$169.55
Price Target: $200.40-$203.00 (1st), $221.20-$226.00 (2nd)
Estimated Duration to Target: 161-170d (1st), 323-351d (2nd)
Contract of Interest: $HON 3/17/23 190c, $HON 1/19/24 200c
Trade price as of publish date: $8.20/contract, $17.10/contract

DJI : Bear Trap in the making.Good Day,
Hello Traders,
DJI looks bullish for very short term, if it corsses 31030 and sustains above it for a week ,
then we can see a reversal.
However broadly picture looks gloomy as the world fears recession as this is been sold all
across the media.
Disclaimer : I am not SEBI registered analyst, this is for educational purposes.
Please trade as per your risk and do consult with your financial advisor before taking any
trading decisions.
If you really like the analysis , please do comments, LIKE and Follow me.

Great Depression: A Timeline of History - 1930A timeline of the Great Depression for 1930 overlaid with the Dow Jones Industrial Average

Dow Jones: Bullish Engulfing Breaks Trendline ResistanceThe Dow Jones Industrial Average has the September high in focus after a Bullish Engulfing candlestick pierced prompted prices to pierce above trendline resistance. An advancing RSI suggests healthy momentum, putting a bullish lean on upcoming price action.

WW2: A Timeline of History - 1942A timeline of the events of World War 2 overlaid with the Dow Jones Industrial Average

DJI Potential For Bullish MomentumThe overall bias for DJI on the H4 chart is bearish. However, given that the most recent CPI data was stronger than projected, we might anticipate a medium-term bullish market. Look for a buy entry at 29997.62, which corresponds to the market gap and the 23.6% Fibonacci line. To avoid missing out on trades, entry will be at the peak of the market gap. The take profit point will be at 34281.36, where the 61.8% and 50% Fibonacci lines intersect, as well as a market gap that adds confluence to that area. The stop loss will be set at 28516.32, which is slightly below the previous low.
Please be advised that the information presented on TradingView is provided to Vantage (‘Vantage Global Limited’, ‘we’) by a third-party provider (‘Everest Fortune Group’). Please be reminded that you are solely responsible for the trading decisions on your account. There is a very high degree of risk involved in trading. Any information and/or content is intended entirely for research, educational and informational purposes only and does not constitute investment or consultation advice or investment strategy. The information is not tailored to the investment needs of any specific person and therefore does not involve a consideration of any of the investment objectives, financial situation or needs of any viewer that may receive it. Kindly also note that past performance is not a reliable indicator of future results. Actual results may differ materially from those anticipated in forward-looking or past performance statements. We assume no liability as to the accuracy or completeness of any of the information and/or content provided herein and the Company cannot be held responsible for any omission, mistake nor for any loss or damage including without limitation to any loss of profit which may arise from reliance on any information supplied by Everest Fortune Group.

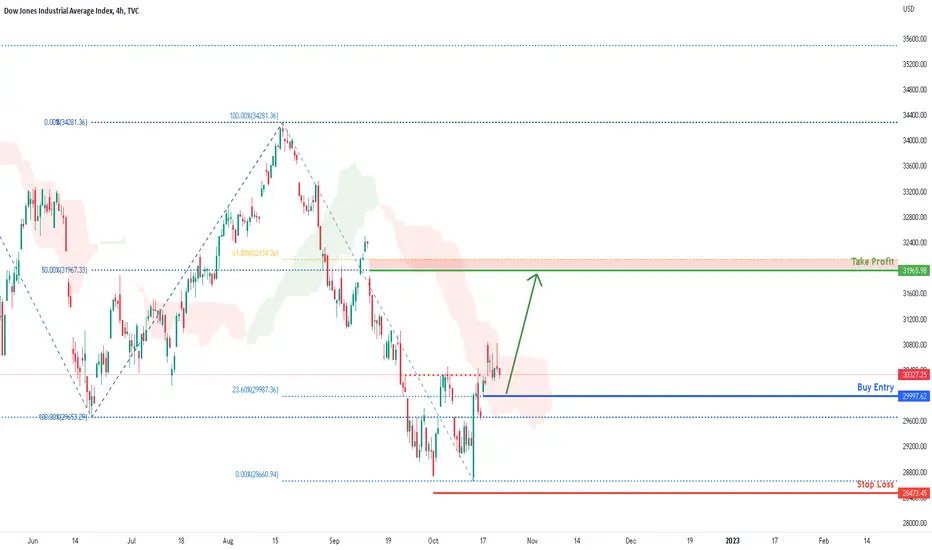
DJI Potential for Bullish Momentum | 21st October 2022On the H4 chart, the overall bias for DJI is bearish. To add confluence to this, the price is below the Ichimoku cloud which indicates a bearish market. Looking for a retracement buy entry at 29997.62 where the 23.6% Fibonacci line is located. Stop loss will be set at 28473.45. Take profit will be at 31965.98 where the 50% and 61.8% Fibonacci line is located.
Any opinions, news, research, analyses, prices, other information, or links to third-party sites contained on this website are provided on an "as-is" basis, as general market commentary, and do not constitute investment advice. The market commentary has not been prepared in accordance with legal requirements designed to promote the independence of investment research, and it is therefore not subject to any prohibition on dealing ahead of dissemination. Although this commentary is not produced by an independent source, FXCM takes all sufficient steps to eliminate or prevent any conflicts of interest arising out of the production and dissemination of this communication. The employees of FXCM commit to acting in the clients' best interests and represent their views without misleading, deceiving, or otherwise impairing the clients' ability to make informed investment decisions. For more information about the FXCM's internal organizational and administrative arrangements for the prevention of conflicts, please refer to the Firms' Managing Conflicts Policy. Please ensure that you read and understand our Full Disclaimer and Liability provision concerning the foregoing Information, which can be accessed on the website.
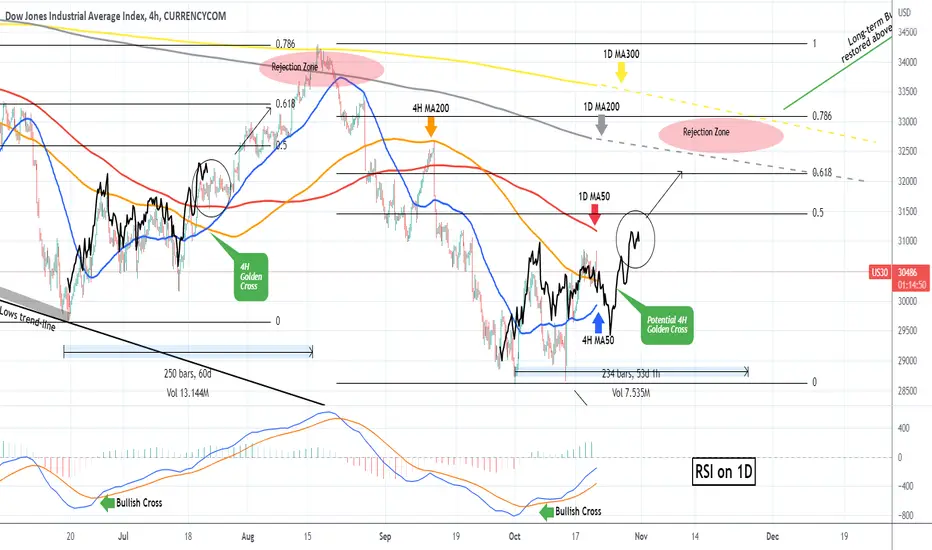
DOW JONES Repeating the July bullish fractal. Still time to buy!It was just 10 days ago when we made a case for a medium-term buy on the Dow Jones index (DJI), against popular belief, as we had early signs that the index made a June 17 type bottom and was about to repeat the June-Aug rebound:
Our view has been confirmed so far and following the 1D RSI break above the Lower Highs and the 1D MACD Bullish Cross, the price quickly has come a few clicks away from the 1D MA50 (red trend-line).
Today's analysis is on the 4H time-frame, in order to get a more detailed look on the short-term. We see that Dow Jones has already broken above both the 4H MA200 (orange trend-line) and the 4H MA50 (blue trend-line) which is supporting currently. Based on the 1D RSI it seems that we are still in the early stages of this uptrend to a Lower High (at least). The 4H Golden Cross (MA50 above MA200) hasn't formed yet and in order to get a better understanding of Dow's analogous position compared to July, I've plotted the June-July sequence on today's price action (black line).
As you see, based on that, the 1D MA50 break should come by next week's end (the earliest), though of course this isn't absolute as even though similar, the current price action hasn't followed the exact pattern of June-July. Above the 1D MA50, the next volatility zone should be within the 0.5 - 0.618 Fibonacci retracement levels, making way for the rejection zone (and the medium-term target) within the 1D MA200 (grey trend-line) and the 1D MA300 (yellow trend-line).
-------------------------------------------------------------------------------
** Please LIKE 👍, SUBSCRIBE ✅, SHARE 🙌 and COMMENT ✍ if you enjoy this idea! Also share your ideas and charts in the comments section below! This is best way to keep it relevant, support me, keep the content here free and allow the idea to reach as many people as possible. **
-------------------------------------------------------------------------------
You may also TELL ME 🙋♀️🙋♂️ in the comments section which symbol you want me to analyze next and on which time-frame. The one with the most posts will be published tomorrow! 👏🎁
-------------------------------------------------------------------------------
👇 👇 👇 👇 👇 👇
💸💸💸💸💸💸
👇 👇 👇 👇 👇 👇
Stocks Pull Back After Tesla and FedAs predicted yesterday, stocks have met resistance at 3758. We were fairly certain this would be a top due to lack of momentum and the price action 'rounding off'. Also, the news isn't exactly cheery lately. The Fed's Bullard thinks we won't see inflation ease until next year, and Tesla's earnings have disappointed sending the stock tumbling 5%. The major indices all dipped, and exactly as we predicted, the level 3676 has provided support. If support does not hold, then we could retrace all the back to 3584. We are likely to hold the range between current levels and highs at 3758. If we can somehow break out, we are sure to hit resistance at 3792, which should be considered a ceiling for now.

DJI Potential For Bullish MomentumOn the H4 chart, the overall bias for DJI is bearish. However, with the recent CPI data released being better than expected, we can expect a medium-term bullish market. Looking for a buy entry at 29997.62 where the market gap is. Entry will be at the top of the market gap to prevent missing out on trades. Take profit will be at 34281.36 where the 61.8% and 50% Fibonacci lines are located together with a market gap that adds confluence to that area. Stop loss will be at 28516.32, slightly below where the previous low is.
Please be advised that the information presented on TradingView is provided to Vantage (‘Vantage Global Limited’, ‘we’) by a third-party provider (‘Everest Fortune Group’). Please be reminded that you are solely responsible for the trading decisions on your account. There is a very high degree of risk involved in trading. Any information and/or content is intended entirely for research, educational and informational purposes only and does not constitute investment or consultation advice or investment strategy. The information is not tailored to the investment needs of any specific person and therefore does not involve a consideration of any of the investment objectives, financial situation or needs of any viewer that may receive it. Kindly also note that past performance is not a reliable indicator of future results. Actual results may differ materially from those anticipated in forward-looking or past performance statements. We assume no liability as to the accuracy or completeness of any of the information and/or content provided herein and the Company cannot be held responsible for any omission, mistake nor for any loss or damage including without limitation to any loss of profit which may arise from reliance on any information supplied by Everest Fortune Group.

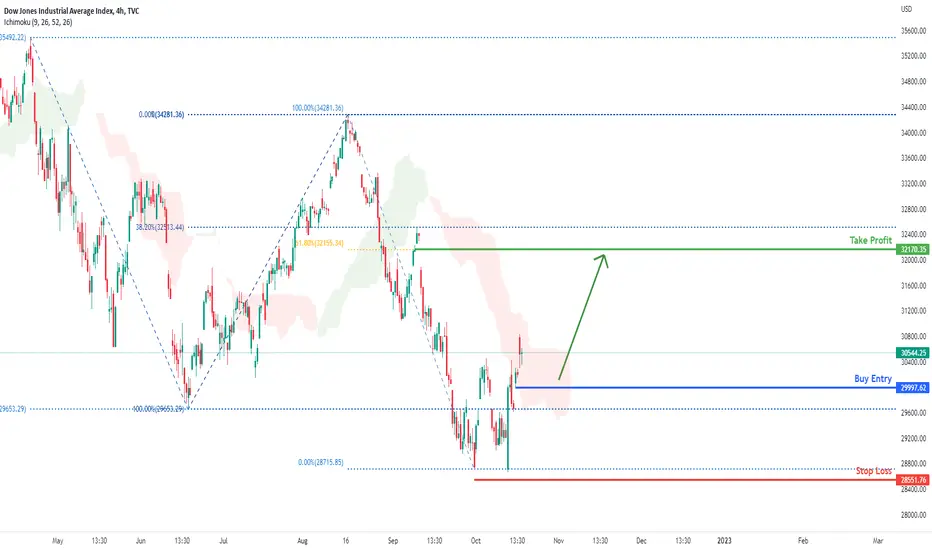
DJI Potential for Bullish Momentum | 20th October 2022The current overall bias for DJI is bearish, according to the H4 chart. However, given the CPI figure exceeded expectations, the short-term trend is expected to be optimistic. Looking for a buy entry retracement at 29997.62, which includes the market gap and the 23.6% Fibonacci line. Entry will be at the peak of the market gap to avoid missing out on the trade. The stop loss will be set at 28551.76, which is significantly lower than the previous low and also where the 0% Fibonacci line is located. The take profit point will be at 32170.35, the intersection of the 61.8% and 38.2% Fibonacci lines, as well as the market gap.
Any opinions, news, research, analyses, prices, other information, or links to third-party sites contained on this website are provided on an "as-is" basis, as general market commentary, and do not constitute investment advice. The market commentary has not been prepared in accordance with legal requirements designed to promote the independence of investment research, and it is therefore not subject to any prohibition on dealing ahead of dissemination. Although this commentary is not produced by an independent source, FXCM takes all sufficient steps to eliminate or prevent any conflicts of interest arising out of the production and dissemination of this communication. The employees of FXCM commit to acting in the clients' best interests and represent their views without misleading, deceiving, or otherwise impairing the clients' ability to make informed investment decisions. For more information about the FXCM's internal organizational and administrative arrangements for the prevention of conflicts, please refer to the Firms' Managing Conflicts Policy. Please ensure that you read and understand our Full Disclaimer and Liability provision concerning the foregoing Information, which can be accessed on the website.

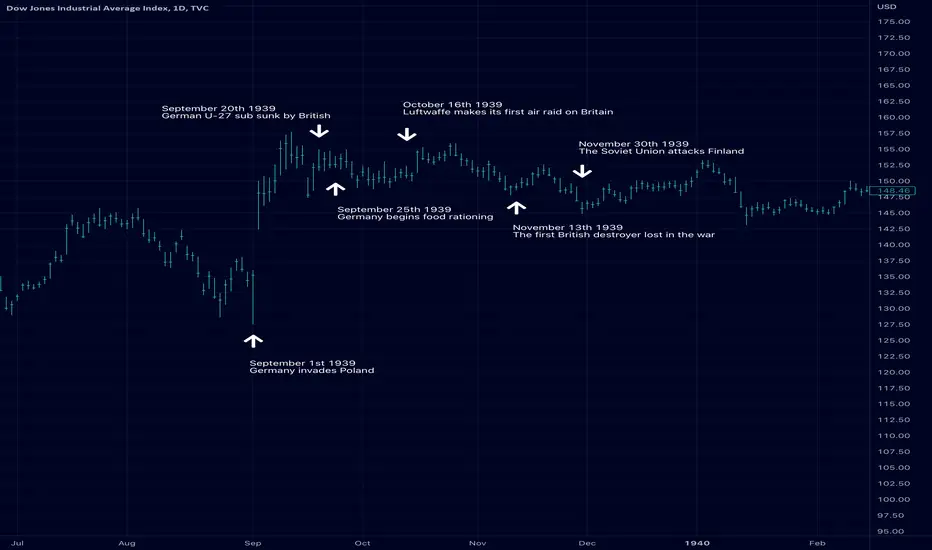
WWI: A Timeline of History [Part I]Some key dates of WW2 in 1939 overlaid with the Dow Jones Industrial Average. Part II (1940) coming soon
The S&P at Pivotal CrossroadsThe S&P 500 has run into resistance at our level at 3758. We have predicted this to be the case yesterday. Recall that we should run into prohibitive resistance here, but if not, the next target is a relative high at 3810, which we anticipate to be a ceiling. Today is a make-or-break for stocks. If they can break out, then we will be able to test higher levels, but if not, the price action is likely to 'round off' and we may retrace the entire range to 3584 or find intermediate support at 3676.

DJI Potential For Bearish ContinuationOn the H4 chart, the overall bias for DJI is bearish. Looking for a sell entry at 31981.14 where the market gap is alongside with the 50% and 61.8% Fibonacci line. Stop loss will be at 33364.70, slightly above where the 78.6% Fibonacci line is. Take profit will be at 27215.49 where the -27.2% Fibonacci expansion line and 161.8% Fibonacci extension line is.
Please be advised that the information presented on TradingView is provided to Vantage (‘Vantage Global Limited’, ‘we’) by a third-party provider (‘Everest Fortune Group’). Please be reminded that you are solely responsible for the trading decisions on your account. There is a very high degree of risk involved in trading. Any information and/or content is intended entirely for research, educational and informational purposes only and does not constitute investment or consultation advice or investment strategy. The information is not tailored to the investment needs of any specific person and therefore does not involve a consideration of any of the investment objectives, financial situation or needs of any viewer that may receive it. Kindly also note that past performance is not a reliable indicator of future results. Actual results may differ materially from those anticipated in forward-looking or past performance statements. We assume no liability as to the accuracy or completeness of any of the information and/or content provided herein and the Company cannot be held responsible for any omission, mistake nor for any loss or damage including without limitation to any loss of profit which may arise from reliance on any information supplied by Everest Fortune Group.

DJI Potential for Bullish Momentum | 19th October 2022According to the H4 chart, the current overall bias for DJI is bearish. However, because the CPI figure came in higher than projected, the short-term trend is expected to be positive bullish. Looking for a buy entry retracement at 29997.62, which comprises the 23.6% Fibonacci line and the market gap. To avoid missing out on the trade, entry will be at the peak of the market gap. The stop loss will be at 28551.76, which is slightly lower than the previous low and also the location of the 0% Fibonacci line. The take profit point will be at 32170.35, which is the intersection of the 61.8% and 38.2% Fibonacci lines and the market gap.
Any opinions, news, research, analyses, prices, other information, or links to third-party sites contained on this website are provided on an "as-is" basis, as general market commentary, and do not constitute investment advice. The market commentary has not been prepared in accordance with legal requirements designed to promote the independence of investment research, and it is therefore not subject to any prohibition on dealing ahead of dissemination. Although this commentary is not produced by an independent source, FXCM takes all sufficient steps to eliminate or prevent any conflicts of interest arising out of the production and dissemination of this communication. The employees of FXCM commit to acting in the clients' best interests and represent their views without misleading, deceiving, or otherwise impairing the clients' ability to make informed investment decisions. For more information about the FXCM's internal organizational and administrative arrangements for the prevention of conflicts, please refer to the Firms' Managing Conflicts Policy. Please ensure that you read and understand our Full Disclaimer and Liability provision concerning the foregoing Information, which can be accessed on the website.
DOWJONES this week?!We saw on Thursday the market broke the structure and on Friday went for a retracement so I think we have a nice buy entry between 29400 - 29100 price it might go lower than that for stop loss hunt aka sell side liquidity smart money is Going to fill their bags at 30900-31200 levels.

Can Exhuberance in Stocks Last?Stocks have gained after ' shrugging off ' yet another worse than expected inflation print. Additionally, traders seem hopeful of good earnings prints as banks lead the way , with strong numbers. All major indexes have risen sharply, with the S&P 500 touching our level at 3758, just below highs at 3810. The Kovach OBV has picked up sharply with the momentum, but we will see if this will last. Netflix earnings are today and there are serious questions about subscriber growth. In the event of a strong selloff, we could completely retrace this move, with 3584 likely to provide support yet again. If we are able to break through 3810, the next target is 3825.

US30 breaks range as buyers continue to pushHi, and welcome to today's update. Focus today on the US30 as buyers continue to push the case for a new up leg.
In today's video, we run over price action that proceeded the move and the battle we watched last Friday and yesterday as traders tried to hold and move passed 30,000. The break above resistance in today's Asian session is a great sign, and we want to see buyers hold this move or continue it to confirm today's move.
If buyers can continue to push the market higher, we would like to see new higher highs and higher lows that show bullish control. If we see a fade in today's NY session that closes back below 30,300 or 30,000, this would be a worrying sign that we could see the range continue.
Buying has been broad so far today in the out of hours, with the SPX500 and NDX100 seeing solid gains. This is a good sign that buying interest is firm and wide across the indexes.
Let's see if buyers can carry momentum forward into today's NY session.
We like to hear from you, so please feel free to drop us a comment. We also run weekly webinars with guest analysts.

DJI Potential for Bullish Momentum | 18th October 2022The current overall bias for DJI is bearish , according to the H4 chart. However, because the CPI report was better than predicted, the short term trend is expected to be optimistic. Looking for a retracement buy entry at 29997.62, which contains the 23.6% Fibonacci line and the market gap Entry will be at the top of the market gap to prevent missing out on the trade. Stop loss will be at 28580.62, which is slightly lower than the previous low and where the 0% Fibonacci line is located. The take profit point will be at 32170.91, where the 61.8% and 38.2% Fibonacci lines and market gap is.
Any opinions, news, research, analyses, prices, other information, or links to third-party sites contained on this website are provided on an "as-is" basis, as general market commentary, and do not constitute investment advice. The market commentary has not been prepared in accordance with legal requirements designed to promote the independence of investment research, and it is therefore not subject to any prohibition on dealing ahead of dissemination. Although this commentary is not produced by an independent source, FXCM takes all sufficient steps to eliminate or prevent any conflicts of interest arising out of the production and dissemination of this communication. The employees of FXCM commit to acting in the clients' best interests and represent their views without misleading, deceiving, or otherwise impairing the clients' ability to make informed investment decisions. For more information about the FXCM's internal organizational and administrative arrangements for the prevention of conflicts, please refer to the Firms' Managing Conflicts Policy. Please ensure that you read and understand our Full Disclaimer and Liability provision concerning the foregoing Information, which can be accessed on the website.
