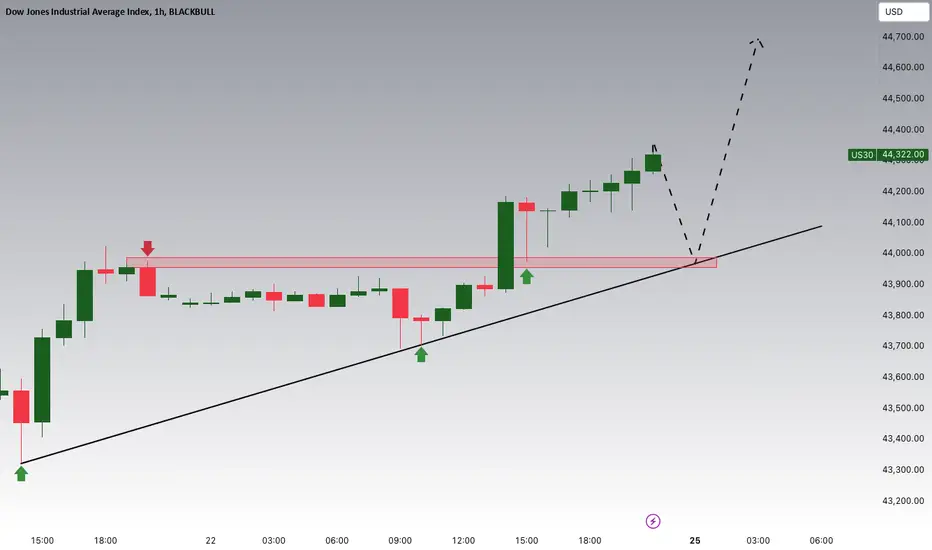
DOW JONES (1h) Death Cross turning into a buy signal soon.Dow Jones is trading inside a Channel Up that is long term supported by the MA50 (1d).
On Monday we will see a Death Cross (1h), which inside the Channel Up has been usually formed halfway through a Channel Down/bearish leg that forms the new Low.
Trading Plan:
1. Buy by next Wendesday the latest.
Targets:
1. 46000 (under a +8.31% rise from the last Low, which is where the October 18th High was priced).
Tips:
1. The RSI (4h) tends to form a bottom when it hits 30.00 (oversold limit). Be ready to buy if it hits that level earlier than next Wednesday.
Please like, follow and comment!!
Notes:
Past trading plan:
DOW

DOW JONES: Short term consolidation to lead to 46,100.Dow Jones is on a very healthy bullish 1D technical outlook (RSI = 64.961, MACD = 523.800, ADX = 24.313) as the bullish trend inside the 5 month Channel Up is still intact. In fact it is not just intact but the index is basically on All Time High levels, supported by the 4H MA50. The Channel Up is highly symmetric and technically we believe we are on the same level as September 30th. The index was inside a shorter term Channel Up, which after a 4H MA100 test, it rallied to the 1.5 Fibonacci extension. The bearish divergence on the 4H RSI was as evident then as it is now. The two fractals are virtually identical, hence we project a similar result. Buy and target the 1.5 Fib (TP = 46,100).
See how our prior idea has worked out:
## If you like our free content follow our profile to get more daily ideas. ##
## Comments and likes are greatly appreciated. ##

DOW JONES High Channel Up symmetry points to 46000.Dow Jones (DJI) easily hit our 45000 Target as suggested on our November 20 idea (see chart below), and immediately turned sideways, consolidating basically for the past 6 days:
This is not the first time that we've come across this consolidation within the 4-month Channel Up as the exact same sequence was last seen during September 20 - October 08. As with today's price action, the consolidation also took place above the 1.0 Fibonacci level and once completed, it gave one final push to the 1.5 Fibonacci extension before correcting back to the 1D MA50 (blue trend-line).
As a result, we now set a new Target for the end of the year at 46000.
-------------------------------------------------------------------------------
** Please LIKE 👍, FOLLOW ✅, SHARE 🙌 and COMMENT ✍ if you enjoy this idea! Also share your ideas and charts in the comments section below! This is best way to keep it relevant, support us, keep the content here free and allow the idea to reach as many people as possible. **
-------------------------------------------------------------------------------
💸💸💸💸💸💸
👇 👇 👇 👇 👇 👇

DOW JONES targeting 165000 in the next 8 years.Dow Jones / US30 is following very distinct and easily recognizable patterns over the years and decades and this chart gives you the complete picture since the 1930s and the Great Depression.
We are currently well underway inside the Bull Cycle, which is the market's 3rd major these past 100 years.
With the support of the 1M MA50, this Bull Cycle (via a Channel Up pattern) is expected to continues rising until the point it breaks aggressively over the pattern towards the last years of the Bubble in 2029-2033.
From bottom to top, the previous two Bull Cycles rose by an incredible +2500%.
This means that long term and patient investors can still buy now and enjot another 8 years of immense growth and returns, targeting 165000.
Note that the RSI underneath the chart is on the 12M timeframe but achieves displaying the situatio more accurately than any. Clear Bear Cycle bottoms and breakouts over the MA when the Channel Up Bull Cycle started among all Cycles.
Follow us, like the idea and leave a comment below!!

DOW JONES New High before any correction.Dow Jones / US30 is on a long term bullish pattern on a Rising Support that extends all the way from the August bottom.
The U.S. elections initiated the most recent rally that has now transitioned into a consolidation Channel Up.
Similar such patterns in the past gave one final High as long as the 4hour MA50 supported.
Buy and target 45365 (+2.50% rise)
Previous chart:
Follow us, like the idea and leave a comment below!!

DOW JONES: A few days of consolidation can push it to 46,100Dow Jones is almost overbought on its 1D technical outlook (RSI = 68.114, MACD = 449.010, ADX = 35.064) and is printing a sequence much like post September 20th. That was a consolidation Channel that paved the way to the next bullish wave on the 1.5 Fib extension. This is a 4 month Channel Up supported by the 1D MA50. As long as it does, aim for the 1.5 Fib (TP = 46,100).
See how our prior idea has worked out:
## If you like our free content follow our profile to get more daily ideas. ##
## Comments and likes are greatly appreciated. ##

DOW JONES is respecting our major August buy call beautifully.Dow Jones (DJI) is about to hit the 45000 Target on our last buy call (November 20, see chart below) and complete a +8.30% Bullish Leg rise within the Channel Up that started on the August 05 Low:
We are very pleased also to see the index making enormous progress after our big August buy (Aug 07 idea, see below) which was exactly on the last major Low of Dow:
As you can see, we successfully formulated that trade based on the extremely symmetric price action of 2016 - 2017. We've explained the notion on the previous idea, but we will refresh your memory if you read this analysis for the first time.
Dow was already trading within a Rising Wedge pattern in 2016, which towards its end broke upwards and first completed a +19.50% rally. The second Leg of the Bull rally was completed on a +30.70% rise from the pull-back Low and then the markets entered the multi-month volatile period of the U.S. - China trade wars. Key Lows of the Bull Rally were made in October 2016, April 2017 and the last in August 2017. It is important to note that after the August 2017 Low, the index had the most aggressive part of the rally, attached to the top band of the Bollinger Bands range, which is what we've called before "riding the BB wave".
Back to more recently and the Rising Wedge that started in 2022, it broke upwards in identical fashion as 2017 (first Leg +23.40%, Lows in October 2023, April 2024 and the most recent August 2024, which as you saw was our last major buy). Even the 1W RSI sequences between the two fractals are similar. What's left now is for Dow to complete a +30.70% rise from the August 2024 Low, in order to conclude the pattern from 2017.
Our long-term Target since August remains thus intact at 49000. Keep in mind that this is the essence of long-term investing/ trading and this is the strategy with the highest winning rate. Note also that if it takes the same time to conclude as the 2017 Leg did from the August 2017 Low (green Rectangle, 168 days), then the peak should be formed end of January/ early February 2025.
-------------------------------------------------------------------------------
** Please LIKE 👍, FOLLOW ✅, SHARE 🙌 and COMMENT ✍ if you enjoy this idea! Also share your ideas and charts in the comments section below! This is best way to keep it relevant, support us, keep the content here free and allow the idea to reach as many people as possible. **
-------------------------------------------------------------------------------
💸💸💸💸💸💸
👇 👇 👇 👇 👇 👇

Analysis of Dow Jones Uptrend: Opportunities and Challenges Ahea
In the 4-hour timeframe, the Dow Jones Index is moving within an ascending channel, reflecting the strength of buyers. This channel has formed since mid-October and has successfully maintained its key support and resistance levels so far. The Ichimoku indicator also highlights the strength of the bullish trend, as the price remains above the green Ichimoku cloud, which acts as strong support.
The support zone between 44,131 and 44,295 is identified as one of the most crucial areas on the chart. This region holds significant importance due to its proximity to the Fibonacci levels (0.786 and 0.886) and its alignment with the lower boundary of the ascending channel.
Technical tools such as Ichimoku and Alligator indicate that if the price returns to this zone, there is a strong likelihood of support holding and a potential trend reversal.

Dow Jones Industrial out of GasWhen I started with trading over 3 decades ago, I was told that the DJI is often the forecaster of the bigger market direction.
This week, it looks like the DOW is out of Gas.
Struggling at the U-MLH indicates the need to find balance. Balance is at the Center-Line, so DOW(n) we go.
With end of year staring at us, it's time to reduce exposure, or at least adding to the Portfolio hedge, specially when VIX is low.

Dow Jones Is Approaching Important SupportHey Traders, in today's trading session we are monitoring US30 for a buying opportunity around 44,000 zone, Dow Jones is trading in an uptrend and currently is in a correction phase in which it is approaching the trend at 44,000 support and resistance area.
Trade safe, Joe.
DOW JONES bouncing on the 4H MA200 and 0.5 Fibonacci.Dow Jones (DJI) found Support yesterday exactly on its 4H MA200 (red trend-line), after just a brief break of the 0.5 Fibonacci retracement level. The dominant pattern has been a Channel Up since the August 05 Low and within it, every 0.5 Fib test from the previous Low, has been the most effective buy entry as it started the new Bullish Leg.
The technical symmetry within this pattern is astounding as every Bullish Leg hit its 1.236 Fibonacci extension, completing a +8.30% rise. The ROC Higher Lows indicates that a rebound should be expected right now.
We haven't had a 1.236 Fib extension since the elections Low, so naturally take this 4H MA200 / 0.5 Fib bounce to buy if you haven't and target 45000 (also +8.30% rise).
-------------------------------------------------------------------------------
** Please LIKE 👍, FOLLOW ✅, SHARE 🙌 and COMMENT ✍ if you enjoy this idea! Also share your ideas and charts in the comments section below! This is best way to keep it relevant, support us, keep the content here free and allow the idea to reach as many people as possible. **
-------------------------------------------------------------------------------
💸💸💸💸💸💸
👇 👇 👇 👇 👇 👇

DOW JONES: Bottom buy signal. Target 45,600.Dow Jones just turned neutral on its 1D technical outlook (RSI = 52.982, MACD = 339.670, ADX = 28.026) as it hit today the 4H MA200 after exactly 2 weeks. This is getting very close to the bottom of the 14 month Channel Up. Technically the last two HLs were formed when the 1D RSI double bottomed on the 30.00 oversold limit. Overall, this is a good enough buy opportunity to target yet another +6.80% bullish wave (TP = 45,600).
## If you like our free content follow our profile to get more daily ideas. ##
## Comments and likes are greatly appreciated. ##

DOW JONES inside a bearish wave. Expect lower prices.Dow Jones is trading inside a Channel Up since August.
However at the moment it is still on a bearish wave.
Three out of four bearish waves of this Channel Up hit the MA50 (1d) before reversing.
With the price rejected now on the MA50 (1h), this is still a sell opportunity.
Trading Plan:
1. Sell on the current market price.
Targets:
1. 43000.
Tips:
1. The RSI (1h) is also declining. Once it turns sideways, it will be the signal to reverse to buying.
Please like, follow and comment!!

DOW JONES Early sell signal for next week.Dow Jones / US30 is trading inside a Channel Up pattern since September.
The index is on the latest bearish wave at the moment, having been rejected at the top of the Channel Up.
The 1day RSI just crossed under the MA trendline, which on 3 out of 4 occasions in the last 4 months, was a bearish signal.
The previous 2 bearish waves of the 3 month Channel Up delivered a -3.80% correction.
Sell and target the same correction at 42850, which just so happens to be exactly at the top of the Channel's buy zone.
Previous chart:
Follow us, like the idea and leave a comment below!!

DOW JONES 4H Golden Cross extending the rally.Dow Jones (DJI) gave us an excellent pre-election buy signal (October 29, see chart below) as it bottomed on the 0.5 Fibonacci retracement level and just below the 1D MA50 (red trend-line), in similar fashion as the September 11 Low, which then rallied to the 1.236 Fib extension:
As you can see, we hit our 44000 Target, which was again the 1.236 Fib ext, but a new bullish possibility emerges. The 4H RSI is about to turn bearish (below 45.00) after being overbought (above 70.00) for 7 days. Last time this happened was on August 22, the fractals are virtually identical. During that time, the price made a Higher Low and continued to peak after a +8.30% rise in total.
After another 0.5 Fib correction, the next Bullish Leg if the 3-month Channel Up was also +8.30%, indicating that there is high symmetry between the Legs of this pattern. Notice also the presence of a 4H Golden Cross both on the current as well as on the August Leg.
As a result, since we still have some distance before completing a +8.30% Bullish Leg increase, we go long again as long as the 4H MA50 (blue trend-line) holds, targeting 45000.
-------------------------------------------------------------------------------
** Please LIKE 👍, FOLLOW ✅, SHARE 🙌 and COMMENT ✍ if you enjoy this idea! Also share your ideas and charts in the comments section below! This is best way to keep it relevant, support us, keep the content here free and allow the idea to reach as many people as possible. **
-------------------------------------------------------------------------------
💸💸💸💸💸💸
👇 👇 👇 👇 👇 👇

DOW JONES Short term signal for fast profit.Dow Jones pulled back from Monday's high but the price action started to reverse today.
As long as the MA50 (4h) holds, we expect a quick rebound (at least) like the ones after the October 16th and September 18th pull backs.
Those rebounds gave rallies of +1.57% and 1.79% respectively.
Trading Plan:
1. Buy on the current market price.
Targets:
1. 44450 (+1.57%).
Tips:
1. The RSI (4h) is also showing a temporary bottom similar to October 16th and September 18th.
Please like, follow and comment!!
Notes:
Past trading plan:

DOW JONES: Short term target 44,850.Dow Jones is almost overbought on its 1D technical outlook (RSI = 69.283, MACD = 438.030, ADX = 26.531) and on top of that, the 4H RSI has been inside overbought territory since November 5th. The price action remains inside the Channel Up that started in August but every time the 4H RSI trades sideways like this on overbought ranges, the price enters a smaller Channel Up and leads to the peak HH. That's what we are aiming for now (TP = 44,850).
See how our prior idea has worked out:
## If you like our free content follow our profile to get more daily ideas. ##
## Comments and likes are greatly appreciated. ##

SUPER STOCKS 2023 notes & issues for POSiTiONiNG there are stocks driven by MARKET .. meaning float is out in the public
that normally has a DRUNK price action with gaps and erratic volume
there are issues with an assigned Specialist
that can TRADE or CROSS huge volume without moving the price or go beyond a range RANGE
highlighted ones have been decided by both the MARKET and the MARKET MAKER
best of both worlds where artificial price meets the wisdom of PUBLiC
Vanguard holds most or is the CUSTODY of most issues
Citadel & the gang of 3 manages the FLOAT
FUNDS are public
PUBLIC is barometer for entry or exit of Sovereign and Trust Fund babies on a 3 5 7 10 year cycle
determined by the FED's cost of printing borrowinng and lending
note:
Market Cap is dated June 22, 2022 ... Bottom are of MARKETS

DOW 41k, YOU'RE GONNA WANNA PAY ATTENTION TO THIS PRICE TARGET41k is a massive resistance price target
meaning, it is likely to hit allowing exits at profit.
If it hits there is potential to see it bounce around even as high as 54k in a short term, but ultimately, at some point it will need to retest the lower end price targets.
If it were to do that sooner rather than later, it allows for a more natural growth in the price.
Meaning, there is a lot of potential to see the price melt up from 41k and then keep going.
OR more likely, there is a lot of potential to see a drop, possibly even a steep drop from 41k.
Either way, the downside takes us around 20% and then as high as 40% down from 41k.
I included 9k as a potential target, but I don't think we see baring a nuclear bomb being set off on the moon, but anything is possible.
All in
Mark Cuban, Sold stake in Mavs
Jeff Bezos, Sold Amazon stock
Warren Buffet, Sold Apple
Ryan and Carl, Buying BBBY
Multiple sports teams for sale, sold or being shopped
Massive deals everywhere
If you need any more signs that a top is near, with potential to crash hard allowing for a buy the dip scenario. Here is a small sample of it.

TRUMP is the 47th President! Is this bullish for the markets?Donald Trump is the new (47th) President of the United States, coming into office for his 2nd time. The practical question on the investor's mind is of course how will the stock markets react?
Even though there is no definitive way to approach this, the fact that Trump will resume power for a 2nd term, gives us a historic data set to have grounds for comparison. Fundamentally anything can be discussed on policies and strategies etc but technically the picture is more objective.
As you can see on this Dow Jones (DJI) chart displayed on the 1W time-frame, Trump's 1st Presidential win was on November 08 2016. At that time, the market was trading within a Channel Up that started after a 1W MA200 (orange trend-line) double test on January 19 and February 08 2016. Right before the Elections, the index experienced a natural 'Pre-election volatility' phase.
The picture during the current election period isn't very different from 2016. As you can see, Dow started a Channel Up pattern after a 1W MA200 test and half-way through the year started to experience the usual 'Pre-election volatility' phase. During that time both in 2024 and 2016, the 1W MA50 (blue trend-line) was supporting and stayed intact. Notice how even the 1W RSI sequences between the two fractals are similar from the time the Channel Up started until the elections.
So naturally you are asking what does that mean for us moving forward? Well after the November 08 2016 elections and Trump's 1st win, Dow started to rise aggressively immediately and by March 2017 it almost reached the patterns top (Higher Highs trend-line) before the new medium-term relief pull-back. The post-election Bull Phase was concluded in January 2018, upon completing a +71% rise from the Channel's bottom and 7.0 Fibonacci extension from the volatility phase.
So if symmetry acts its part, we may see 47000 by March 2025 and 55000 (+71% from the October 2023 bottom) by the end of 2025. Is this projection definitive? Of course not, nothing is 'absolute' in investing/ trading. But history has shown that the stock market has reacted more than positively after the U.S. elections, particularly in the case of a Trump win.
What do you think? Will Trump's 2nd term be bullish?
-------------------------------------------------------------------------------
** Please LIKE 👍, FOLLOW ✅, SHARE 🙌 and COMMENT ✍ if you enjoy this idea! Also share your ideas and charts in the comments section below! This is best way to keep it relevant, support us, keep the content here free and allow the idea to reach as many people as possible. **
-------------------------------------------------------------------------------
💸💸💸💸💸💸
👇 👇 👇 👇 👇 👇

DOW JONES: Important 1H breakout that is targeting 43,000Dow Jones has turned neutral again on its 1D technical outlook (RSI = 48.701, MACD = -64.350, ADX = 34.811) as it formed the new bottom on the 3 month Channel Up and that pushed the price into a rally which today crossed over the LH trendline and the 1H MA200 for the first time since October 22nd. The 1H RSI was on a Bullish Divergence (HL) against the LL of the price, so all indicators are bullish and calling for more upside. The 0.786 Fibonacci level is the next short term target (TP = 43,000).
See how our prior idea has worked out:
## If you like our free content follow our profile to get more daily ideas. ##
## Comments and likes are greatly appreciated. ##

DOW JONES Quick sell signal before the elections result.Dow Jones is trading inside a Channel Down since October 21st.
Following the rejection on the MA200 (1h), it started the new bearish wave.
Trading Plan:
1. Sell on the current market price.
Targets:
1. 41400 (-2.70% decline like the first bearish wave of the Channel).
Tips:
1. The RSI (1h) is also printing a Rising Support pattern like the one during the previous bearish wave.
Please like, follow and comment!!
Notes:
Past trading plan:

DOW JONES: Bottom of the Channel Up.Dow Jones turned bearish on its 1D technical outlook (RSI = 42.00, MACD = 51.000, ADX = 21.000) as it almost hit the bottom of the Channel Up pattern. It is about to form a Death Cross on the 4H timeframe, which will be the first since August 8th that was technically the bottom of July's correction and start of the current Channel Up. We expect the bottom to be priced either today or tomorrow and the RR is good enough to buy. We aim for the 1.5 Fibonacci level (TP = 44,000), which priced the previous two HH.
## If you like our free content follow our profile to get more daily ideas. ##
## Comments and likes are greatly appreciated. ##
