DOW JONES Bottom is being formed. Buy for 44000 immediate TargetDow Jones (DJI) eventually made a bullish break-out on our last analysis (October 08, see chart below) and hit our 43200 invalidation Target:
The 3-month Channel Up is still holding and the price is now on the 4H MA200 (orange trend-line) and near the bottom (Higher Lows trend-line) of the pattern. The 4H RSI has completed a bottoming sequence similar to the September 11 Higher Low.
As long as the 1D MA50 (red trend-line) supports (closes 1D candles above), this will be a buy opportunity. Our Target is 44000, which is the 1.236 Fibonacci extension, similar with the previous Higher High.
-------------------------------------------------------------------------------
** Please LIKE 👍, FOLLOW ✅, SHARE 🙌 and COMMENT ✍ if you enjoy this idea! Also share your ideas and charts in the comments section below! This is best way to keep it relevant, support us, keep the content here free and allow the idea to reach as many people as possible. **
-------------------------------------------------------------------------------
💸💸💸💸💸💸
👇 👇 👇 👇 👇 👇
DOW

Dow: Key data, earnings and US election all coming upStocks rebounded on Monday with oil prices taking a 5% plunge, amid an apparent easing in Middle East tension. The restrained reaction by Israel after recent attacks has spurred optimism, with markets hoping for stability in the region. European indices closed higher as we begin a very busy two weeks, with lots of data, US election and central banks meetings on the way.
Treasury yields could take toll on stocks
With the 10-year rising to a new 3-month month high of 4.29%, this could unravel risk assets. Having just closed lower for the fifth consecutive day, resulting in a weekly loss of more than 2.5%, the Dow could be the one to watch for potential underperformance. Small caps also slumped last week, while the tech-heavy Nasdaq finished flattish, helped by Tesla’s earnings and Nvidia surging to a new record high.
Looking under the hood, financials (XLF) led the drop on Friday with a fall of 1.1% and nearly 2.1% for the week. Industrials (XLI) lost 2.8% on the week, while energy (XLE) lost 0.6% on the week and ensured a hattrick of weekly losses. Technology (XLK) was flat on the week, while semiconductor (SMH) rose 0.6%. Once again gold outperformed with GLD rising 0.8% last week.
With financials and industrials taking the biggest hit, and energy also not doing great, the Dow and Russell are the obvious markets for the bears to potentially target, if sentiment turns sour again.
Economic Data Points to Slower Rate Cuts
Last week’s stronger economic indicators have reinforced expectations that the Federal Reserve may take a measured approach to future rate cuts, but will that change in the week ahead with some top-tier data to come including JOLTS, non-farm payrolls and ISM surveys? Last week’s data releases—such as jobless claims, services PMI, and durable goods orders— all surpassed forecasts, suggesting economic resilience. If we see a similar outcome from most of this week’s data releases, then that could even raise question marks over further rate cuts beyond the two more priced in for this year, as the Fed may be more inclined to wait and see before easing policy further.
While a strong economy supports corporate earnings, it can also sustain higher yields, which may weigh on stock valuations. As a result, traders and investors are closely watching incoming data to gauge whether the Fed will indeed adopt a more gradual approach to rate reductions.
US Election Uncertainty Adds Pressure
The US presidential election is also in focus, with polls and odds markets showing a close race. Some betting markets are leaning toward a Trump victory, while other polls show a tie. A Trump win could have inflationary implications, potentially impacting the Federal Reserve’s approach to rate policy. Given Trump’s policies, investors may anticipate a more aggressive Fed response to manage potential inflation, which could affect stock prices and increase market volatility.
The uncertain outcome has led investors to adopt a cautious stance, with many waiting to see how the election results may influence the Fed's future policy decisions and overall market sentiment. This has been evident in markets falling last week, VIX rising and gold hitting new record highs.
Upcoming Earnings and Economic Reports
As we head into a pivotal week and a half, several high-impact events could shape market direction. Investors are bracing for a series of earnings reports from major companies, often referred to as the "Magnificent 7" stocks, alongside the US monthly jobs report. These, combined with the US election on November 5, represent a series of risk events that could sway investor sentiment.
Given the recent increase in yields, strong economic data, and the close election race, it is unlikely we’ll see investors rush to buy the dips. For now, a cautious approach may be warranted as investors navigate these uncertainties and await clearer signals for the market’s direction.
Week ahead: Jolts, BoJ, NFP and lots of earnings
There are at least a couple of major macro factors that could impact the Dow this week, while on a micro level, several tech names are reporting their results.
1) JOLTS Job Openings (Tuesday)
With the Fed’s focus turning to employment, we will give preference to any labour market indicators over other data releases in the next couple of months. Though this data release is not very up to date (with this one covering August), it can still impact the market because job openings are a leading indicator of overall employment, and they usually take a few months to be filled. Last time we saw a surprisingly strong print of 8.04 million, aiding the dollar’s rally.
2) US nonfarm payrolls (Friday)
Last month’s surprisingly good nonfarm payrolls data helped to fuel a big rally in the dollar as the market was forced to drop its calls for further outsized rate cuts from the Fed. Let’s see if those numbers will be revised and whether the strength in the labour market continued for another month. Any further strength in employment data could even call into question the now lower expectations of 50 basis points worth of more rate cuts in the next two FOMC meetings in 2024. This will undoubtedly move the Dow and other US indices too.
Dow key levels to watch
The technical Dow forecast has turned a tad bearish following last week’s drop. The last weekly drop of a similar magnitude took place in early September. That time, though, there was no immediate election risk, and so the index quickly bounced back and went on to hit new records in the pursuing weeks. This time, it could be different. Still, we will need to see a lower low to confirm the bearish reversal beneath the last short-term low at 41,800.
If seen, we could see a sizeable drop with the next obvious support not seen until around 40,900 to 41,000 area. The longer-term trend line and 200-day average converge around the psychologically important area of 40,000.
Standing in the way of these potential support levels is another one close to where the market finished on Friday and where it has staged a bounced from today, around 42,000.
In terms of resistance levels to watch, the most important one in my view lies at 42,400 to 42,500. This area is now pivotal insofar as the short-term technical outlook is concerned.
By Fawad Razaqzada, market analyst with FOREX.com

DOW JONES: testing the 4H MA200 and is expected to rebound.Dow Jones is on a neutral 1D technical outlook (RSI = 48.958, MACD = 306.300, ADX = 31.951) as the Channel Up pulled back to almost test the 4H MA200 for the first time since the September 11th Low. This is basically the top of the support zone of the Channel Up and based on the 1D RSI, a strong buy candidate. We turn bullish, aiming at the 1.5 Fibonacci extension (TP = 43,900).
See how our prior idea has worked out:
## If you like our free content follow our profile to get more daily ideas. ##
## Comments and likes are greatly appreciated. ##

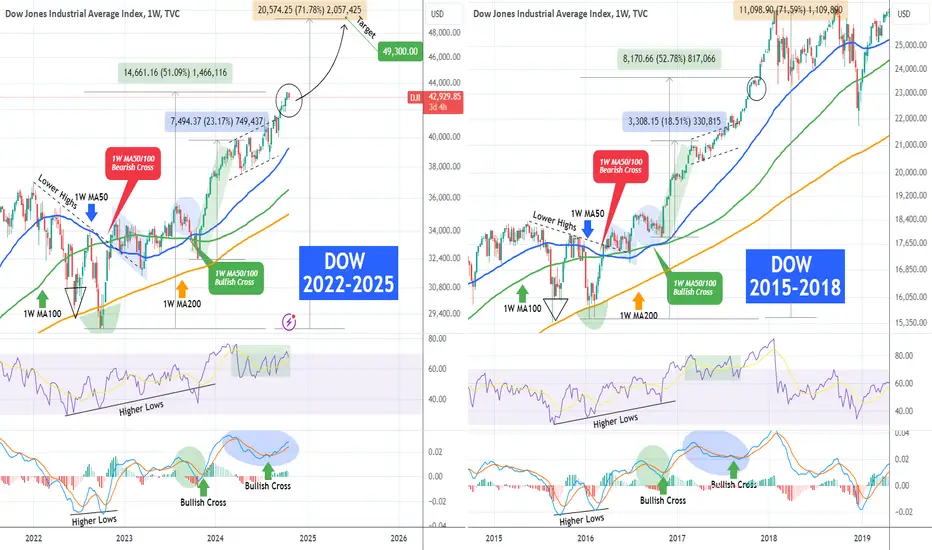
DOW JONES ahead of an huge rally based on the 2017 fractal.More than a year ago (September 13 2023, see chart below), we posted a long-term fractal comparison for Dow Jones (DJI) between the 2022 - 2025 and 2015 - 2018 periods:
As you can see the 1W MA50/100 Bullish Cross eventually placed the index on a huge rally (even though it had to go lower for a month) that hit Target 1 at 42000. The 1W RSI and MACD sequences in 2024 however evolved in such a how that we have to re-adjust the patterns in order to fit the 2017 price action.
The charts now display very symmetric fractals and it appears that we are now on a short-term consolidation (circle) after a +50% rise from the September 2022 bottom. In November 2017, that was the final consolidation before the most aggressive rally of the Bull Cycle that made Dow top and then pull back to test its 1W MA50 (blue trend-line).
As a result, we move our final target even higher at 49300, which represents a +71% rise from the 2022 bottom, similar to the rise that priced the January 2018 High.
-------------------------------------------------------------------------------
** Please LIKE 👍, FOLLOW ✅, SHARE 🙌 and COMMENT ✍ if you enjoy this idea! Also share your ideas and charts in the comments section below! This is best way to keep it relevant, support us, keep the content here free and allow the idea to reach as many people as possible. **
-------------------------------------------------------------------------------
💸💸💸💸💸💸
👇 👇 👇 👇 👇 👇
DOW JONES 1hour Channel Up on its bottom. Buy.Dow Jones / US30 is trading inside a Channel Up and the price hit its bottom today.
By doing so it almost tested the 1hour MA200, which is holding since October 9th.
Also it completed a decline identical in % terms with the first one of the pattern.
This is a strong buy opportunity. Buy and target 43,450 (top of the Channel Up).
Follow us, like the idea and leave a comment below!!

DOW JONES: Turned the previous Resistance into Support.Dow Jones is bullish on its 1D technical outlook (RSI = 63.922, MACD = 449.140, ADX = 44.993) as it recovered yesterday's losses but more importantly it is rebounding at the top of the former Channel up. Having broken over it 3 sessions ago, two short term patterns emerged a Rising Wedge (HH, HL) and a Channel Up. If the HH trendline is crossed, it will be the perfect buy signal to target the top of the short term Channel Up (TP = 44,000). The 1D RSI shows that a rally similar to July 10th is possible.
See how our prior idea has worked out:
## If you like our free content follow our profile to get more daily ideas. ##
## Comments and likes are greatly appreciated. ##

DOW JONES Channel Up is turning bearish gradually.Dow Jones is trading inside a Channel Up and is currently very close to its top.
So far the bullish wave is a +8.03% from the last Low.
The previous bullish wave topped after a +8.33% rise.
Technically the index is very likely to top now or on the next MA50 (4h) rebound.
Trading Plan:
1. Sell on the current market price.
Targets:
1. 42000 (above the 0.5 Fibonacci level, where the last Low was priced).
Tips:
1. The RSI (1d) just crossed below its MA trend line. This was the ultimate sell confirmation (September 3rd) on the previous High.
Please like, follow and comment!!
Notes:
Past trading plan:

DOW JONES 15 year cheat-sheet that can make you rich!Dow Jones (DJI) is extending what seems a relentless rally since the August 05 Low, which was the most recent short-term correction, but in reality the index has been rallying very aggressively since the October 23 2023 Low.
That was when after a 3-month correction, it found Support above the 1W MA200 (orange trend-line) and 2 weeks later it reclaimed the 1W MA50 (blue trend-line), which has been supporting ever since. So basically the index has been on a 1W MA50 Support for 1 whole year!
What's more striking however and what short-term traders/ investors tend to ignore are the long-term Cycles of a financial asset. And Dow being one, is no exception. As mentioned, the 1W MA200 supported the October 23 2023 Low and in effect has been holding since October 10 2022 (so for 2 full years!), two weeks after the Inflation Crisis bottom. Since then we have been inside a Bull Phase.
This is part of a greater trading Cycle for Dow, one that started 1 year after the March 2009 market bottom of the historic Housing Crisis. As you can see, the pattern is recurring and the phases have a high symmetry and frequency among them.
First and foremost, they tend to do two Lows within a 1 year span, which is essentially the Bear Phase, which finds Support on the 1W MA200 (exception was of course the Black Swan of the COVID flash crash but it is of course a non-technical irregularity event) and then rebounds, effectively starting the Bull Phase.
The first 2 Bull Phases rose by +75.80%, while the most recent by +70.80%, so we are roughly around the same strength levels. Also as far as duration is concerned, the 1st Bull Phase lasted for 1239 days (177 weeks), the 2nd for 1134 days (162 weeks) and the 3rd for 1106 days (158 weeks). Again the time element is quite similar. Notice also the similar pattern that the 1W MACD prints every time Dow enters the final part of the Bull Phase.
As a result, if we apply those dynamic conditions on the current Bull Phase, we can see that a minimum rise of +70.80% from the bottom, should peak a little over 48000, and if it last a minimum of 1106 days (158 weeks) it should come to an end and price the top by October 06 2025.
This indicates that we have at least another full year of bullish trend ahead of us and a fair Target could be 48000.
As you realize, investors who are methodically following this 15 year old cheat-sheet, know where and when to buy/ sell and that achieves investing's two main principles: Profit Maximization and Risk Management. Patience and proper management within such Cycles are what "can make you rich" indeed.
-------------------------------------------------------------------------------
** Please LIKE 👍, FOLLOW ✅, SHARE 🙌 and COMMENT ✍ if you enjoy this idea! Also share your ideas and charts in the comments section below! This is best way to keep it relevant, support us, keep the content here free and allow the idea to reach as many people as possible. **
-------------------------------------------------------------------------------
💸💸💸💸💸💸
👇 👇 👇 👇 👇 👇

DOW JONES Still bullish. Drop expected end of month.Dow Jones / US30 is trading inside a Channel Up since August 5th.
Despite the mini rally since last Monday, the rise isn't technically over as the overbought (>70.00) 4hour RSI is on a level similar to where the two bullish waves before entered a slower but still upward trend until they priced a higher high.
Buy and target 43900.
Follow us, like the idea and leave a comment below!!

DOW JONES: Channel Up extending. 43900 possible this month.Dow Jones is on very steady bullish levels on its 1D technical outlook (RSI = 60.810, MACD = 361.330, ADX = 26.315) and this is further displayed on the chart where the two month Channel Up has ended its consolidation and should technically move to the next HH. The 1D MACD is close to a new Bullish Cross, the strongest validation for buying inside this Channel. We expect to see the index reach its top within this month (TP = 43,900).
See how our prior idea has worked out:
## If you like our free content follow our profile to get more daily ideas. ##
## Comments and likes are greatly appreciated. ##

DOW JONES Short-term correction or invalidation?Dow Jones (DJI) has been trading within a Channel Up ever since the August 05 bottom and right now finds itself below the 4H MA50 (blue trend-line). This is because based on the Higher Highs sequence, the pattern has topped and is potentially looking for the new Higher Low.
As long as the 42400 Resistance is holding, we will be expecting a short-term correction towards the 4H MA200 (orange trend-line), with a projected Low around 41600. Note that it will be above the 0.5 Fibonacci retracement level, where the September 11 Higher Low was priced.
If the 42400 Resistance, which we call the invalidation level for shorts, breaks first then we will take the loss on the short and turn bullish instead. The last Higher High was priced marginally above the 1.236 Fibonacci level, so that will be our Target (43200).
-------------------------------------------------------------------------------
** Please LIKE 👍, FOLLOW ✅, SHARE 🙌 and COMMENT ✍ if you enjoy this idea! Also share your ideas and charts in the comments section below! This is best way to keep it relevant, support us, keep the content here free and allow the idea to reach as many people as possible. **
-------------------------------------------------------------------------------
💸💸💸💸💸💸
👇 👇 👇 👇 👇 👇

DOW JONES Channel Up top. Sell signal.Dow Jones topped on its 6 month Channel Up, turning sideways for the past 2 weeks.
As long as the price trades inside the Channel, this is a sell signal
Trading Plan:
1. Sell on the current market price.
Targets:
1. 41150 (potential contact with the MA50 (1d) and inside the dashed Channel Up).
Tips:
1. There is a huge Bearish Divergence on the RSI (1d), similar to the one on Jan - March 2024.
Please like, follow and comment!!
Notes:
Past trading plan:

DOW JONES: Small pullback will offer a buy opportunity.Dow Jones is about to turn neutral on the 1D technical outlook (RSI = 57.040, MACD = 399.580, ADX = 38.469) as it crossed below its 4H MA50, withi the 4H RSI already on a bearish divergence, pointing to a short term correction. We expect that to be on or a little under the 4H MA200 and then rebound (over the 0.5 Fibonacci level) like the September 11th low. Like then, we are targeting the 1.236 Fibonacci extension (TP = 43,200).
## If you like our free content follow our profile to get more daily ideas. ##
## Comments and likes are greatly appreciated. ##

DOW JONES Pull-back possible but maintain long-term perspectiveA little more than 2 months ago (July 25, see chart below) we argued that Dow Jones' (DJI) correction wasn't over and called for a deeper buy, setting then a long-term Target of 42400:
The Target got finally hit on Friday, giving us an excellent risk/ reward ratio on our investment. As however the price almost reached the top of the 2-year Channel Up, we have to issue a warning for a potential short-term correction.
The 1D MA50 (blue trend-line) has successfully supported on September 11 last time and won't be odd to see another re-test after almost a month. The similarities after all between the first part of the 2-year Channel Up and the second (the one we're currently in) are still noticeable and on 1D RSI terms we may be symmetrically around the November 20 2023 level.
However, we may see this time the Channel Up break to the upside for the first time after the elections. Regardless of the short-term volatility, our medium-term Target as we will be heading into December is 44500. That is the 2.5 Fibonacci extension, similar to where the April 01 High was priced.
-------------------------------------------------------------------------------
** Please LIKE 👍, FOLLOW ✅, SHARE 🙌 and COMMENT ✍ if you enjoy this idea! Also share your ideas and charts in the comments section below! This is best way to keep it relevant, support us, keep the content here free and allow the idea to reach as many people as possible. **
-------------------------------------------------------------------------------
💸💸💸💸💸💸
👇 👇 👇 👇 👇 👇

US30 (DowJones) - Daily Bearish SetupThe BLACKBULL:US30 index experienced a bullish spike, followed by a period of consolidation within a bullish channel. However, after a fake breakout above the upper boundary of this channel, it appears that the index could be poised for a downward correction. Based on the technical analysis, a fall toward the lower boundary of the channel is expected, providing traders with potential shorting opportunities in the near term.
Fundamentally, stock market volatility tends to rise during September, a historically weak month for stocks. This pattern is often attributed to traders returning from summer vacations, rebalancing portfolios, and increased bond offerings, which divert capital away from equities. In 2024, this volatility is further exacerbated by uncertainty around the Federal Reserve’s rate decisions and the upcoming U.S. presidential election. Investors are closely watching labor market data, inflation trends, and the Fed’s stance on potential rate cuts, all of which could impact market sentiment and drive further fluctuations in stock prices.
With the TVC:DJI at the top of the bullish channel and signs of weakness after the fake breakout, a pullback to the lower end of the channel seems likely. Traders should stay cautious and monitor key economic events and technical signals for opportunities to re-enter positions at more favorable levels.

(DJI) Dow Jones Index Shooting Star Topping TailDow Jones Index has a shooting star topping tail and there is high probabilities this is the top for DJI. It's time for markets to start pricing this upcoming depression. The only thing that would cancel out this topping tail is a close above it.
Welcome to the great depression 20-30 year bear market is coming

DOW JONES may be entering a wide 4 month consolidation phaseDow Jones / US30 reached the top of the historic Channel Up that started 2 years ago on October 3rd.
Technically that calls for a strong short. Last time that happened in April 1st, the index turned sideways on a wide consolidation.
The other 2 Higher High rejections caused Channel Down corrections.
Technically the time to rebound again will be closer to the 1week MA50 but that can be in December.
Until then, buy low and sell high within 42250 and 43350.
Follow us, like the idea and leave a comment below!!

DOW JONES: At the top of the six month Channel Up.Even though Dow Jones has reached the top of its Channel Up pattern, it remains on very balanced bullish technicals on the 1D time-frame (RSI = 62.120, MACD = 487.030, ADX = 32.488). Our trading plan will be based upon breakouts. As long as the price remains under the top of the Channel Up and over the dashed trendline of the August wave, it is a no action (do nothing). If it crosses above the top of the Channel Up, it's a buy (TP = 43,500) as most likely we will see an extension of the wave to a new +8.28% rise. If the price crosses under the dashed trendline, its a sell (TP = 40,900) to the 1D MA50 at least.
See how our prior idea has worked out:
## If you like our free content follow our profile to get more daily ideas. ##
## Comments and likes are greatly appreciated. ##

DOW JONES shows no signs of slowing down.Those of you who are worried if the upcoming November U.S. Presidential Elections or medium-term pull-backs (such as those of July and April 2024 or August - October 2023), pose a threat to your investments, you have a strong reason to relax and feel safe and that is the current chart.
On this 1M time-frame analysis, we see Dow Jones (DJI) in almost the past 30 years (since late 1997) and the Cycles that have defined its Tops and Bottoms. As you can see, initially there is a clear (green) Channel Up that is always trading above the 1M MA50 (blue trend-line), leading to the eventual Top, which in turn initiates the Bear Cycle (red Arc).
The use of the Sine Waves make a great fit for the bottoms in particular. It is interesting to mention that the time period between the end of each (green) Channel Up and the start of the next one is approximately 40 months (3.3 years). Also since the 2008 Housing Crisis, we can see that a wide Channel Up has been the dominant pattern driving the expansion of Dow.
With the above information in mind, we can reach the conclusion that the index is only now entering that aggressive green Channel Up of the Bull Cycle, meaning that the Cycle is far from over and if anything, we are approaching its middle. In fact, the 3.3 year (40 month) time gap has just been completed, so there is a full Channel Up expansion ahead of us.
Now, how high can that get? Well if each Bullish Leg of the 2008 emerged Channel Up is 40% less than the previous, then we are looking for at least a +100% rise from the September 2022 bottom, giving us a rough 57000 Target on a 5-year horizon. Again that doesn't mean that we won't have medium-term pull-backs (like those mentioned in the opening paragraph) along the way, they are necessary and they reset the prices in order to attract more liquidity and investors, but on the long run you can feel comfortable holding your stocks.
-------------------------------------------------------------------------------
** Please LIKE 👍, FOLLOW ✅, SHARE 🙌 and COMMENT ✍ if you enjoy this idea! Also share your ideas and charts in the comments section below! This is best way to keep it relevant, support us, keep the content here free and allow the idea to reach as many people as possible. **
-------------------------------------------------------------------------------
💸💸💸💸💸💸
👇 👇 👇 👇 👇 👇

DOW/US30 waiting for confirmation. We are waiting to short US30/DOW at 42145 to 42152 - The current price is 42162
target at 42094
target at 42017
and target at 41946
Once the first target is hit, bring stop loss to BE level

TIME TO SHORT US30 AT 42192-42185We have setting up this trade for last 4 hours
we been successfully short them earlier.
First target will be at 42037, please ensure take profit 50%
bring stop loss to BE
then target further. to 41968.2
then target 3 at 41889

DOW JONES Is a post Fed decline valid before an October rally?The day has come when the Fed will finally cut the Interest Rates for the first time since the early 2022 hike cycle and the question in the market is whether it will be by -0.25% or -0.5%.
High volatility is expected intra-day but technically Dow Jones (DJI) remains within an uptrend (Channel Up) both medium-term (5-months) and long-term (2 years). The last support and bounce was offered by the 1D MA50 (blue trend-line) on September 11 and that broke the remarkable symmetry that the index had so far with the March - August 2023 fractal.
That fractal suggested that after a (dotted) Channel Up, the index should make a correction below the 1D MA200 (orange trend-line) but on September 11 instead of breaking below the 1D MA50, the index rebounded (as mentioned above) and diverged from the fractal.
This means that the Bullish Led (green Channel Up) may this time start earlier and the rally may break above the 2-year Channel Up and finally deliver a new long-term pattern, possibly more aggressive.
Seasonality however is a big factor for investors and as we can see, the last two Septembers (2023, 2022) have been bearish, extending corrections that started in August but eventually managed to price a bottom in October.
As a result, any remark by Chair Powell during the press conference that isn't well received by the market, can initiate a short-term pull-back towards the 1D MA200, ranging from -5.07% to -6.90%.
In our opinion, if that takes place, it will be a tremendous buy opportunity until at least the end of the year. If however Powell delivers what the market is expecting (and more), we expect the pattern to continue its divergence from the 2023 fractal and enter the more aggressive bullish pattern earlier. If the more aggressive pattern prevails, a 46000 target is very probable by the end of the year.
Notice that this divergence is also evident when comparing the 1D RSI sequences of the two fractals.
-------------------------------------------------------------------------------
** Please LIKE 👍, FOLLOW ✅, SHARE 🙌 and COMMENT ✍ if you enjoy this idea! Also share your ideas and charts in the comments section below! This is best way to keep it relevant, support us, keep the content here free and allow the idea to reach as many people as possible. **
-------------------------------------------------------------------------------
💸💸💸💸💸💸
👇 👇 👇 👇 👇 👇

DOW JONES: Is it forming a BLOW OFF TOP??Dow Jones isn't just having a strong bullish momentum on the 1D timeframe but also on its 1W technical outlook where it maintains a steady bullish overall indicator score (RSI = 64.010, MACD = 036.840, ADX = 29.553). However there are growing concerns coming from the 1W chart as the 1W RSI is posting a Bearish Divergence, trading on a Channel Down while the actual price is on a Channel Up.
This is alarming because last time this showed up was in late 2021 and as we all know led to the bear market of 2022. However the Bearish Divergence prior to that (mid 2017) was false and Dow continued to rise instead for another 4 months before a correction to its 1W MA50. And that is the level that plays the most important role here, the 1W MA50. As long as it continues to support, we will have a bullish trend.
Actually, Dow seems to be attempting a breakout over the Channel Up this month, unlike December 2021. Failure to break though can result into a blow off top.
## If you like our free content follow our profile to get more daily ideas. ##
## Comments and likes are greatly appreciated. ##
