Dow outlook – Index may test 4-hr 100-MA support
As noted last week, Dow has volume divergence as well as RSI divergence on 4-hr chart.
Price dropping below hourly 50-MA level of 18,489 levels only adds credence to the bearish divergences noted above.
Consequently, we may see index drift lower to 18,297 (hourly 100-MA).
Dow30

Dow30 – Low volumes, possible RSI divergenceWith index at record highs, it is safe to either stay on the sidelines or search for signs of a pull back.
Moreover, with stocks at record highs along with recent improvement in fundamentals, the question changes from ‘when will Fed raise rates” to “Why isn’t Fed raising rates”.
The index is showing signs of weakness on 4-hr chart
A bearish price-RSI divergence has been confirmed, RSI has breached rising trend line as well, the index now needs to breach support at 18,480 as that would add credence to bearish divergence.
A weak closing would also confirm bearish price RSI divergence on daily chart.
Look at price and volume – The entire rally from Feb lows have been accompanied by falling volumes. People have just lacked trust in the rally and hence a correction appears likely.
A corrective move could take the index down to 18,300-18,250. On the other hand, a move above 18,636 would negate the bearish divergence.

GS - Earnings beats estimates, will it break double bottom?Goldman has topped earnings expectations. CEO Lloyd Blankfein said the firm did well across all of its businesses, despite the uncertainty created by Britain's vote to leave the European Union.
Results highlight
Earnings per share of $3.72 and Revenue of $7.932 billion. Analysts were expecting earnings of $3 a share on revenue of $7.581 billion, according to a Thomson Reuters consensus.
Thoughts on share price
The stock is down 9% this year. What this means is despite recent sharp recovery from June 27 low, there exists a potential for further upside in the pair. Upbeat quarterly results may just be the catalyst for further upside. However, note the strong results may have been priced-in by the markets and if so we could see 'sell the fact' trade.
Double bottom on daily chart
Double bottom neckline stands at 168.90. Monday's closing is 163.33. The recent rally from June low has seen three gap up openings. The third one is usually the sign that 'dumb' money has entered. The larger falling trend line resistance is seen around 167.50.
Unless we do not see a daily closing above double bottom neckline, it is advisable to stay on the sidelines. On the other hand, a failure to take out falling trend line over next couple of weeks despite strong quarterly results could yield a fresh drop towards 140 levels.

Dow Transportation is lagging behindDow transportation index (on the left had side) is still trading inside a falling trend line and way below the record high. On the other hand, we have Dow 30 which is just a 100 points away from record high.
Note on both the charts, daily RSI is breaking higher from the falling trend. For Dow30 it means, fresh highs are possible. However, for Dow Transportation index, a breakout in the RSI won't help, simply because the index first needs to take out the falling trend line.
Investors should watch out for a failure at falling trend line hurdle in Dow transportation index as that would suggest a correction in Dow30 index.

Dow30 - Correction never exceeded 38.2% FiboWith US stocks flirting with record highs and charts showing no negative divergence, there is very little to comment on the direction of the stock markets.
In today's post we take note of the fact that since bottoming out in 2009, the corrective rallied have not exceeded the 38.2% Fibo retracement. Let us look at the details -
2009 low - 2010 high (blue) - correction ended near 38.2% Fibo
2009 low - 2011 high (black) - correction ended at 38.2% Fibo
2011 low - 2015 high (pink) - correction ended at 38.2% Fibo
2009 low - 2015 high (green) - correction ended around 23.6% Fibo
In each of these cases, prices bottomed out at 38.2% Fibo, except in the last case where prices briefly dipped below 23.6% Fibo and quickly recovered.
Also note in the first three cases, prices rebounded from 38.2% Fibo and went on to breach the top in the first attempt itself. Only this time (last case) prices have witnessed rebounded twice from 23.6% Fibo, but failed to take out the top. This may be because the correction ended at 23.6% Fibo.
Let us see if the index manages to take out 2015 high. Traders should note that a fresh corrective rally could target 23.6% Fibo or 38.2% Fibo. Scope for rebound exists as long as 38.2% Fibo isn't breached on monthly closing basis.

Dow30 challenging channel resistanceDow's rebound from 50-DMA on Wednesday if followed by a day end closing above the channel resistance today would suggest the rally from post Brexit lows has resumed and the prices could head towards recent cyclical high of 18,167 levels.
On the other hand, failure to take out channel resistance followed by a day end closing below 50-DMA level of 17,747 would open doors for a drop to 17,538 (23.6% of Feb low-Apr high)

Dow daily outlook
Dow’s sell-off from the critical resistance of 18,000 to 50-DMA of 17,743 today suggests correction from June 27 low of 17060 has ended and the index could see sideways to bearish move today.
On the downside, doors remain open for a relook at 17,538 (23.6% of Feb low-Apr high).
On the higher side, only a daily closing above 18K would indicate a correction from 18k level has ended and the rising trend from June 27 low has resumed. The cyclical high of 17,167 stands exposed in this case.


Dow - Further gains above daily highResistance – 17,784, 17,892, 18,018
Support – 17,714, 17,652, 17,589
Dow’s recovery of today’s low of 17,657 followed by a move back above 17,714 (61.8% of 18,118-17,060) following Wednesday’s bullish closing would open doors for a rally to 17,892 (78.6% of 18,118-17,060) levels.
On the lower side, 174,714 is a good support, which if breached could see the index re-test 17,652 levels.

Dow outlook – Bullish price RSI divergence, but…
Dow’s failure to take out 17374 despite sharp rebound following a bullish price RSI divergence on the hourly chart could push the 17,267 (200-DMA) in which case the index could re-test recent low of 17,060.
On the other hand, a beak above 17,374 could signal continuation of the rebound from 17,060 and open up 17,534 levels.

Will the DJIA hit the year end target?Investing.com provides average year end forecast of 18050 for the DJIA based on the April poll of 25 analysts. How realistic is this target? The DJIA is currently trading at about 19x trailing earnings while the historical average of 15 is about 20% lower at around 14000 range. The market lows of last August and January of 15500 range was around 16.6 x trailing earnings. Analysed from a valuation perspective the DJIA seems overpriced. Technically the chart appears to be range bound with more downside than upside.
Another perspective is to consider the lower bond yields around the globe. The stock indexes could warrant a higher than average PE ratio. The earnings yield is the inverse of PE or the Earnings to Price ratio. Barrons reports DJIA earnings of $935 which gives us a current earnings yield of 5.29% and the DIA currently yields 2.48%. Both earnings and dividend yield offers a solid premium over the 10 year treasury yield which is currently around 1.61%. The DJIA is estimated to grow earnings over the next 3-5 years at an annual rate of about 7.8%
Whats your thoughts? I look forward to your comments and ideas.

Dow Jones 30 - Possible rise to 18K followed by a sell-offBreak above 17,947 (falling channel resistance + 50% Fibo retracement) would fuel a rise to point D at 17,987 (78.6% of XC), where bears are likely to come in.

Dow30-USD/JPY comparisonMajor part of the rally in US stocks since late 2012 appears to have been fuelled by Yen carry trade. Remember Bank of Japan was the first one to fire and the stage was set after Abe came to power. BOJ announced easing in April 2013 and followed it with another surprise in October 2014.
BOJ's aggressive actions also forced ECB and other central banks to press the easing button.
However, the situation now is Yen is not in mood to weaken, markets are not responding positively to aggressive central bank actions and oil has already doubled from its bottom in February. Moreover, oil helped indices recover from Feb lows even though funding currencies like JPY, EUR were on the rise.
Hence, oil better stay resilient other wise, odds of a corrective move in Dow would rise. From technical perspective a break below rising trend line (black) could bring in chart driven bears as well.

Dow outlook – Falling channel at risk of being breachedResistance – 17,758, 17,811 (Apr 1 high), 17,934 (May 10 high)
Support – 17,638, 17,539 (23.6% of Feb low-Apr high), 17,418 (May 18 low).
Daily chart pattern – Falling channel
Sharp rally seen yesterday pushed up RSI back above 50.00. Given the futures are trading 70 points higher, the index is likely to open around 17,758 (channel resistance).
Further gains towards 17,811 cannot be ruled out as risk sentiment is likely to stay intact (Greek crisis is out of the way).
However, note that Greek deal also means one less hurdle in the way of Fed rate hike. The 2-yr treasury yield is above 0.90% and could near 1% and thus weigh over equity markets.
Rejection/Failure to sustain above 17,758 (channel resistance) followed by a break below 17,638 could trigger fresh selling in the markets.

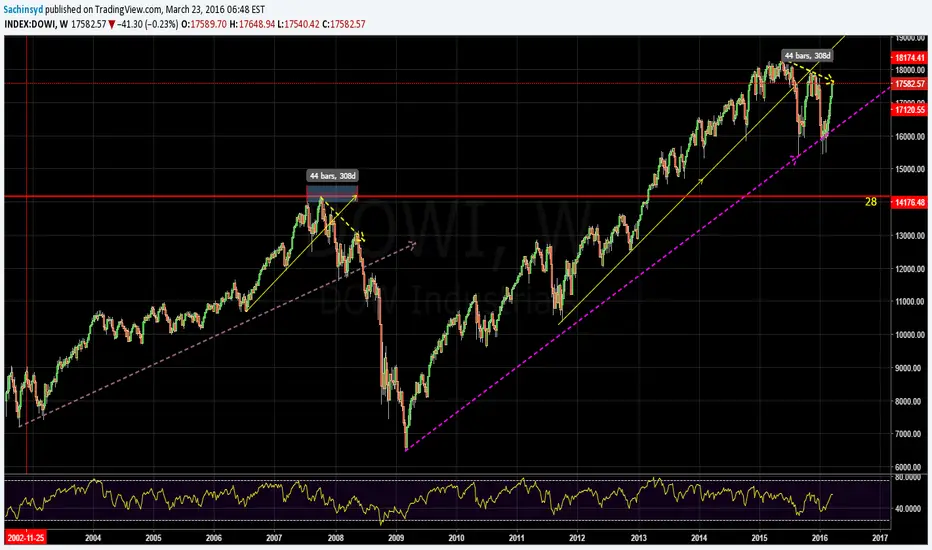
$DJIA lot is similar btwn curr price action & 2008 counter rally$DJIA lot is similar btwn curr price action & 2008 counter rally
Final rally to 2200 before the Great Crash of 2016-2017?A big bearish wedge has appeared on SPX500. Will it bounce from here up and upwards to its upper boundary at about 2200 and then crash? Or will we see a crash much sooner?
