Dow Inc.: Low in PlaceDow Inc. managed to hold and respond well within our active Target Zone(s) between $35.93 and $22.83 at the relevant Fibonacci levels. We currently assume that wave (II) in blue has been successfully completed, which leads us to anticipate a rise above the two indicated resistance levels ($55.67 and $71.86). Our zones remain active and could still be used for entering long positions. However, it should be noted that the price range could be tested further, and a completely new low is even possible under our alternative scenario: this wave count outlines a significantly stronger setback with the blue wave alt.(II), which would mean breaking through our dark green-blue Target Zones (probability: 35%).
Dowinc

DOW Inc | DOW | Long at $27.59NYSE:DOW Inc is a strong company with good fundamentals currently trading at a good value (it just may take time for the value to truly show).
P/E = 18x
Dividend Yield = 7.74%
Price/Cahs Flow = 6.9x
Debt/Equity = 0.94x
Price/Book = 1.14x
Insiders buying and awarded options
Thus, at $27.59, NYSE:DOW is in a personal buy zone.
Targets:
$34.00
$40.00
$44.00

Dow Inc.: Knock Knock…✊The price of the Dow Inc. is currently trying to overcome the resistance at 57.74. We expect that the price will succeed and continue the uptrend until the magenta wave (Y) reaches its top. In the short term, there is a 36% probability that another corrective low will be made, which will be confirmed if the support at $52.64 is lost.

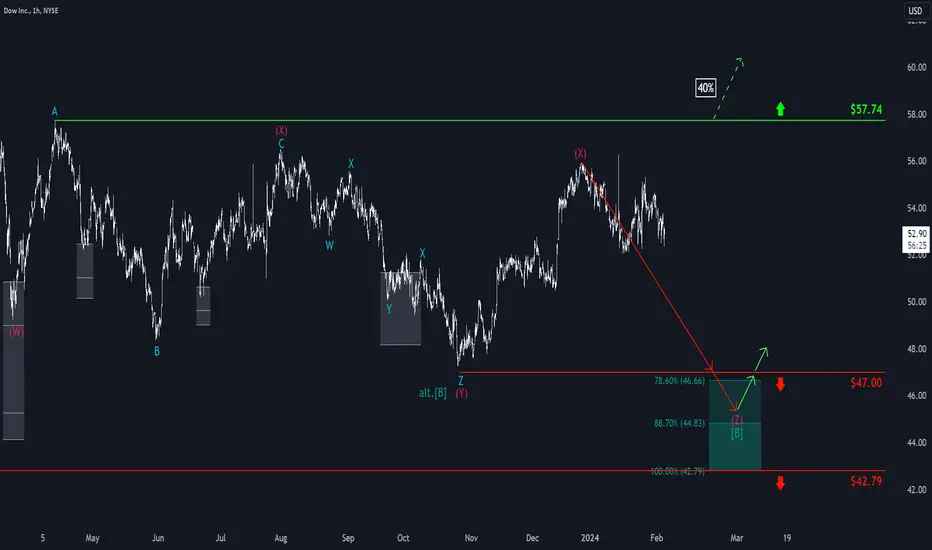
Dow: Heading South 👇We continue to locate the Dow stock in the bearish wave (Z) in magenta and expect the price to fall back to our dark green Target Zone on the south side (coordinates: $46.66 - $42.79). Traders could place a stop for long positions 1% below the lower edge of the Target Zone, or in this case 1% below the support level at $42.79. However, it should be noted that our alternative scenario has a 40% probability and would see break above the resistance level at $57.74. Wave alt. (B) in dark green would have already been completed in this scenario.
DOW - Short OpportunityA double top pattern was formed and the stock crashed and now price has retraced back to the resistance level, giving us another opportunity to ride the waves down. Near-term short signal has also appeared. Price failed to break above 200 MA, showing bearish sentiments.
Entry: 49.77
Stop Loss: 53.6
Take-Profit Target: 43.95

Dow Inc Showing Classic Wyckoff DistributionAmazing example on Dow Inc. of a Trading Range following Wyckoff Distribution Schematic #2.
------------------------------------------------------------------
What is a Trading Range?
------------------------------------------------------------------
In an trading range there is a equilibrium of Sellers & Buyers causing price to move sideways but unknown to many the large operators are slowly absorbing all the Supply or Demand of the asset before starting a major campaign.
------------------------------------------------------------------
What is Wyckoff Method?
------------------------------------------------------------------
"One objective of the Wyckoff method is to improve market timing when establishing a position in anticipation of a coming move where a favorable reward/risk ratio exists.
In accumulation, the shares purchased outnumber those sold while, in distribution, the opposite is true. The extent of accumulation or distribution determines the cause that unfolds in the subsequent move out of the TR ."
Wyckoff Theory & Schematics give us clues to which probable direction the price may head out of the horizontal moving price structure.
In a Distribution Trading Range two of the key characteristics are the UTAD (Upwards Thrust & Distribution) above the Trading Range, and the SoW's Signs Of Weakness's with strong volume at the bottom end of the range.
------------------------------------------------------------------
Further Reading
------------------------------------------------------------------
For more information check out Stockcharts.com, Wyckoff Introduction & Tutorial for beginners.
school.stockcharts.com
For Distribution Schematic #2 for comparison:
school.stockcharts.com
------------------------------------------------------------------
If you found the idea informative & insightful then share the love with a like & comment, thank you!
