DowJones INTRADAY awaits Fed Rate Decision Key Support and Resistance Levels
Resistance Level 1: 41,450
Resistance Level 2: 41,900
Resistance Level 3: 42,470
Support Level 1: 40,220
Support Level 2: 39,760
Support Level 3: 39,150
This communication is for informational purposes only and should not be viewed as any form of recommendation as to a particular course of action or as investment advice. It is not intended as an offer or solicitation for the purchase or sale of any financial instrument or as an official confirmation of any transaction. Opinions, estimates and assumptions expressed herein are made as of the date of this communication and are subject to change without notice. This communication has been prepared based upon information, including market prices, data and other information, believed to be reliable; however, Trade Nation does not warrant its completeness or accuracy. All market prices and market data contained in or attached to this communication are indicative and subject to change without notice.
Dowjones

DOW JONES Can this Channel Up hold after the Fed Rate Decision?Dow Jones (DJIA) has been trading within a Channel Up since the April 24 Low and yesterday's correction (technically its Bearish Leg) stopped on the 4H MA50 (blue trend-line). Having formed already a Golden Cross, as long as this 4H MA50 holds, it should technically fuel the pattern's new Bullish Leg.
The 'weakest' Bullish Leg within this Channel Up has been +3.58%, so we expect a minimum repeat of that, giving a Target at 42100 on the short-term. This falls perfectly at the bottom of the 5 week Resistance Zone.
If this Channel Up doesn't get invalidated after today's Fed Rate Decision, it will most likely push the price there.
-------------------------------------------------------------------------------
** Please LIKE 👍, FOLLOW ✅, SHARE 🙌 and COMMENT ✍ if you enjoy this idea! Also share your ideas and charts in the comments section below! This is best way to keep it relevant, support us, keep the content here free and allow the idea to reach as many people as possible. **
-------------------------------------------------------------------------------
💸💸💸💸💸💸
👇 👇 👇 👇 👇 👇

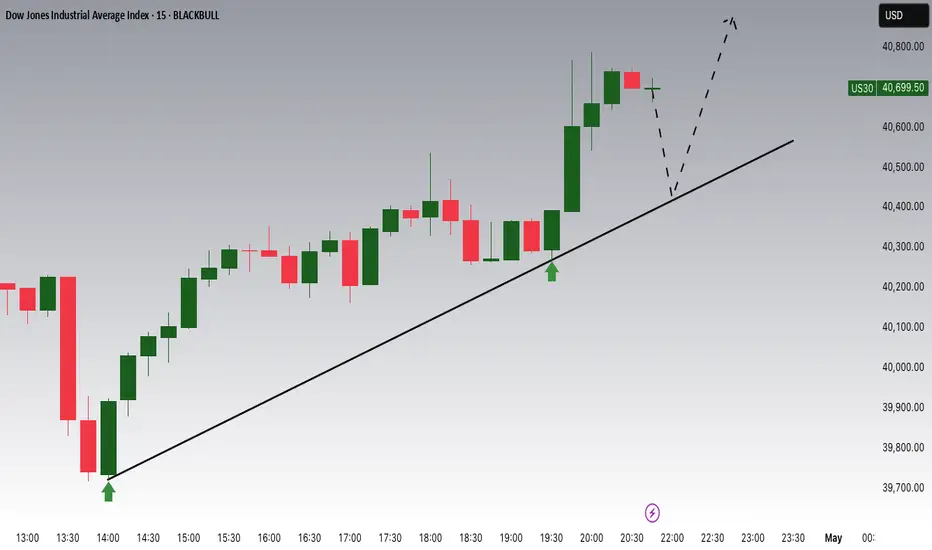
Trade Idea: Long (MARKET)Technical Confluence:
Daily Chart:
• Strong bullish engulfing recovery from recent support (~37,700).
• MACD starting to curl back up from deeply negative levels — possible trend reversal.
• RSI recovering above 50 (currently 52.49), suggesting bullish strength resuming.
15-Min Chart:
• Sustained uptrend with pullbacks respecting the moving average.
• MACD crossing positive territory.
• RSI at 64.77 with room to move higher before hitting overbought levels.
3-Min Chart:
• Tight consolidation after a sharp breakout to 40,766 — forming a potential bull flag.
• RSI at 58.89 — mid-level with upward momentum potential.
• MACD histogram shrinking — possible continuation breakout imminent.
⸻
Fundamental Context:
• Market Sentiment: U.S. markets are generally supported due to strong earnings reports and decreasing recession fears. Treasury yields have stabilized, and risk appetite is returning.
• Upcoming Events: FOMC rate decision is key — bullish bias if they hold or soften tone.
⸻
Trade Details:
• Entry: 40,770
• Price is consolidating just under this resistance. Enter on breakout with volume confirmation.
• Stop Loss (SL): 40,350
• Below recent support on the 15M chart and under the moving average. Conservative SL with volatility in mind.
• Take Profit (TP): 41,450
• Measured move from the flag pattern and aligns with Fibonacci extension and historical resistance.
FUSIONMARKETS:US30

DOW JONES - BULLISH MOVE !Hello Traders !
The Dow Jones Index failed to create a new lower low
The price broke the higher high (Break of structure).
So, I expect a bullish move🚀
_______________
TARGET: 41600🎯

DowJones INTRADAY falling resistance at 41420Key Support and Resistance Levels
Resistance Level 1: 41420
Resistance Level 2: 41900
Resistance Level 3: 42470
Support Level 1: 40240
Support Level 2: 39760
Support Level 3: 39150
This communication is for informational purposes only and should not be viewed as any form of recommendation as to a particular course of action or as investment advice. It is not intended as an offer or solicitation for the purchase or sale of any financial instrument or as an official confirmation of any transaction. Opinions, estimates and assumptions expressed herein are made as of the date of this communication and are subject to change without notice. This communication has been prepared based upon information, including market prices, data and other information, believed to be reliable; however, Trade Nation does not warrant its completeness or accuracy. All market prices and market data contained in or attached to this communication are indicative and subject to change without notice.

DOW JONES: This is why it targets 70,000Dow Jones is marginally bullish on its 1D technical outlook (RSI = 57.838, MACD = 20.320, ADX = 34.615) as the recovery since last month's low is taking a pause ahead of the Fed on Wednesday. Last month's candle closed with an incredible reversal and all this is just noise for long term investors who look at this very chart you have in front of you. The index is basically on the usual -20% correction it undergoes when it is in the middle of a multidecade Bull Cycle. If this is indeed what many call the A.I. Cycle, Dow has a minimum target of 70,000 expected somewhere in 2032.
## If you like our free content follow our profile to get more daily ideas. ##
## Comments and likes are greatly appreciated. ##

BUYS For the Markets. Wait for BUYS in Gold and Silver.In this video, we will analyze the S&P 500, NASDAQ, DOW JONES, Gold and Silver futures, for the week of May 5 - 9th.
The Indices are moving higher, and it's buys until they are not. Simple.
Gold is near potential support at 3201. This may present a great buying opportunity once the lows are swept. A weakened USD will help this cause.
Silver has made a bearish market structure shift (MSS), so buys are not yet on the table. If it disrespects a Daily -FVG, then sells are warranted. It is considerably weaker than Gold.
Enjoy!
May profits be upon you.
Leave any questions or comments in the comment section.
I appreciate any feedback from my viewers!
Like and/or subscribe if you want more accurate analysis.
Thank you so much!
Disclaimer:
I do not provide personal investment advice and I am not a qualified licensed investment advisor.
All information found here, including any ideas, opinions, views, predictions, forecasts, commentaries, suggestions, expressed or implied herein, are for informational, entertainment or educational purposes only and should not be construed as personal investment advice. While the information provided is believed to be accurate, it may include errors or inaccuracies.
I will not and cannot be held liable for any actions you take as a result of anything you read here.
Conduct your own due diligence, or consult a licensed financial advisor or broker before making any and all investment decisions. Any investments, trades, speculations, or decisions made on the basis of any information found on this channel, expressed or implied herein, are committed at your own risk, financial or otherwise.

DowJones INTRADAY NFP volatility trigger! Momentum is bullish, but today’s NFP report is a key risk event. A weaker-than-expected jobs number could reinforce rate cut bets and extend the rally. A surprise beat may trigger profit-taking.
Key Support and Resistance Levels
Resistance Level 1: 41200
Resistance Level 2: 42000
Resistance Level 3: 42710
Support Level 1: 39446
Support Level 2: 38490
Support Level 3: 37840
This communication is for informational purposes only and should not be viewed as any form of recommendation as to a particular course of action or as investment advice. It is not intended as an offer or solicitation for the purchase or sale of any financial instrument or as an official confirmation of any transaction. Opinions, estimates and assumptions expressed herein are made as of the date of this communication and are subject to change without notice. This communication has been prepared based upon information, including market prices, data and other information, believed to be reliable; however, Trade Nation does not warrant its completeness or accuracy. All market prices and market data contained in or attached to this communication are indicative and subject to change without notice.

With Dow at Resistance, it Could be Make or Break for ASX 200The Dow Jones tends to share the strongest correlation with the ASX 200, out of the three Wall Street indices. It is therefore worth noting that Dow futures formed a bearish pinbar at trend resistance on Thursday, following an intraday false break of the March low. The daily RSI (2) was also overbought by the day’s close. The March 31 low also hovers nearby for additional resistance.
Given futures volumes were declining while Dow futures rose, I suspect a pullback is due.
ASX 200 futures formed a hanging man candle beneath the January high, near a weekly VPOC (volume point of control). The 200-day SMA also hovers nearby. A bearish divergence has also formed on the daily RSI (2). And like the Dow, volumes were declining while ASX prices rose.
Bears could fade into moves around the Jan low or 2000-day SMA with an initial target at the March high, a break beneath which assumes aa deeper pullback towards the 7939 VPOC and 7900 handle.
Matt Simpson, Market Analyst at City Index and Forex.com

DOW JONES: The most critical 1D MA50 of all.Dow Jones is neutral on its 1D technical outlook (RSI = 52.914, MACD = -282.250, ADX = 30.751) but has completed 5 green 1D candles in a row, going for the all important Resistance test of the 1D MA50. This trendline has been intact since March 3rd and is on a crucial Resistance cluster as this is where the LH trendline from the ATH is. The 1D RSI is already on an Inverse H&S, which is a positive sign but we need to see a candle closing over the 1D MA50 to validate the restoration of the long term bullish trend. If succesful, we will turn long and target the ATH Resistance (TP = 45,000), which is also just under the 2.0 Fib extension.
## If you like our free content follow our profile to get more daily ideas. ##
## Comments and likes are greatly appreciated. ##

DowJones INTRADAY at pivotal zone Key Support and Resistance Levels
Resistance Level 1: 41200
Resistance Level 2: 42000
Resistance Level 3: 42710
Support Level 1: 39446
Support Level 2: 38490
Support Level 3: 37840
This communication is for informational purposes only and should not be viewed as any form of recommendation as to a particular course of action or as investment advice. It is not intended as an offer or solicitation for the purchase or sale of any financial instrument or as an official confirmation of any transaction. Opinions, estimates and assumptions expressed herein are made as of the date of this communication and are subject to change without notice. This communication has been prepared based upon information, including market prices, data and other information, believed to be reliable; however, Trade Nation does not warrant its completeness or accuracy. All market prices and market data contained in or attached to this communication are indicative and subject to change without notice.

US30 Trading Into Major Resistance - Look For Dow Jones Retrace🔍 US30 Analysis: At the moment, I'm watching the US30 as it looks overextended 📈 and is trading into previous highs. 🧱 If you look left on the chart, it's approaching a key resistance level on both the weekly and daily timeframes.
I’m expecting a potential retracement 🔁 and monitoring for a bearish break of structure on the 30-minute timeframe ⏱️ as a possible setup for a counter-trend short 📉 — aiming for the imbalance zone visible on that timeframe.
📏 Drawing a Fibonacci retracement from the recent swing low to high, the 50% equilibrium 🔄 lines up perfectly with the imbalance area, adding confluence to the idea.
📚 This is shared for educational purposes only and should not be considered financial advice 💼.

Dow Jones Potential UpsidesHey Traders, in today's trading session we are monitoring US30 for a buying opportunity around 40400 zone, Dow Jones is trading in an uptrend and currently is in a correction phase in which it is approaching the trend at 40400 support and resistance area.
Trade safe, Joe.
DOW JONES Are you willing to bet against a 15 year pattern?Dow Jones (DJI) will close the month today with a massive rebound 1M candle after almost touching its 1M MA50 (blue trend-line). Since the October 2010 break above the 1M MA50, after the market recovered from the 2008 Housing Crisis, the 1M MA50 has been the ultimate long-term Buy Entry as it has always signaled rallies that ranged from +58% to +67%.
The 1M MA50 has also kept the index mostly within the 0.382 - 0.786 Fibonacci range (blue zone) of the multi-year Channel Up. Given also that the 1W RSI also reached in April its ultimate Buy Zone (green), we view this as the best long-term Buy Signal the index handed to us since the September 2022 bottom of the Inflation Crisis.
Since the Bullish Legs that followed have been fairly consistent on average, we expect another 58% rise minimum. Assuming a 'bad-case' scenario of being contained within the 0.786 Fib, then a 56000 long-term Target seems more than fair.
Are you willing to go against this pattern?
-------------------------------------------------------------------------------
** Please LIKE 👍, FOLLOW ✅, SHARE 🙌 and COMMENT ✍ if you enjoy this idea! Also share your ideas and charts in the comments section below! This is best way to keep it relevant, support us, keep the content here free and allow the idea to reach as many people as possible. **
-------------------------------------------------------------------------------
💸💸💸💸💸💸
👇 👇 👇 👇 👇 👇

UBER Long Breakout Play | 4H ChartUber Technologies Inc. (UBER) just broke out of a long-standing descending trendline, confirming a bullish structural shift.
Entry: $79.43
SL: $70.45
TP: $86.93
R:R : 1:1.8
Technical Highlights
• Clean breakout above descending trendline and horizontal resistance at $77.35
• Retest and hold above previous resistance confirms bullish strength
• Strong bullish momentum and candle close above key levels
• Targeting the next major resistance zone near $87
Bias
Bullish continuation as long as $77.35 holds as support.
Plan
Trail stop if price sustains above $82. Look for volume confirmation on breakout retest.

The Dow Jones breaks out of a Symmetrical Triangle patternThe Dow Jones TVC:DJI is breaking out today.
RSI is looking better.
However, the buy volume is weak.
Looking at the money flow reveals this.

Trade Idea: US30 Long (BUY LIMIT)Technical Analysis Summary
Daily Chart (Macro View)
• Price has bounced off a key support near 37,700 and reclaimed the psychological level 40,000.
• MACD is starting to reverse higher from oversold conditions, showing early bullish divergence.
• RSI is recovering from below 30, now near 49, indicating a potential trend reversal.
• Trend: Medium-term recovery from a correction; possible continuation to recent highs around 44,000.
15-Minute Chart (Tactical Entry Zone)
• Price has broken a downtrend and is now consolidating above previous resistance at 40,000.
• MACD is bullish (histogram rising), and signal lines are above zero.
• RSI at 62.6, suggesting bullish momentum but not yet overbought.
• White MA shows clear upward curvature.
3-Minute Chart (Precision Entry)
• Recent pullback retested the MA and bounced.
• RSI at 66, nearing overbought, but price is in clear short-term uptrend.
• MACD just crossed bullish again after a small consolidation.
⸻
Fundamental Context
• Recent Fed signals suggest potential rate pause or cuts, which is bullish for indices.
• Earnings season has generally surprised to the upside, especially among large caps.
• Macro backdrop: Slowing inflation + strong labor market = supportive of equities.
• Risk appetite is increasing, as seen in tech and industrials rebounding.
⸻
Trade Setup
• Position: Long US30
Entry
• Buy: 40,200 (current price action confirms upward momentum)
Stop Loss (SL)
• SL: 39,700 (below recent 15-min swing low & psychological level)
Take Profit (TP)
• TP1: 41,200 (recent intraday high and near resistance)
FUSIONMARKETS:US30

Weekly Price Action: Dow Jones DJI Tuesday 4/29/2025In this video, we will be looking into the potential price action DJI.

US30 LOCAL SHORT|
✅DOW JONES is going up now
But a strong resistance level is ahead at 40,947
Thus I am expecting a pullback
And a move down towards the target of 40,314
SHORT🔥
✅Like and subscribe to never miss a new idea!✅
Disclosure: I am part of Trade Nation's Influencer program and receive a monthly fee for using their TradingView charts in my analysis.

Potential Formation of a Triangle Pattern ObservedOn the daily timeframe, the Dow Jones movement currently presents two possible scenarios.
Under the black label, there is a potential formation of a triangle pattern, suggesting that the Dow Jones may enter a prolonged consolidation phase to complete wave B, with an expected range between 38,200 and 40,400.
However, under the red label (alternative scenario), a bearish triangle could be forming as part of wave X.

US30 - Signs Point to Deeper Correction AheadBased on the chart of the Dow Jones Industrial Average, there appears to be a significant probability of a deeper correction from the current resistance levels. The index has formed what looks like a double top pattern near the 40,400 level, with notable resistance zones highlighted in blue on the chart. After recovering from the early April selloff that took the index down to around 36,600, the Dow has been unable to reclaim previous highs, instead facing rejection at these resistance levels. This price behavior, combined with the technical setup shown on the chart, indicates that we could see a more substantial pullback in the coming sessions if these resistance levels continue to hold.
Disclosure: I am part of Trade Nation's Influencer program and receive a monthly fee for using their TradingView charts in my analysis.

Market Digesting Trade War Fears — But Risks RemainSimilar to the early stage of Trump's previous administration, escalating trade tensions and tariff threats have once again rattled market sentiment, triggering a broad-based correction in equity indices down to key support levels.
Over the past two weeks, extreme trade war rhetoric shocked the market, causing the index to break below the 40,000-point support, reaching a low of 36,439 — near the 200-day moving average on the weekly chart. As this level coincides with a significant technical support zone, buying interest emerged, prompting a rebound back above the 40,000 mark.
This suggests that the market has begun to digest the trade war narrative, with investors gradually positioning in tranches around the 40,000 level. However, ongoing uncertainty surrounding trade policies may continue to weigh on sentiment. Should the index revisit 36,439 and fail to hold, further downside toward the next major support at 34,969 could be expected.

Navigating Trump Tariffs on the Dow JonesNavigating the movements of the **US30 (Dow Jones Industrial Average)** can be challenging, especially amid shifting economic policies. The Dow, which tracks 30 major U.S. companies, is highly sensitive to trade policies, corporate earnings, and geopolitical risks. Trump’s plan to impose **10% across-the-board tariffs** and **60%+ tariffs on Chinese goods** has sparked concerns about inflation, supply chain disruptions, and retaliatory trade measures. Investors are closely watching how these policies could impact multinational companies within the index, particularly those reliant on global trade, such as **Boeing, Apple, and Caterpillar**.
For everyday Americans, higher tariffs could mean **rising prices on imported goods**, from electronics to household items, worsening inflation. While tariffs aim to protect domestic industries, they often lead to **higher production costs** for businesses that rely on foreign materials, potentially triggering job cuts or reduced consumer spending. The stock market’s reaction—volatility in the US30—reflects these uncertainties, as investors weigh the risks of slower growth against potential benefits for U.S. manufacturers.
Traders navigating the US30 must monitor **Fed policy, corporate earnings, and trade war developments**. If tariffs escalate, defensive stocks (utilities, healthcare) may outperform, while industrials and tech could face pressure. Long-term investors might see dips as buying opportunities, but short-term traders should prepare for turbulence. Ultimately, Trump’s tariff policies could reshape market dynamics, making adaptability key for those trading the Dow.
