WALMART: Bearish: Overbought alert: Impact on Dow JonesWALMART: Bearish: Overbought alert: Impact on Dow Jones
Be careful with Walmart as you can see cocoa and st microelectronic also rose to very very high historical levels and look at the correction that we had immediately after at least 40% drop
This action can have a significant impact on the Dow Jones
A strong correction could lower the DJIA index
I alert you on this I alert you especially on the notion of "stock market cycle" and "seasonality"
Walmart is overbought you just have to look at your technical indicators RSI, ROC, Stochastic, exponential moving average, Ichimoku, Fibonacci retracement.
We could go much much lower so be careful this action is overbought
Monitor your above-mentioned indicators.
Dowjones

“Yen carry trade crash”Can’t help but see a head and shoulders bearish scenario for the week of August 12-16
This last week was the typical bull trap rally at the base of the textbook head and shoulders with low volume
Do what you want I’m shorting the indexes

DOW JONES correction to extend until the Fed.Dow Jones (DJI) did what we expected of it 3 weeks ago (August 13, see chart below) and after pricing a Higher Low at the bottom of the 5-month Channel Up, it rebounded and reached the All Time High (ATH), pricing a Higher High:
In continuation of that analysis, we now expect the new Bearish Leg to extend to possibly as low as the 0.618 Fibonacci retracement level, which was the case with the May 30 pull-back.
The 1D RSI suggests that a 35.00 value would be ideal to signal a buy (same as May 30, see how both RSI fractals priced the top on the 70.00 overbought limit), while a Bullish Cross on the 1D MACD would be the final confirmation of the buy.
Our long-term Target remains 42400 (+11.00% from the Higher Low, the same % rise as the July 18 High).
-------------------------------------------------------------------------------
** Please LIKE 👍, FOLLOW ✅, SHARE 🙌 and COMMENT ✍ if you enjoy this idea! Also share your ideas and charts in the comments section below! This is best way to keep it relevant, support us, keep the content here free and allow the idea to reach as many people as possible. **
-------------------------------------------------------------------------------
💸💸💸💸💸💸
👇 👇 👇 👇 👇 👇

OHLC Statistical Mapping + Average Range Levels-Manipulation from OHLC Statistical Mapping was my entry
SL was above 1/3AWR- and I targeted AWR-
Simple model

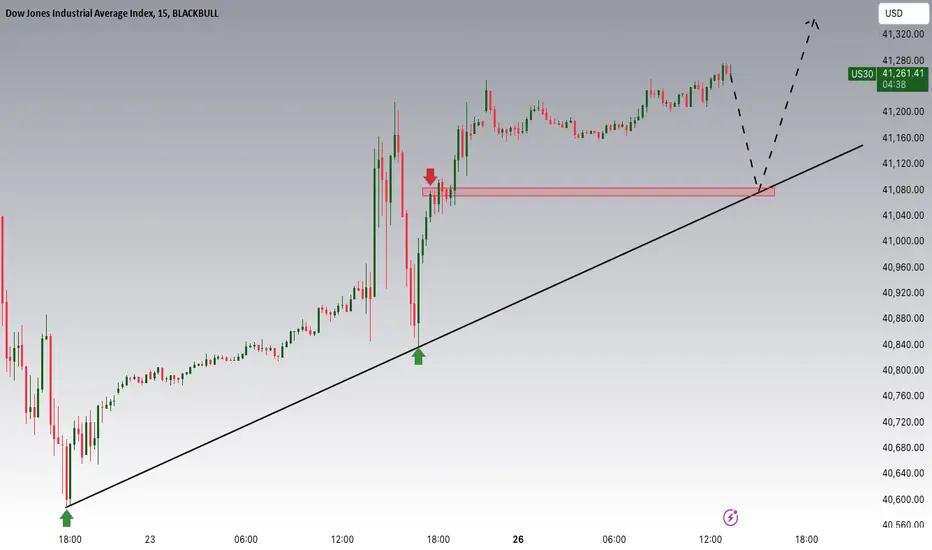
US30 , Today 09/05/2024 Strategy - Sell Or Buy ?!Strategy Overview:
In this chart of the US30 (Dow Jones Industrial Average Index), the price action is forming a rising channel within the 15-minute timeframe. The trendlines highlighted suggest potential buy and sell zones based on the interactions with these lines.
Key Elements:
Trendline Structure:
Buy Side: The lower trendline is acting as dynamic support. Each time the price touches this line, there's a buying opportunity, which has resulted in several bullish movements in the past.
Sell Side: The upper trendline represents resistance. When the price approaches this area, it faces selling pressure.
Trading Strategy:
Buying Strategy: A buy trade can be initiated if the price retraces back to the Buy Side trendline (around 40,937), with a stop loss placed just below this support line. The target would be a movement toward the upper Sell Side trendline (near 41,043).
Selling Strategy: A sell trade can be considered when the price reaches or slightly breaks through the Sell Side trendline. A stop loss can be placed above this level, with a target back down towards the Buy Side.
Confirmation with RSI:
The RSI indicator shows both overbought and oversold conditions frequently, which complements the trendline strategy. Currently, RSI is around neutral, meaning there’s potential for either direction depending on where the price moves next within the channel.
Conclusion:
This strategy uses both support and resistance levels created by the rising channel to define entry and exit points for buy and sell positions. The interaction of the price with these trendlines, along with RSI confirmation, provides a clear framework for making trading decisions in this timeframe.

Combined US Indexes - Warning Trend Change to DOWNFrom the last post, there was a Gap closure and breakout... well, almost. What happened was a stall after the gap closure. This is the first indication that something is not right and a strong resistance is in the way.
After more than a week, a decisive down candle wiped out two prior days of bullish candles, and reopened the earlier gap. This by itself is very bearish... first on the candlestick pattern, and next on the reopening of the gap.
MACD have crossed under the signal line, in support of the bearish undertone.
Now, we wait for a full reopening of the gap, meaning a further breakdown of the supports.
By simple projection, the down wave from mid July to August (blue arrow) is projected from the last lower high in mid-August.
This brings the target to mid-September, at an old critical support level of 780.
Oddly enough, am expecting this to happen by the end of next week.

S&P500 INDEX (US500): Important Bearish Signal
US500 was consolidating for quite a long period of time around
the level of a current all-time high and formed a range.
After the release of the yesterday's US fundamentals, the Index dropped
and formed a high momentum bearish candle.
A daily candle closed below a support of the range, confirming its violation.
We can expect a bearish continuation lower now.
Next support - 5432
❤️Please, support my work with like, thank you!❤️

Fractal Consolidations ShortThis short position was based on -RDRB PD ARRAY from ICT, and my SL was above multiple HRLR and I simply targeted LRLR :-)

INTEL SHORT TRADE : 22% Gain - All Profits Done and Dusted!INTEL SHORT TRADE
Short entry at: 34.74
Stoploss: 35.95
Profit targets:
TP1: 33.24
TP2: 30.81
TP3: 28.39
TP4: 26.89
All targets done - INTEL!
Please follow for more analysis, tips and trade setups.

The W1DOW maker is looming. BEAR MARKET watch.
Look at that August Monthly hammer candle after the Yen carry trade wobble.
The Global Dow jones index is at an all time new high
This rise is BASED on a wall of #FIAT capital that has been clicked and borrowed into existence.
And speculation of an AI revolution
But Money creation is not wealth creation.
An general AI will be deflationary, as more decisions outsourced from Humans to the "mainframe" :0
Most of my idea's I have shared on assets have been to the upside even after bearish down moves. Stocks, Gold & Crypto. Right Back in 2020 I shared a thesis of a Roaring 20's echo meltup and here we are melting up ...
Yet the party must end sometime
so we watch and have one foot in and foot out from this point.
Secular Bull markets have a lifespan of 15-18 years ...
and this one has required multiple rounds of QE (liquidity injections) to achieve this run.
So we will are looking for #BTC hit $100k the Russell 2000 to make new high's, before setting the stage for a bear market that could be quite extraordinary.

$DJI <> Rate CutsRetail investors often mistakenly believe rate cuts are bullish and will profit, but history suggests otherwise. In the last two decades, we have witnessed three major rate-cutting events that occurred a few months before market peaks, each followed by 40%+ corrections. We have observed similar patterns with retail investors becoming bullish as rate cuts are announced. Markets typically become euphoric for a few months, with retail investors buying at the top, only to experience major drops shortly after.

Dow Jones Potential UpsidesHey Traders, in the coming week we are monitoring US30 for a buying opportunity around 41000 zone, US30 is trading in an uptrend and currently is in a correction phase in which it is approaching the trend at 41000 support and resistance area.
Trade safe, Joe.

Average Range Levels Short SetupEntry: AMR+ & 1/3+
target: 1/3 ADR-
Nearly same setup as yesterday ;)

Average Range Levels Short Setup5ADR & 1/3AWR+ was my reversal level! Price beautifuly reacted there and I simply targeted 1/3ADR+ :)

Dow Jones
# Dow Jones - H1
📣 By analyzing the 1-hour timeframe, with the breakout of the resistance level around 41,124, you can consider buying with a target of 41,500.
⛔️ Stop Loss: 40,800
On the other hand, with the breakout of the 40,800 level, a decline in the index towards 40,400 is expected.
⛔️ Stop Loss: 41,124

Why a Cautious Bull on the US Markets?This is a classic bull market—smooth and trendy. However, it has become a cautious bull, moving within a much wider range, similar to what we observed after March.
Especially in July and August: For the Nasdaq, it was down by 17%, but it has since recovered within a two-month period.
Is this good or bad? It really depends on how we've positioned ourselves. If you're an investor, seeing your July positions slump so much only to recover so quickly could be quite unsettling—it might even give you a heart attack. But if you're a trader, you should find this volatility interesting and take advantage of it.
Micro E-Mini Dow Jones Futures & Options
Ticker: MYM
Minimum fluctuation:
Outright: 1.0 index points = $0.50
Disclaimer:
• What presented here is not a recommendation, please consult your licensed broker.
• Our mission is to create lateral thinking skills for every investor and trader, knowing when to take a calculated risk with market uncertainty and a bolder risk when opportunity arises.
CME Real-time Market Data help identify trading set-ups in real-time and express my market views. If you have futures in your trading portfolio, you can check out on CME Group data plans available that suit your trading needs www.tradingview.com

US30 Daily/4hr/1hrBefore:
Pre Analysis: Looking for price to respect 41,230 to take long position. In this area we've had multiple rejections which formed a beautiful 1hr support. On the 1hr we can see a possible liquidity grab around 41,180 where on a higher timeframe (Weekly + Daily structure) we have respected putting in HL.
After:
41,230 Area respected again putting in bullish momentum.

NASDAQ INDEX (US100): Pullback From Support
US100 may pull back from a key daily/intraday horizontal support.
As a confirmation, I spotted a double bottom formation on a 4H time frame
and a confirmed violation of its neckline.
The market may reach at least, 19755 level soon.
❤️Please, support my work with like, thank you!❤️

US30 / DJ30 / DJI Market Money Heist Plan on Bullish SideMy Dear Robbers / Money Makers & Newbies,
This is our master plan to Heist US30 / DJ30 / DJI Market based on Thief Trading style Technical Analysis.. kindly please follow the plan I have mentioned in the chart focus on Long entry. Our target is Red Zone that is High risk Dangerous level, market is overbought / Consolidation / Trend Reversal at the level Bearish Robbers / Traders gain the strength. Be safe and be careful and Be rich.
Note: If you've got a lot of money you can get out right away otherwise you can join with a swing trade robbers and continue the heist plan, Use Trailing SL to protect our money.
Entry : Can be taken Anywhere, What I suggest you to Place Buy Limit Orders in 15mins Timeframe Recent / Nearest Swing Low
Stop Loss : Recent Swing Low using 2h timeframe
Warning : Fundamental Analysis comes against our robbery plan. our plan will be ruined smash the Stop Loss. Don't Enter the market at the news update.
Loot and escape on the target 🎯 Swing Traders Plz Book the partial sum of money and wait for next breakout of dynamic level / Order block, Once it is cleared we can continue our heist plan to next new target.
Support our Robbery plan we can easily make money & take money 💰💵 Follow, Like & Share with your friends and Lovers. Make our Robbery Team Very Strong Join Ur hands with US. Loot Everything in this market everyday make money easily with Thief Trading Style.

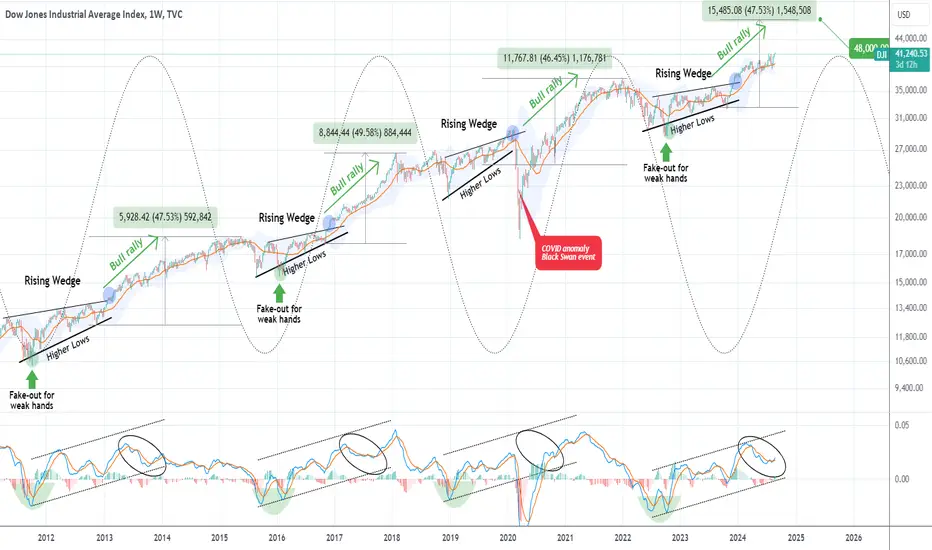
DOW JONES The pattern that never failed is now targeting 48000Dow Jones (DJI) gave us the best bullish break-out signal of the year 8 months ago (December 13 2023, see chart below), as our buy entry at 36577 is very close to hitting our 42900 Target:
At that time we made a clear point why that rally 'shouldn't surprise you' and now you see why. This 1W time-frame chart shows the cyclical behavior of the index, which peaks (Sine Wave top) then pulls back and starts forming a Rising Wedge (Sine Wave bottom) and when it breaks above the Rising Wedge, is where it flashed the bullish break-out signal we got back in December.
As you can see it then starts a gradual rise on the BB20 and completes the Cycle again (Sine Wave top) after roughly a +47% rally. The title mentions that this pattern 'never failed', in practice it only broke during the COVID flash crash, which is a non-technical event than occurs once every 100 years. As you can see even the 1W MACD sequences between the cyclical patterns are identical.
As a result, our Target towards the Sine Wave peak is 48000.
-------------------------------------------------------------------------------
** Please LIKE 👍, FOLLOW ✅, SHARE 🙌 and COMMENT ✍ if you enjoy this idea! Also share your ideas and charts in the comments section below! This is best way to keep it relevant, support us, keep the content here free and allow the idea to reach as many people as possible. **
-------------------------------------------------------------------------------
💸💸💸💸💸💸
👇 👇 👇 👇 👇 👇
Why the 'record high' on Dow Jones underwhelms...Another day, another record high for a US stock market. Only the one seen on the Dow Jones underwhelms given it is not backed up by its own futures market, let alone its peers. We're also approaching end-of-month flows (which can prompt fickle price action). And keep an eye on the Nvidia earnings report on Wednesday (US) which can single-handedly drive sentiment on Wall Street.

Dow Jones Potential UpsidesHey Traders, in today's trading session we are monitoring US30 for a buying opportunity around 41000 zone, Dow Jones is trading in an uptrend and currently is in a correction phase in which it is approaching the trend at 41000 support and resistance area.
Trade safe, Joe.
XAU/USD : Key Levels and Trading Strategies to WatchBy reviewing the #Gold chart on the 2-hour timeframe, we can see that today the price climbed to higher levels, reaching the $2525 range. Currently, there has been an initial reaction to this supply zone. The price is close to its historical high of $2531, and we need to see if it will stabilize below $2520 or above $2527 in the next 4 hours. Day traders will need more confirmation before taking a SELL position, while scalpers can look for suitable SELL triggers within the $2527 to $2532 range, managing risk carefully and taking quick profits. My medium-term outlook on gold remains bullish, and I expect to see the price reaching $2550 and $2600 soon.
Please support me with your likes and comments to motivate me to share more analysis with you and share your opinion about the possible trend of this chart with me !
Best Regards , Arman Shaban
((2+4+7+13+15+18+26+36+38+69+87+101+183+209+1000+1002+1000000000+1000000001+ 1000000853)^♾️*69) + 1 !
