Dow Jones to be bullish next 2 daysDJ is expected to be bullish today and test the order block on D1 at 50%Fib level. The expected move is demonstrated in the chart.
The last D1 candle was a bullish engulfing candle which finished the two day consolidation and now the price is expected to target an order block on D1 which is expected to be a strong one as it is coming off from a previous order block. Next two days is expected to be bullish on DJ and we will see some bearish move on coming Friday.
Good luck and use proper risk reward
This idea is for educational purpose only and not a financial advise .
Dowjones

Hellena | DJI (4H): Long to resistance area 40071.Dear Colleagues, in the last forecast the price almost reached the target 41680, but sharply started to decline. This means that the price is in a complex correction (WXY).
I expect that the price has almost finished the downward movement in wave (Y), and will start an upward movement soon.
The level where the price may come to is 38799, but in general I expect an upward movement at least to the area of 40071.
Manage your capital correctly and competently! Only enter trades based on reliable patterns!

DOW JONES New Bullish Leg to beginLast week (August 07, see chart below) we made a long-term case of why Dow Jones (DJI) is poised to technically start a new aggressive rally 'right under our nose' and before that (July 25, see chart below), why at the time the correction wasn't over:
As you can see, the index found support on our low tier near the 1D MA200 (orange trend-line) and as the April 19 Low, it touched the 0.5 Fibonacci retracement level of the 2-year Channel Up (chart 2 above).
Back to today's analysis, the price has already rebounded at the bottom of April's Channel Up and has found its first Resistance on the 1D MA50 (blue trend-line). The final confirmation of this Bullish Leg will be when the 1D MACD forms a Bullish Cross as it did on June 18 and April 25.
Since the Bearish Legs of this Channel Up have been almost the same percentage wise (-6.84%) we expect the Bullish Legs to be too. With the first Bullish Leg being at +11.13%, our medium-term Target is 42400 (just below a potential +11.13% rise).
-------------------------------------------------------------------------------
** Please LIKE 👍, FOLLOW ✅, SHARE 🙌 and COMMENT ✍ if you enjoy this idea! Also share your ideas and charts in the comments section below! This is best way to keep it relevant, support us, keep the content here free and allow the idea to reach as many people as possible. **
-------------------------------------------------------------------------------
💸💸💸💸💸💸
👇 👇 👇 👇 👇 👇

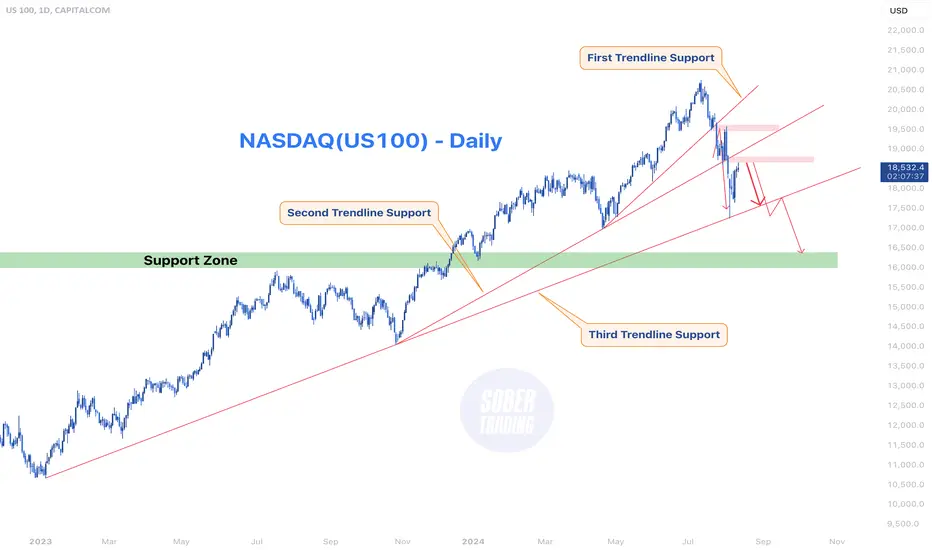
NASDAQ - US100 Facing Bearish PressureThe CAPITALCOM:US100 index is currently facing significant downward pressure, largely due to mounting concerns about the U.S. economy. The potential for a recession is growing as recent data points to an increase in unemployment claims, and the Federal Reserve has decided to delay interest rate cuts. This has created uncertainty in the markets, as higher unemployment could lead to reduced consumer spending, further exacerbating the economic slowdown. The anticipation of prolonged higher interest rates is also weighing on investor sentiment, making the stock market, particularly tech-heavy indexes like NASDAQ, more vulnerable to declines.
Technically, the BLACKBULL:NAS100 index has been following a clear pattern of reactions to its trendlines. The index recently fell and touched the third trendline support, which has historically been a critical level for determining market direction. After this touch, the index attempted a recovery, moving back towards the second trendline, which now acts as a breakeven point. However, the failure to break through this level and the subsequent rejection suggests that the bears are firmly in control. The pattern indicates that the index may face further declines, particularly if it breaches the third trendline support.
In conclusion, both fundamental and technical factors are pointing towards a bearish outlook for the NASDAQ index. The rising possibility of a recession, driven by increasing unemployment claims and the Fed’s cautious approach to rate cuts, has dampened investor sentiment. On the technical side, the index’s inability to reclaim key trendline supports indicates that more downside is likely. As a result, investors should be cautious and prepared for potential further declines in the NASDAQ index in the coming weeks.
$Us30 [$DOW Jones] Possibilities The consolidation between 38,500 and 39,60 following the impulsive drop through 39,812 on the 2nd of Aug indicates a major shift in the direction of the US indices. How price reacts to 39,900 or 39,700 will tell if we could see a continuous increase in bearishness

$Us30 [$DOW Jones] Possibilities The consolidation between 38,500 and 39,60 following the impulsive drop through 39,812 on the 2nd of Aug indicates a major shift in the direction of the US indices. How price reacts to 39,900 or 39,700 will tell if we could see a continuous increase in bearishness

Dow Jones Index (US30): Detailed Support and Resistance Analysis
Here is my latest structure analysis
and important key support and resistance levels to pay close attention to.
Vertical Structures
Vertical Resistance 1: Rising trend line
Horizontal Structures
Support 1: 38250 - 38550 area
Support 2: 38015 - 38105 area
Resistance 1: 39500 - 39700 area
Resistance 2: 39800 - 39960 area
Resistance 3: 40900 - 41415 area
Consider these structures for pullback/breakout trading.
❤️Please, support my work with like, thank you!❤️

US30 Buys !!!!US30 Buys
**Trade Idea:**
- **Instrument:** Dow Jones Industrial Average (DJIA) Index
- **Timeframe:** 1 Hour
**Setup:**
- The price is currently bouncing off the 0.618 Fibonacci retracement level, which suggests a potential continuation of the bullish trend.
- The 200 EMA (black line) is serving as dynamic support, reinforcing the bullish momentum.
- The formation of higher lows and the breakout above the 50 EMA (red line) further confirms the strength of the uptrend.
**Trade Entry:**
- **Buy Entry:** Enter a long position at the current price level around 39,640, after confirming a strong bullish candle above the 50 EMA.
**Targets:**
- **Primary Target (TP1):** The first target is set near the 0.786 Fibonacci retracement level around 40,520, aligning with a significant resistance area.
- **Secondary Target (TP2):** The ultimate target is near the previous high at around 41,415.
**Stop Loss:**
- **Stop Loss (SL):** Set the stop loss just below the 0.5 Fibonacci level, around 39,207, which coincides with recent lows and provides a good risk-reward ratio.
**Risk Management:**
- Ensure that the risk-reward ratio is favorable, ideally at least 1:2.
- Adjust the position size to maintain proper risk management based on your trading plan.
**Additional Notes:**
- Monitor the price action closely as it approaches the 40,520 level. If the price shows signs of rejection, consider securing partial profits or adjusting the stop loss to breakeven.
- Be aware of any macroeconomic events or news releases that could impact market sentiment.
---
This trade idea is based on technical analysis and should be executed with caution, considering all potential risks involved.

DJI Weekly Rising Narrowing WedgeDow Jones Industrial Average has not shown many signs of slowing in its growth.
Here is a bearish biased shape playing out on the weekly chart in the form of a rising narrowing wedge.
Strictly PA, strictly structure. Keep an eye on this.
Looking for a Macro correction to reach to the .236 or the .382 on a corrective movement.
This is a follow up to a macro long idea on the DJI posted back in March 25th 2023.
NFA
Do your own DD
Like Comment and Share!

Dowjones Breakout and Potential RetraceHey Traders, in today's trading session we are monitoring US30 for a buying opportunity around 38900 zone, US30 was trading in a downtrend and currently is in a correction phase in which it is approaching the retrace area at 38900 support and resistance zone.
Trade safe, Joe.

Dow Jones Index (#US30): Your Trading Plan Explained
Dow Jones is currently stuck on a key daily/intraday horizontal resistance.
The price is trading within a narrow range on that on a 4H time frame.
Your confirmation to sell the Index will be a bearish breakout of the support of the range.
A 4H candle close below 39325 will confirm the violation.
A bearish continuation will be expected to 38890 then.
Alternatively, a bullish breakout of the underlined blue resistance
will push the market higher.
❤️Please, support my work with like, thank you!❤️

Elliott Wave Intraday Analysis: YM_F should Resume the RallyShort Term Elliott Wave View in E-Mini Dow Jones Futures (YM_F) suggests the trend should continue higher within the sequence started from April-2023 low as the part of daily sequence. It favors upside in wave ((5)) while dips remain above 38535 low. Since April-2024 high of (3), it starts to move sideways for almost 3 months to build a triangle structure. This triangle completed wave (4) at 39284 low. The market resumed the rally building an impulse as wave (5) ended at 41672 high and also wave ((3)) in higher degree.
YM_F begins a big correction in July 18 high. Down from wave ((3)), the index did an impulse structure to complete a wave (A) at 40053 low. Then, the market did a bounce developing a double correction as wave (B). Up from wave (A), wave W ended at 41051 high. The connector (X) ended at 40606 low and last push higher completed wave (Y) at 41427 and also wave (B). The market resumed to the downside forming another impulse as wave (C) of ((4)). It placed 1 of (C) at 41028 low, 2 at 41305 high, 3 at 39518 low, 4 at 39880 high and finally 5 at 38541 to complete wave (C) and wave ((4)). While price action stays above 38541 low, we are calling for more upside to continue the rally as wave ((5)).

Dow Jones Surges on Surprising Jobs Data, Rebounding from LossesThe Dow Jones Industrial Average staged an impressive rally on Thursday, soaring more than 650 points as positive economic data injected fresh optimism into the markets. The blue-chip index reclaimed its 50-day moving average, providing a much-needed boost after a week of significant losses.
Jobs Data Sparks Market Rally
The unexpected drop in initial jobless claims, which fell to 233,000 for the week ended August 3rd, well below the anticipated 240,000, fueled the market's surge. This sharp decline in unemployment claims eased concerns of a looming recession, pushing investors to return to the market with renewed confidence. The strong jobs report was particularly encouraging given the previous week's claims hit a one-year high of 250,000, stoking fears of economic slowdown.
As a result, the Dow Jones jumped 2.24% in late trading, with key gainers including Intel ( NASDAQ:INTC ) and Salesforce ( NYSE:CRM ), which saw gains of over 6% and 3%, respectively. The S&P 500 followed suit, surging 2.3%—its best day of the year—while the Nasdaq Composite rebounded 2.8%, finding support well above its 200-day moving average.
Earnings Hits and Misses
While the broader market celebrated the positive economic news, not all stocks were so fortunate. McKesson (MCK) and Monster Beverage (MNST) were the worst performers in the S&P 500, both diving on disappointing earnings reports. Conversely, Parker Hannifin (PH) and Eli Lilly (LLY) led the S&P gainers, posting strong results that sent their shares higher. Over in the Nasdaq, semiconductor stocks such as Arm Holdings (ARM) and On Semiconductor (ON) led the charge, contributing to the index's impressive rally.
Volume and Market Sentiment
Despite the bullish price action, trading volume was lower on both the New York Stock Exchange and Nasdaq compared to Wednesday's session. However, market breadth was decidedly positive, with advancers outpacing decliners by nearly 4-to-1 on the NYSE and slightly less than 3-to-1 on the Nasdaq.
The DOW Jones stock index displays a long-term rising wedge pattern subsequent to an extensive consolidation phase. The support point at December 2023 now serves as a pivot, with any movement below it indicating a bearish reversal pattern. Despite prevailing market conditions, the DOW Jones stock index has exhibited substantial growth.
Investor sentiment, as reported by Investors Intelligence, reflected the market's mixed emotions. The ratio of bullish advisors dropped to 46.9% from 59.4% over the past two weeks, while bearish sentiment increased to 18.7% from 15.6%. The report highlighted concerns about elevated market risk and limited cash on the sidelines to fuel further gains.
Treasury Yields and Oil Prices
In bond markets, the yield on the benchmark 10-year Treasury note rose by four basis points to 4%, reflecting the market's cautious optimism following the jobs report. Meanwhile, oil prices also ticked higher, with West Texas Intermediate futures trading around $75.30 a barrel, indicating ongoing strength in the energy sector.
Looking Ahead
As the Dow Jones and other major indexes continue to recover from recent losses, investors will be closely watching upcoming economic data and earnings reports for further signs of market direction. The surprising strength in the labor market has provided a temporary reprieve from recession fears, but with inflation concerns and interest rate hikes still looming, the road ahead may be bumpy.
For now, however, Thursday's rally offers a glimmer of hope that the worst may be behind us, as Wall Street looks to build on this momentum in the days ahead.

Dow Jones Faces Strong Resistance: Bearish Reversal in Play?The chart highlights a gray resistance zone at the top, indicating an area where the price has struggled to break through. This zone represents a strong supply area where sellers are entering the market.
The purple horizontal lines represent key support levels at approximately 39,200, 39,000, and 38,800. These levels are critical points where the price may find buyers or continue its bearish momentum.
The price recently approached the upper resistance zone but failed to break above it.
The candlesticks show a series of wicks near the resistance, indicating rejection and the presence of sellers.
The price is expected to move lower after testing and failing to break through the resistance zone.

Dow Jones (US30) Outlook ICT ConceptsDow Jones Industrial Average (US30) Analysis
💰 Welcome to Your Channel!
Welcome to our channel where we delve into the intricacies of financial markets. Today, we focus on US30, dissecting its current price action to uncover strategic trading opportunities. Join us as we analyze key levels and market dynamics, aiming to refine our trading strategies and maximize potential gains.
💡 Previous Analysis Review:
In the previous analysis, we expected the price to expand lower after the Market Structure Shift (MSS), which occurred as anticipated.
📍 Current Market Overview:
The current price is around 38,643.10. The Dow Jones Industrial Average (US30) has swept both the Previous Month Low (PML) and Previous Week Low (PWL), which are significant liquidity levels. The price is currently within a 4H Fair Value Gap (FVG), marked by a line on the chart.
🔍 Identifying Key Levels:
• PMH: Previous Month High
• PWH: Previous Week High
• PWL: Previous Week Low
• PML: Previous Month Low
• BSL: Buy-Side Liquidity
• SSL: Sell-Side Liquidity
• 4H FVG: 4-Hour Fair Value Gap
• MSS: Market Structure Shift
📊 Key Considerations:
• Swept PML & PWL: The price has swept the Previous Month Low and Previous Week Low, indicating the potential for a reversal or at least a short-term expansion higher.
• Inside 4H FVG: The price is within the 4H FVG, which could serve as a support zone for a possible expansion higher.
• Reaction to Bearish FVGs: The key to the next movement lies in how the price reacts to the two bearish FVGs above.
📈 Bullish Scenario:
Given the current price action and key considerations, a bullish scenario is possible if the following conditions are met:
• Support from 4H FVG: The 4H FVG provides support, and the price begins to expand higher.
• Reaction to Bearish FVGs: Watch the reaction to the bearish FVGs above; if the price can break through these, it would confirm the bullish bias.
📉 Bearish Scenario:
A bearish scenario should be considered if the following conditions are met:
• Sweep of Lower Time Frame BSL: On lower time frames, we need to see buy-side liquidity levels swept before considering short positions.
• Target Lower Objectives: After the sweep of lower time frame BSL, the price could target lower objectives such as the SSL (Sell-Side Liquidity) marked below on the chart.
📊 Chart Analysis Summary:
• Bullish Expectation: The price is in a key area after sweeping PML and PWL, and being inside the 4H FVG. We can expect a possible expansion higher from here, especially if the price holds within the 4H FVG and breaks through the bearish FVGs above.
• Bearish Expectation: For a bearish scenario, wait for lower time frame buy-side liquidity to be swept, followed by a reversal to target lower levels like the SSL below.
Conclusion:
The Dow Jones Industrial Average is at a critical juncture after sweeping key liquidity levels and entering a 4H FVG. The next move depends largely on the reaction to the bearish FVGs above. A bullish scenario would see an expansion higher if the 4H FVG holds and the price breaks through the bearish FVGs. A bearish scenario would require a sweep of lower time frame BSL and then a move lower to target SSL and other lower objectives.
🙏 Thank you for joining us!
Exploring US30 today highlighted the importance of effective risk management in trading success. Prioritize research, implement robust strategies, and seek guidance for confident market navigation. Stay tuned for more insights on our channel. Here's to profitable trading and continuous learning!
⚠️ Disclaimer
The information provided here is for educational purposes only and should not be taken as financial advice. Always conduct your own research and consult a licensed financial advisor before making any investment decisions.

US30 - 4H DowJones is in a pullbackThe Dow Jones Industrial Average (DJIA) is currently facing significant bearish pressure, as indicated by recent market trends and technical analysis. The support trend line has broken, leading to a notable drop in the index. This break, coupled with a clear pullback, presents an opportune moment for traders to consider short positions with a logical stop loss.
From a fundamental perspective, the rising rate of unemployment and the postponement of interest rate cuts are increasing the chances of a recession. These economic indicators suggest that the market could experience further declines as investors react to the potential economic downturn.

DOW JONES Is a new rally starting right under our nose again?Consistent with our macro approach to investing (particularly with stocks), we continue to address the recent stock market correction by examining similar behavioural patterns of the past.
It was 10 months ago (October 11 2023, see chart below), when Dow Jones (DJI) was under another short-term turmoil phase that turned out to be exactly that, short-term:
As you can see on that chart, while most were panic selling, we addressed the idea that Dow was "starting a new Bull rally under our nose". And as you can see, the index did exactly that, as it rebounded at the bottom (Higher Lows trend-line) of the Rising Wedge, starting a new +23% rally.
Our basis for this projection was the similar Rising Wedge pattern of September 2015 - November 2016 (almost 1 year), which after a fake-out for the week hands (green circle) on January 2016 (as it was on October 2022), it rebounded in October 2016 at the bottom of the Wedge and posted a +19% rally.
You can see that so far the lows are highly symmetrical as the first was priced in the month of October (2016 then and 2023 now) and the next in April (2017 and 2024 respectively).
The initial rally that broke above the Rising Wedge in 2017, had a small upward extension that then gave a new pull-back for an August 2017. If symmetry continues to dictate the price action, then the current August Low (2024), may be our new bottom as Aug 2017 was.
On the past fractal, the new rally was concluded on a +30.72% rise. As a result, we see it highly possible to get a new long-term peak early next year (January 2025 if symmetry continues) at around 49000.
High as this Target may seem at the moment with the current economic slowdown fears, these are the standard conditions that make rallies start "under our nose".. Especially as November's U.S. elections are approaching.
-------------------------------------------------------------------------------
** Please LIKE 👍, FOLLOW ✅, SHARE 🙌 and COMMENT ✍ if you enjoy this idea! Also share your ideas and charts in the comments section below! This is best way to keep it relevant, support us, keep the content here free and allow the idea to reach as many people as possible. **
-------------------------------------------------------------------------------
💸💸💸💸💸💸
👇 👇 👇 👇 👇 👇


Dowjones Is Approaching The Daily TrendHey Traders, in today's trading session we are monitoring US30 for a buying opportunity around 38400 zone, US30 is trading in an uptrend and currently is in a correction phase in which it is approaching the trend at 38400 support and resistance area.
Trade safe, Joe.

Dow Jones Index (US30): One More Bearish Setup
I also see a bearish trend following setup on Dow Jones.
After yesterday's selloff, the market started a correctional movement.
On an hourly time frame, the market found a resistance around 39100 level
and formed a double top on that.
I think that the Index may drop at least to 38655 level.
❤️Please, support my work with like, thank you!❤️

US30 DailyPrice is nearing the 20-week moving average, a key support/resistance level. Historically, this MA has influenced significant reversals or trend continuations. Watch for potential bullish bounce or bearish rejection upon contact.

Dowjones updateDue to linked analysis dowjones fell as a waterfall.
be careful about BUY in Dowjones, dax, s&p500, Nasdaq and ...
The Polar bear (dowjones) will continue to fall the summit.
comment your desired analysis.
good luck

Bought calls near end of day in $DIAWe closed above daily anchored vwap late on Friday afternoon in AMEX:DIA so I did buy calls with a target towards 404
Will manage the position Monday morning
