Dow Jones: The Second Time Around 🎤“ Love is lovelier the second time around… ”, so they say in the Oscar-nominated song “The Second Time Around”. First performed by Bing Crosby in the 1960 musical-movie “High Time”, the song became even more popular when Frank Sinatra added it to his repertoire one year later.
The song’s message might also ring true for Dow Jones as the index tries to climb above the resistance line at 35521 points for the second time. We expect it to make it above this mark soon and to thus affirm further upwards movement. The index should then rise farther, even above 36446 points.
However, as long as Dow Jones has not managed to conquer the resistance at 35521 points, we must not disregard our secondary scenario. There is a 40% chance that the index could fall below 33532 points and head for the bottom of the orange zone between 33518 and 32614 points.
Dowjonesanalysis

Dow Jones US30 Chart H1Here is my view for US30 on H1. The price should go up, you can put a pending order on the Order block or find an entry on LTF within OB Zone. Trade Safe!

Dow Jones Pivotal 36k TeatIn this update we review the recent price action in the Dow Jones (futures contract) and identify the next high probability trading opportunity and price objective to target.

Dow Jones Mega Recession Please note, my analysis is based off previous history and past events. The red bars pattern is a copy fractal of the 1929 crash. Here is a representation of what a similar crash would look like for Dow Jones Industrial Average. I am personally in a large short position.

Short swing on US30- Longer term play with a overall move of around 5% - 6%
- Taking profits on the way (they are marked on the charts)
- chart looks a bit messy on the hourly, but makes more sense on LTF

Dow Jones - LongRSI - SMA is signaling buy on Dow. What do we want to see before we go long: Close higher than ema 9 (blue line) and ema 200 (orange line).
What do we don't want to see: daily close lower than this or sidewards trend breaking the triangle (blue line).
If you like this analysis - thumbs up!
________
🚀 Follow for daily posts
🎯 About my posts: They are kept self-explanatory in order to avoid overcomplicating and confusion. Mostly price signals and trend analysis combined with chart patterns.
Disclaimer: This is not an investment advice

US30 BUYThe dow jones will also have to recover, so we a most likely looking at retracements around the 50% level of the fibo

DOW Target doneWe have shared detailed DJI chart that you can see below in the link.
After breaking trend line support DJI met both the target and took support lower trend line and closing above the same trend line.
FED meeting ahead and we can expect high volatility near future.
Based on chart and price action a bounce back from current level is on the card.

Dow Jones: Superman to the Rescue! 🦸As we all clearly feel these days, the markets are knee-deep in a phase of correction. We know, this can be alarming, but never fear! There is hope for rescue! It’s a bird! It’s a plane! It’s Superman! Like Superman rushes down to catch his crush Lois Lane in free fall, Dow Jones has rushed down into the orange-colored zone between 33518 and 32614 points. And just like Superman caught Lois Lane before she hit the ground, we expect Super Jones to end wave C in green within the orange-colored zone and before hitting 32500 points. The index should then fly up again, his red cape fluttering behind, and aim for 35221 points. From there, its superpower should be strong enough to shoot it to 36446 points and higher.

Top 4 Currencies & Us 30 Trade Swing Ideas This WeekHi Forex Traders. I’m analyzing my forex price charts, and I see a few great opportunities on the rise for you. While I may see these as good setups, please be sure you construct your own analysis to decide your entry and exit points.

US30 - Where is the next buy zone after we fall?Technical Overview: - Dow Jones
Simple, whoever tells you short is selling you lies, you want to be on the safe side? stay bullish on US markets simple as that.
Wait for dips if they happen don't chase the market :)
Analysis is only 1 piece of the puzzle 🧩
Our analysis is a sentiment for the upcoming week, month.
Use this as a weather forecast, you are the person that has to put on a jacket when it’s raining.
Trade this sentiment based off your own entry strategy at the right time.
Flow with the Devil 😈
Trade with the manipulation👾

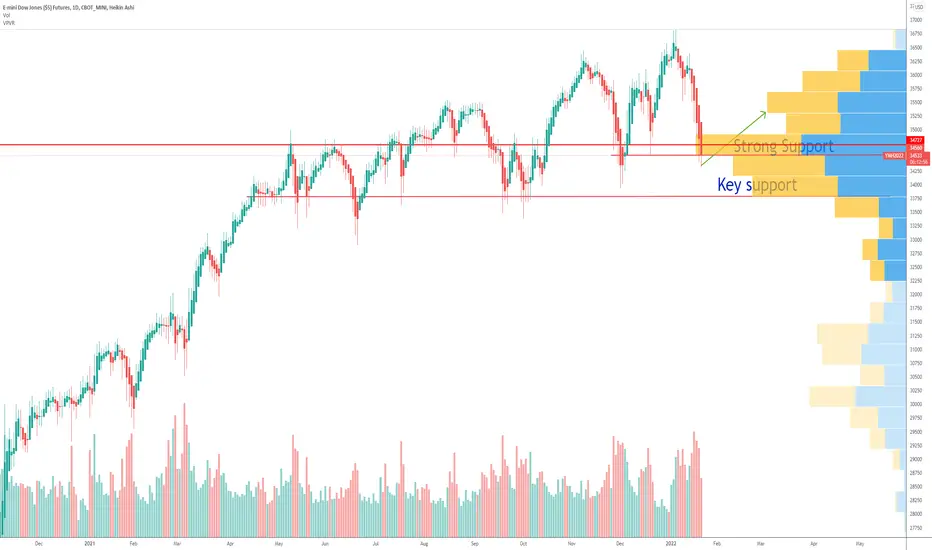
DOW30 support levelsThe DOW30 went even lower from the strong support that it should hold and now will either do a small bounce, if not go lower and visit the key support area.
Looking forward to read your opinion about it.
US30 BUY 01/18US30 is truly my favorite pair to look at and I look at it consistently everyday, I try to keep it simple with my analysis so it doesn't seem overwhelming due to the volatile movements, with that being said I am expecting a BUY since price is now back at the bottom of our channel
Note: Price has been in a Flag Channel since MARCH 2021
Major Structure:
Monthly/Weekly/Daily -
Price has been In an Bull Flag for a few months now, for major structure I have price still BULLISH creating a HH/HL, although the economic factors like Covid 19 (Omicron, Delta Variants), Inflation (@ all time high 7%), Labor Stats, Short Squeezing etc. could cause some sort of Correction/Crash
Major/Minor Structure:
4HR/1HR -
Price is just about to hit our -61.8 Retracement on our Fibs for Major Structure, which means we should expect some sort of Reversal in price which is another confluence for our BUY
Minor Structure:
1HR/30MIN
Price is heading towards our -61.8 Fib Level on Minor structure as well, with it being Wednesday and this being our Intraday timing, HOTW is currently on a Sunday, but I'm expecting a Mid week reversal with the LOTW either being made on Wednesday night or London session Thursday, with a Rally to follow into Friday and making its HOTW.
I'd love any feedback or commentary from those knowledgeable of Fibs, major structure or use a similar strategy ..
From C

Dow Jones analysis As I mentioned in previous chart of DJI closing below 36000 will trigger strong selling.
You can see in the current chart that the index treded multiple time below 36000 but did not close even a single day.
Just wait for one closing below 36000 and get ready for a big red candle.


DowjonesThe Dow Jones index is forming 5 incomplete waves, which is likely to change the trend and start the downtrend.

Dow jones : Do we have a correction soon?We could see a huge bearish divergence in the monthly chart. The last time we had one in the late 90s and we saw a 40% Correction. We could see a similar structure in the current oversold market and will the history repeat again?

Dow Jones: Ready for Takeoff ✈️ On his way downward, Mr. Jones has already dived into the white area between 35690 and 34805 points a few times and he still could go in there again to finish wave (2) in white. There, at the latest, we expect the index to rise again. If it breaks through the resistance at 36832 points on its way, higher goals will become more and more likely.
There is also a 40% chance that the index could rise immediately and hit the 36832 mark earlier already. So, you should all fasten your seatbelts, because Mr. Jones is ready for takeoff!

Dow Jones Futures H1here is my view for Dow Jones Futures or US30 on H1. The price should go up, you can put a pending order on the Order block or find an entry on LTF within OB Zone. Trade Safe!

Dow analysis DJI have important support at 36000
According to the chart we should bounce from 36000 and retest previous all time high.
On the flip side closing below will accelerate selling pressure and we can see 34900 level near future.
Consolidation near 36000 will decide further move.

Dow Jones Industrial Average Index (DJI) Analysis 05/03/2021as we can the there is a bearish divergence between Price and MACD, which is the sign of trend reversal and we can predict the 61.8% of Fibonacci retracement as one of our TPs
so soon we shall face an other recession
how big this time. we shall see.
if 61.8% Fibonacci retracement stands then we may go for a bullish rally and if not and braked down then a huge recession and history will be repeated again...

Dow Jones (Over Bought) Shorting chance Jan 2021Hi
This index seems to be over bought to us as it is recovering from the Corona pandemic Crisis and the way it has rallied, we may have a chance to short it at its correction or so called retracement.
we can see bearish divergence of Price and MACD and combining this flow with Price Action Analysis it gives us more confluences of a down fall and a trend reversal or at least a retracement or market correction
we have specified some support levels which can be used as some target areas and some trend lines as the most fall levels
truly speaking we don't have any concrete fundamental reasoning behind such a fall but some how we can relate it to the upcoming chaos in the USA political and FinTech industry and giant MNCs who can be an other reason for an other crisis...
please bring some reasoning for this fall if you have any in mind...

Dow Jones -90% coming to a screen near you soon?My thoughts on the DJI (Dow Jones Industrial Average). I believe the roring 20's are duplicated in the DJI chart and that we are about to enter a huge recession in 2022. Dow Jones finally bottoming out around $5,000?
