The bear counter attack!Previously, we saw a bevel pattern on the Dow and SP. Now we may have the continuation of the bearish movement.
Dowjonesanalysis

Dow Jones Index Technical AnalysisLet me start off by saying I hope each and everyone of you are safe and healthy. Some of the craziest s*** has happened within the last few weeks including oil futures going negative -44 per barrel.
While everyone is distracted with the FED throwing in fridge after sink and the economy halting, a lot of people seem to have forgot about earnings. Knowing earnings was just around the corner after this insane dump, any experienced trader would have know prior to earnings that volatility and typical speculation would pick up. That being said, all this has resulted in a pretty massive rebound (DJI 29%) (SPY 26%).
These next few days are extremely important, whether you are planning on building a long-term chair or play some options. All I have to say is take advantage of the opportunity presented and money will come eventually.
I'd love to hear what you guys have to say! Share your charts, thoughts, and feedback below.
DotcomJack | DO NOT TRADE THIS


US30 SHORTHello !
I believe we have A great short opportunity coming up in the next few days as US30 nears the 61.8 Fib level, which is a zone of major resistance. The daily chart is also showing a rising wedge.
The 61.8 Fib level is a notable area of reversal as in the 2001 / 2008 DOW crashes we saw relief rallies to the 61.8 Fib level followed by further downward movement. Im targeting the next major zone of support, the 15k/16k area.
Given the current nature of the US economy I do not believe we will return to ATHs anytime soon despite the massive injection from the FED. We have 22+ million unemployed, are on the brink of a mortgage/loan default crisis, projected Q2 GDP of roughly -30%, let alone the companies that will begin to file bankruptcy in the coming months.
Feel free to share ideas ! Thanks !

US30 DOW JONES ANALYSIS DJI BUY OR HUDGElook at this magnificent bullish divergence with confirmation of the breakout of the RSI50 and the breakout and correction on the FIBO 50%
Very tight stop loss and TP1: 25018 TP2: 25698
possibility of hudge

Dow Jones US Stock Index (Creating a Higher Low!)View On Dow Jones (15 APR 2020)
As we expected in the last 6 Mar, this index has reached 23.5 regions and we can say, it is currently at a strong resistant region.
So, there is likely going to a pullback, possibly toward 22,750 regions for now.
Overall, as long as 21,000 regio hold, we can say it is still in UP trend.
Let's see.
DYODD, all the best and read the disclaimer too.
Feel Free to "Follow", press "LIKE" "Comment".
Thank You!
Legal Risk Disclosure:
Trading foreign exchange or CFD on margin carries a high level of risk, and may not be suitable for all investors.
The high degree of leverage can work against you as well as for you.
Before deciding to trade foreign exchange you should carefully consider your investment objectives, level of experience and risk appetite.
The possibility exists that you could sustain a loss of some or all of your initial investment and therefore you should not invest money that you cannot afford to lose. You should be aware of all the risks associated with foreign exchange trading, and seek advice from an independent financial advisor.
DISCLAIMER:
Any opinions, news, research, analyses, prices or other information discussed in this presentation or linked to from this presentation are provided as general market commentary and do not constitute investment advice.
Sonicr Mastery Team does not accept liability for any loss or damage, including without limitation to, any loss of profit, which may arise directly or indirectly from use of or reliance on such information.


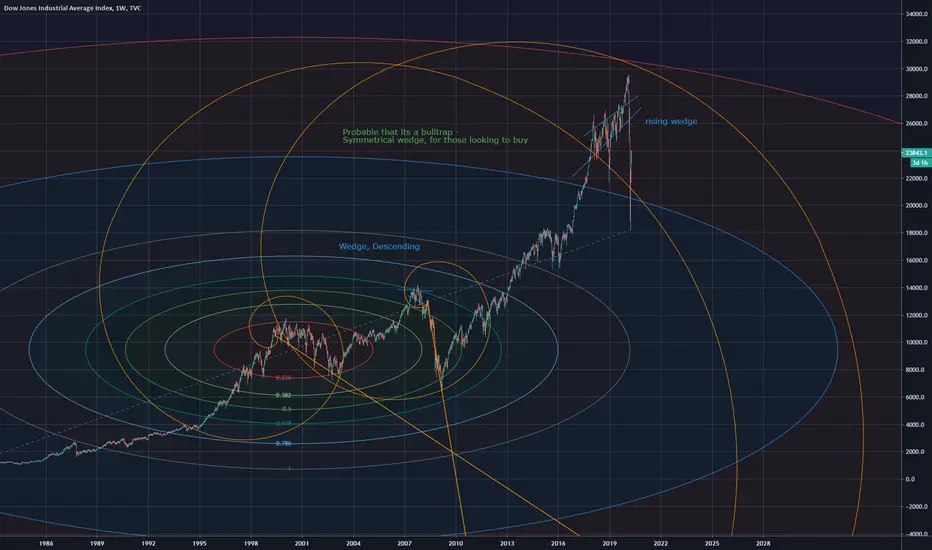
Dow Jones Fibonacci SpiralsInteresting Dow fib spiral showing three bottom points, will the symmetrical wedge be a bulltrap? we will see.
Daytraders, Are You Ready? (DJI)Symbol: DJI
This post is for all the day trading junkies out there. I am showing the 30 min time frame with a cross over to the downside. If I double that timeframe and go to the hourly, I'm at a tipping point in thr market. We would enter to short till 30 min and hourly line up to go back to the upside. We are putting our money on red. We will watch closely on the market open . If we see a change in our indicator and strategy than we will have to play break to top. But, for the most part we are short here.
----------------------------------------------------
Want to level up your trading skills?
We just realesed our new course! Follow our tradingview page and visit the link in our bio if you are looking for new strategy to add to your arsenal.
Also checkout our trading indicator available in the link on our page.
---------------------------------------------------
Thank you for your continued support, God bless.
- Major League Trader

Dow Jones now at 20941, Long Term Target is below 10000Long Term Dow Jones Industrial Average target is below 10,000
This is not a forecast I want to make, but this is what my longer term analysis shows. I hope the forecast does not come true but this is what my analysis shows, which is based on multiple time frame analysis of volatility and momentum.
Best strategy according to this analysis is to look for sell signals after every strong rally loses momentum, unless and until this high probability pattern is invalidated.


How Coronavirus looks on Dow JonesHello Traders,
First i will discuss with you about the coronavirus, Us have more casses than China right now (Sell Sign), unemployment claim is 3.2 million (Sell Sign), 2 trillion $ was injected in US (Buy Sign, but already gone).
Second, on Friday night was a fight at price 2200 and the price was violent on sell move, we can expect an Gap on monday when the Stock wake up. We have here a Shark Pattern, in my oppinion, the 61.8 Fibo is the first TP, and after that i expect a down trend.
What do you think?
Have a great day!

Too early to sellTo early to sell for long term. Sell at 50% or 61.8% or in between. Should make LL.

DOW JONES : MARKET BOTTOM ISN'T THERE YETAs seen from the DOW JONES chart over the daily timeframe , it is following the Elliot wave pattern and DOW is currently in the 4th corrective wave. All the signals are pointing towards a lower bottom. The next area of major monthly support is between 13000-15000 level where the market bottom can be seen. Tread carefully in the coming days. The market is only reacting towards induced positive news from the government, whereas the harshest effect of coronavirus is yet to be realized. Historically, previous recessions have found support in 200 or 300 Monthly EMA and currently the 300 Monthly EMA also lies between 13000-15000 support level. Instead of taking a pre entry, I would tread carefully and start accumulating once the DOW reaches near 15000 support level. The best way to accumulate is to wait and let the Elliot wave complete the downturn, then correlating the DOW with the VIX index and waiting for the volatility to reduce. Lower volatility near the support levels is a good sign to start accumulating and saving one self from taking a pre entry.

Dow Jones Monthly Chart:Dow Jones Monthly Chart:
The index is approaching the levels from where the index has broken out in the month of May-2015 and August-2016. The break out levels are 18400 and 18700 respectively. (Red Line)
Around 18000-18200 the trend-line joining highs of 11700 (Jan-2000) and 14200 (Oct-2007) is also lying. (Blue Line).
For educational purpose.

DOW JONES ALTERNATE VIEWcovid-19 pandemic causes world wide panic on the markets.
expecting dow jones & other equity markets recover soon.

DOW JONES INDUSTRIAL AVERAGE INDEX (DJI) MonthlyDates in the future with the greatest probability for a price high or low


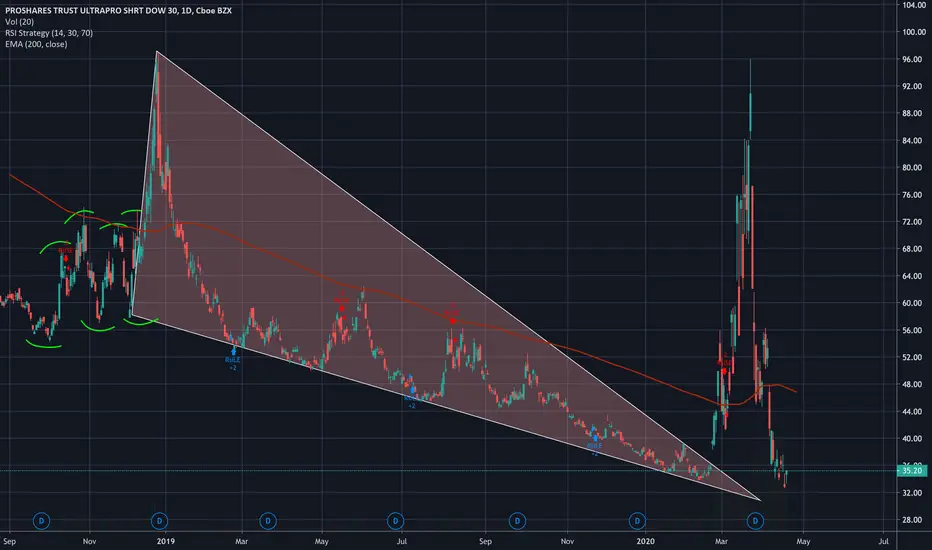
DOW sparks will flyCatalysts for bull runs have been seen including symmetrical triangles, and three clear bullish divergences. A broadening wedge within a broadening wedge is present, these 52% of the time (according to bulkowski's chart patterns) result in a breakout downwards. Most often this chart pattern is found in bull markets. A clear cut case is the DOW. Going off purely TA a breakdown is likely from these high levels back towards the mean of the wedge , possibly even forming a symmetrical triangle or a falling wedge within the wedge to hold it. Monthly chart. If you are looking to buy, entering is fine as long as you are prepared for downsides and want to go long, as you can see the chart is clearly bullish .

Weakness in Dow Jones is stronger.Weakness in Dow Jones is stronger.
Support 24656
Last support 23583
-1070 points fall is till remaining.

DOW JONES INDUSTRIAL AVERAGE INDEX (DJI) WeeklyDates in the future with the highest probability for price direction reversals

Dow Jones 30 Robust Demand| 3rd March 2020"I can calculate the movement of the stars, but not the madness of men."
-Sir Isaac Newton
The daily chart close with last week price in robust demand. This is the potential buying signal from the bear traders as the movement of the bull has been spotted on H4 with evening stars. The price closed at 25553.00. Would be advisable to put trade on the key above 24500.00 any price.
I will look onto the chart on Monday open whether taking another more deep price before hold the long and adding lots. If this has not resolve on the fundamental week next week, would be the price to go below and sending it to 21555.55 to the market crash 2018.
Remember, you can never have to enjoy the long term bull like you did before as the coronavirus is still in the background as the economy not recover yet.This is just the beginning of the crash sensation.This is just the beginning of a downtrend.
By Zezu Zaza
