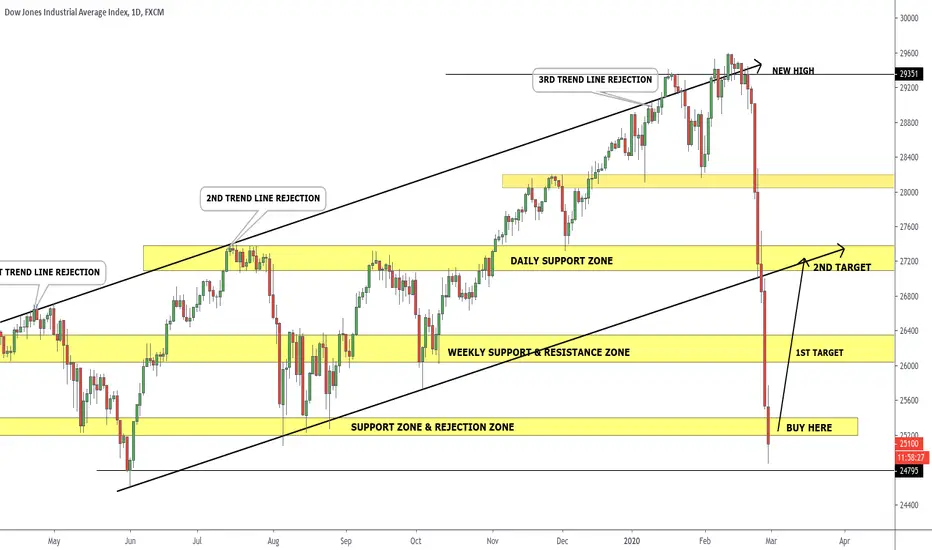
DOW JONES PULLBACK This analysis smashed my TP with over 2000 pips i am grateful for that, price now sitting in my buy zone i will be looking forward to a bull tun during NY session, pullback back to trend line. Join the train if you can..
Dowjonesanalysis
DOW JONES 2000 PIPS BAGGED SUCCESSFULLYAnalysis and signal was dropped for free, Target smashed successfully, i am forever grateful.. Nice way to end the month.

DowJ is heading down, correction will be stronger26800 is a good area to get back in, but of course it might be only a bounce, will have to analyze again once it hit.

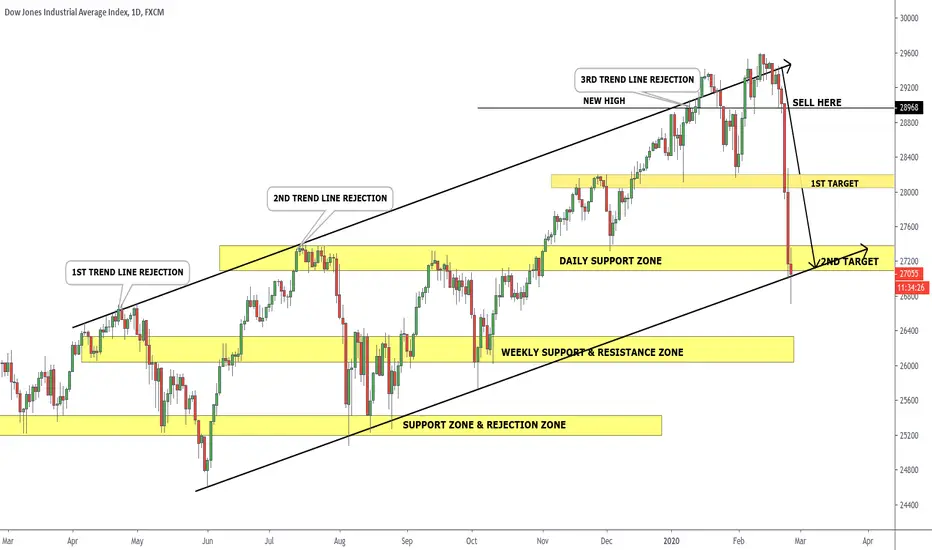
DOWJONES BEARS ON RALLYWhen everyone was buying, i and my team was selling, massive profits bagged successfully last week, looking for another opportunity for more entries to take the short to second target, this will be considered free signal and cause of action on this trade was shown to everyone last week, news in favor of bears this week, join the train if you can..

DOW JONES BUY THE DIP THEORYI don't like shorting indices unless I am scalping. So we plan to buy the dip and scalp the shorts!
See if this idea works with your analysis.
Good luck,
FIBZ


DowJ Looking to fall Dec. 31 2019 and bounce starting 2020DowJones is aiming u to fall roughly 250 points Dec. 31 2019, before the new year. Volatility Index (VIX) is screaming for new highs, sending the bears to eat up, and giving the bulls for room to take profit. Expect a bounce at previous support from the 28200 level and potential breakthrough of that 28200 level.

DOW GOING TO 30K OR BACK TO 27K ?US30 price is in a wedge pattern but it's not yet enough conirmation to sell it. So,we will wait for more conformations. Please give a follow to get the updates on time :)
In H4, we will wait for an impulsive move to the downside and trade the pullback.
H4 :
Traders! if you like my ideas and do take the same trade, please write it in comment so we can manage the trade together.
_________________________________________________________________________________________________________________________________________
Disclaimer : The content on this analysis is subject to change at any time without notice, and is provided for the sole purpose of assisting traders to make independent investment decisions.
_________________________________________________________________________________________________________________________________________
Thank you for your support!

Trump and US-China Deal Attract the AttentionIt was risk-on mood after yesterday Trump teased traders with hope of a US-China trade deal by tweeting “Getting VERY close to a BIG DEAL with China. They want it, and so do we!”
If the both sides can’t reach an agreement within the next few days, additional tariffs will be imposed on imported Chinese goods on Sunday, December 15th. If a deal is reached before Sunday, the tariffs will likely not be imposed, and current tariffs may be rolled back. The big question that remains is, “How much of the existing tariffs will be rolled back?” We saw following reports by the Wall Street Journal that U.S. negotiators offered to cut tariffs by 50%. But until Trump makes an official announcement, which must occur before December 15, the tariffs could still be imposed.
The Dow Jones index has touched new record highs yesterday at $28,225. At this point in time it’s likely that we will continue to see pullbacks as buying opportunities. If the price break above the yesterday's high we could expect the bulls to extend the upside momentum towards 28,250 (the upper line of Bollinger Bands).
But we wouldn’t be surprised at all that if by the end of the day Friday we don’t get any hint of a delay of the tariffs by Donald Trump and than the stock market pulls back significantly. The first support of course is the psychological 28,000 level. The 50-day SMA follow it, which has risen to 27,374. A clear break here could send DJIA 30 to retest the Dec. low at 27,325. If the tariffs do in fact go into effect, it’s likely that this market will gap down on Monday, so at this point it’s probably best to stay aside.
All things being equal, but we think that the next 24 hours or so could be a bit dicey. In the next trading day you can throw out technicals of the window and it's possible to see "Buy the rumor, sell the fact" trading. Don’t forget the “Santa Claus rally” either.

DJIA Struggle to Stay Above 28,000 It didn’t take long for the major indices to get back to all-time highs, as they began this shortened holiday week with a solid rally on hopes for a trade deal. The prospect of renewed economic growth and favorable monetary policy have also played some roles for the rally.
Overnight, DOW rose 0.68%, but lagged comparing it with S&P 500 and NASDAQ. Obviously, the market will continue reacting to whatever the current trade headline is - bad or good - with the relevant price action.
The H4 RSI indicator is going to test the 70% area now. This could imply an aggressive profit-taking activity for the coming sessions. The inability to keep above 28,000 will be the first sign of selling pressure. Taking out 27,675 will indicate the selling pressure is getting stronger. The next support in that case will be the 50-day SMA on 4-hour chart which has risen to 27,489.
On upside, the index seems ready to re-test the record high at 28,090. A clear break above it could extend the bullish pressure towards the upper line of daily Bollinger Bands at 28,237.
Take in mind, that the trading activity will decline in the coming days because Thanksgiving Day, and of course the market is closed on Thursday and closes early on Friday.

DJIA Stay In A Risk-On MoodUS equities rallied last week to new record levels with the Dow Jones Industrial Average breaching 28,000 for the first time. Soft economic data, Trump’s impeachment hearing, Hong Kong protests, and Middle East unrest were all considered secondary factors in investment decisions.
Today European stocks kick off a new week a little flat, with more talks between the US and China failing to excite investors in the way they have been recently.
So, what now? With the economic calendar being empty to during the start of the week, any trade updates will dictate the mood in markets. As things around the trade talks stand optimistic, the Dow is set to hold above the 28K level at the open. The market is trading on the strong side of an uptrending Gann angle from the 25,743 main bottom on October 3. Look for the uptrend to continue as long as the Dow futures contract holds above this angle.
The 55-day moving average has risen to 26,972 and could provide support if the price begin to fall. A move through 27,400 will shift momentum to the downside. This will not mean the main trend has changed, but it will indicate the selling is greater than the buying at current price levels. While the nearest main bottom 25,743 hold, the uptrend is safe for now.

DOW JONES HAS BROKEN OUT...but will it be a false one.My quite reasonable sell zone has been highlighted and the DOW is now just entering it. I would recommend caution to all those thinking of investing in stocks at this point in time. There is not much more head height left and lots of room to fall.

Dow Jones Trading 2 HR Chart Oktober EducationHere i show you a simple trading stragety
on a 2 HR Chart.
So only a few trades in a month.
Trading Long if you have a high high
anmd trading short if you have a lower low.
10 Trades
+ 330
+ 60
+ 400
- 270
- 45
+ 30
+ 45
- 110
- 190
+ 250
6 Gewinner + 1115 Points
4 Verlierer - - 715 Points
SUMMARY 400 POINTS
with only 4 times a day to watch the chart
It would be even better in a 1 HR chart
with more trades and better Results
Good trades.
if you want to support my work, please like them
My analyes here are all NOT a request to buy or sell
seomething. Allways do you own research.
Renkotrade

DJI Dow Jones SHORT Critical Situation Longs Breaks 26750 ?Dow Jones are right now in a decision mode.
26750 is the key Level which must hold for Long
in a Longtime View.
In shorttime we are ahsort since 26980 broke with
2 supports.
Now there is the Long Trendline in BLUE which is in danger
Watch out these and the 26750 Level to decide the direction.
For new Longs in short timeframe we must climb above 26870
Good trades
If you want to support my work please like them...
and if you want to know more about my trading style
please send my a boardmail.
Renkotrade


DOWJONES WEEKLY PULLBACK Currently bears was on a rally and train was taken, 600 pips bagged successfully and now currently trailing the pullback..
Restest of broken structure, 3 soldier candle formation..


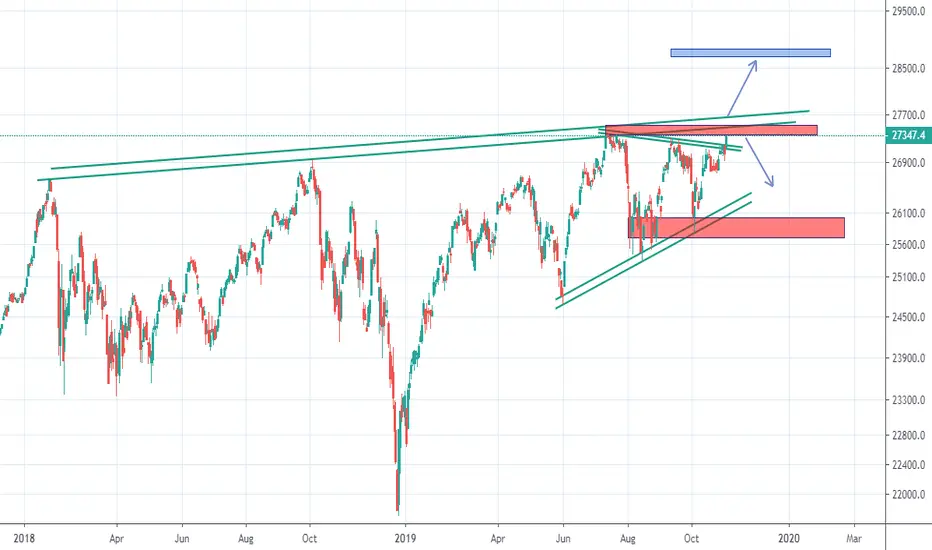
Historical Analysis of the DIAHistorical Analysis and Monthly Chart :
The DIA showing Strong Major Bull Trednd with serveral interaction with the Return Line (RL).
Note the Pick in Momentum since February 2016 (or B3), the next Major bottom made above the Major Trend Line (MUT), and therfore showing the failure of the Bears to take the price downward.
But, we dont see strong sign of buyers either.
The DIA is inside big Consolidation that lasted for almost 2 years (since Oct 17).
Weekly Chart :
The Resistance Area between 265.88 - 267.53 Established in Jan 2018, the second attempt to go above that level accured 1 year ago (Sep 2018) and the reaction was very violent and took the price to far down levels.
Since then the price hit the Resistance Area 3 Times :
1) April 2019 - the price got into resistance reaction and made New High Bottom.
2) June 2019 - the price go through the Resistance Area, Failed to continue, and made new higher bottom bellow that level.
3) September 2019 (these days) - the price close above the area last week, but with relatively low volume.
We need to keep an eye on the price this week and look for the power of the buyers, how far they can take the price up (if any).
Notice also the Volume Activity in the Consolidation Area - Pickup on down moves, and diminsh on the Rallies - weakness .
Daily Chart :
The Daily chart does not give us alot of new information.
But we can see the Trading Zone (sort of Rectangle), and the price movement above it.
The Minor picture is Bullish.
Conclusion :
Since B4, the overall picture looks positive.
But the Key for understanding the coming moves relly on the reaction to the Resistance Area, and the examination of the Bulls Power.
Any High Volume Bullish Activity above the Resistance Area, can take us again to the Return Line (RL).
If we will see Second Failure on the Resistance Zone,we need to examine the power of the Beats, and the next areas to look for are the bottom of the trading zone, and B4.1.
If the Bears will act Aggresivley and take the price bellow B4.1, the picture is very negative and the next level is the MUT.

DOWJONES 30 | CORRECTIVE UPSIDEHi Friends,
Dow Jones 30 approaching monthly and quarterly resistance zone @ 26700 -- 26775. Both medium and short term dow jones structure in corrective nature, So i looking for another wave down upto 24400 on coming months.
ENTRY & EXIT LEVELS:
SHORT @ 26700 || SL @ 27500 || TP @ 24400

$DJI Bear Flag Forming on the 1 Day Chart- Massive Recession?See more at cryptoplanet.cash
join our telegram: bit.ly
follow on Instagram: www.instagram.com

Dow Theory - DJIA and DJTA Clash to Signal Bearish Future*Yellow = 200 EMA | Blue = 100 EMA
This video goes over the divergence between the DJ:DJI and DJ:DJT . Currently, the DJIA is trending upwards, setting new highs, and lows. However, contrary to this movement, the DJTA is moving downwards heading towards a trendline shown in the video, but could very easily break through that trendline.
Why do I care?
In 1929, several months before the flash crash and the official start of the Great Depression, divergence indicated by Dow Theory helped forecast bearish price action. This is outlined in the Intelligent Investor . Part of Dow Theory states that if either the DJIA or DJTA starts moving in a direction in contradiction of the other, the index whose movement has not yet transitioned will begin to do so. In this case, that means that the DJIA should start to trend further downward.
On the weekly charts of both indices, the RSI shows obvious bearish divergence moving in confluence with the hypothesis presented by Dow Theory.
This could mean short term breaks of trendlines and longer-term moves to lower supports around 21 000 - 22 000 price range for the DJIA or lower.
Internationally, we've seen global growth in regard to Europe (eg. Germany's poor GDP report), China's poor manufacturing, the inverted yield curve, and greater bearish sentiment as a product of Trump and his trade war. These factors along with this analysis indicate looming bearish movement, but also the potential to BUY more stocks as they become cheaper and become bargains.
Good Luck Traders!
