Dow Jones - Trading 2025 Is Pretty Clear!Dow Jones ( TVC:DJI ) will create another green year:
Click chart above to see the detailed analysis👆🏻
For the past 15 years, the Dow Jones has been respecting two significant rising trendlines. With each of the previous cycles being around +80% and corrections always starting with the new year, everything is pointing towards another phenomenal stock market year.
Levels to watch: $50.000
Keep your long term vision,
Philip (BasicTrading)
Dowjonesindustrial

DJI - 1590 Points and Running!This is a long trade setup on the Dow Jones Industrial Average (DJI) on the 15-minute timeframe. The trade was initiated on January 14th, 2025, and has shown a significant upward move since then. As of today, the position is currently sitting at a substantial profit of 1590 points.
Trade Confirmation Rules:
The Risological Dotted Trend Line turned green, indicating a bullish trend or a change in trend direction.
The Risological Options Trading Indicator turned green with a bullish crossover, suggesting favorable conditions for long options positions.

DJI - ACCURATE TREND CAUGHTDow Jones Industrial (DJI) Accurate Trend Caught Using Risological Options Trading Indicator .
After a one sided 1100 points (SHORT side)
We are now seeing a Bullish reversal in the market, with 350+ points open P&L so far, and running.
The past two weeks have been painful for many traders and investors worldwide.
Share your personal experiences below.
All the best.

US Stocks Surge as Trump Takes Office: Will the Rally Continue?The US stock market is buzzing with excitement as President-elect Donald Trump's inauguration on January 20 approaches. On Friday, January 17, the major indices saw significant gains, with:
● S&P 500 SP:SPX rose 59 points, or 1%
● Dow Jones Industrial Average TVC:DJI increased 335 points, or 0.8%
● Nasdaq composite NASDAQ:IXIC surged 292 points, or 1.5%
◉ Major Sector Driving Gains
The technology sector, particularly the "Magnificent Seven" stocks, has been instrumental in this upward momentum.
◉ Investor Sentiment
Investors are optimistic about Trump's policies, but concerned about potential inflationary pressures. Experts believe Trump's administration could lead to significant growth due to:
1. Increased Government Stimulus: Trump's background as a real estate developer may result in policies designed to stimulate economic growth.
2. Technological Innovation: Rapid advancements in technology are expected to create new industries and opportunities.
3. Lower Interest Rates: There is speculation that Trump may implement lower interest rates to further encourage economic expansion.
Overall, the market is cautiously optimistic, with investors closely monitoring Trump's policies.

DJI Short Trade Nets $2100 Dip: A 4.7% Market Move!Dow Jones Industrial (DJI): $2100 Drop Captured
On December 11, 2024, the Risological Options Trading Indicator provided a clear signal to initiate a short trade on the Dow Jones Industrial (DJI). This trade capitalized on a significant bearish move, capturing an impressive $2100 dip, equating to a massive 4.7% decline from the entry point.
The trade was identified using the Risological Options Trading Indicator, which accurately captured the strong bearish momentum. The red overlay in the histogram confirms increasing selling pressure, coinciding with the downward trajectory.
This setup highlights how the Risological Options Trading Indicator leverages market structure to pinpoint high-probability trades. The captured $2100 move reinforces its precision in navigating even the most volatile markets.
All the best!
Namaste.

DJIA Index. Shake it. Bake it. Booty Quake It. Roll It AroundMarkets were shaked this Friday after the December employment report came in much stronger than expected.
The economy added 256,000 jobs in December, well above the average economist estimate of 155,000. The unemployment rate unexpectedly declined to 4.1% from 4.2% in November.
The Nasdaq 100 immediately dropped by about 1%, while the 10-year US Treasury yield spiked nearly 10 basis points to 4.785%, representing its highest level since October 2023.
The strong payroll report further strengthened the case for no more interest-rate cuts from the Federal Reserve, at least for 2025.
The moves in stocks and bonds are a continuation of what's been seen in recent weeks: Following a period of euphoric optimism, investors have started to anticipate higher inflation stemming from President Donald Trump's proposed trade and fiscal policies. If the upward move in bond yields continues, Americans will feel it in a big way.
The CME FedWatch Tool indicates that markets now expect just one 25-basis point interest rate cut this year, down from expectations late last year of as many as three. The chances that there will be no rate cuts in 2025 more than doubled Friday morning to 28%.
Dollar index TVC:DXY rockets to the moon, while the 10-yr TVC:TNX strongly above 4.5%.
Endogenously, the market has been preparing for such a turbulence, as it's been discussed in earlier posted idea "Strategy 2025. BTC Airless Scenario Below $100'000 Choking Point" .
I remember, the financial market has had a tough weeks in last December, 2024, but it might also be in store for a tough year in 2025, as I noted those time.
The market was on track for its worst weeks over years after the Federal Reserve gave a hawkish forecast for interest rate cuts in 2025. But looking at the market's internals, it was clear that damage had been inflicted well before the Fed's Wednesday meeting — and the signal is a historic indicator of tough times ahead.
Dow Jones Futures has ended 6th straight RED WEEK in a row - the quite rare event.
The historical back test analysis over last 25 years indicates, it could lead to further (at least) 10 percent decline for Top-30 stock club.
The major technical graph indicates on a bearish trend in development, where major 200-week SMA support is nearly 35'700 points in this time.

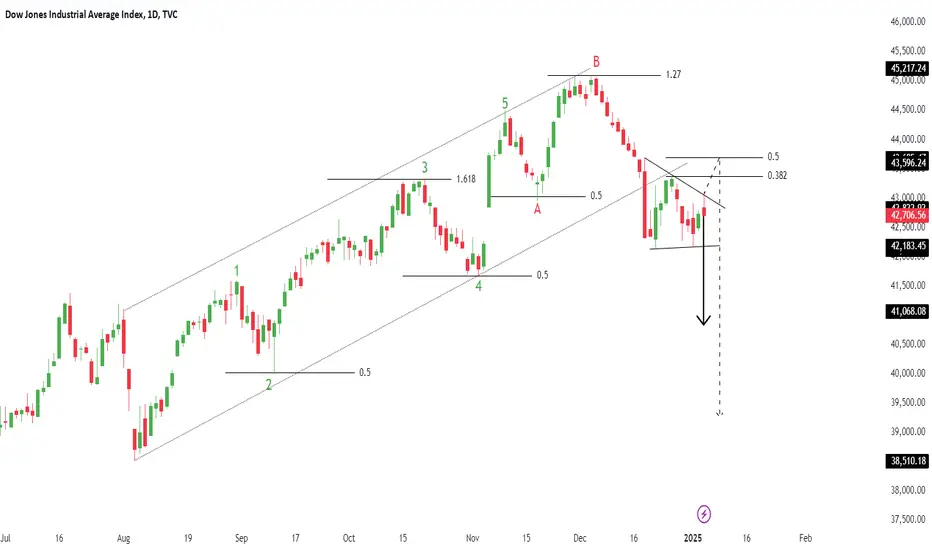
DJIDJI - Dow Jones Index
Break of Structure
Symmetrical Triangle as an Corrective Pattern in Short Time Frame
Demand Zone
Fibonacci Level - 38.20% / 50.00%
Completed " 12345 " Impulsive Waves and " AB " Corrective Waves
Dow Jones Industrial (DJI): SHORT TRADETrade Overview:
The Dow Jones Industrial (DJI) chart presents a strong short trade setup on the 1-hour timeframe. Using the Risological Swing Trading Indicator , this trade successfully achieved TP1 (43,779.69) through TP3 (42,180.27), with TP4 (41,686.05) remaining highly probable based on prevailing market trends.
Key Levels:
Entry Price: 44,273.91
Stop Loss (SL): 44,673.77
Take Profits:
TP1: 43,779.69
TP2: 42,979.98
TP3: 42,180.27
TP4: 41,686.05
Market Sentiment:
The trade reflects bearish momentum, supported by broader market conditions indicating reduced risk appetite. The Dow Jones continues to exhibit a descending trendline and weaker market confidence.
The Risological Indicator identified precise entry, stop loss, and take-profit levels, enabling a disciplined and profitable trade execution. With three targets already achieved, the setup remains poised to capture further downside momentum.

Strategy 2025. BTC Airless Scenario Below $100'000 Choking PointThe crypto market is flashing a worrying outlook for 2025, since a disappointing Santa Claus rally this year could deepen issues.
This is especially important if BTC will not be able to finish the year 2024 firmly above $100'000 per coin.
The financial market has had a tough week, but it might also be in store for a tough year in 2025.
The market is on track for its worst weeks over years after the Federal Reserve gave a hawkish forecast for interest rate cuts in 2025. But looking at the market's internals, it's clear that damage had been inflicted well before the Fed's Wednesday meeting—and the signal is a historic indicator of tough times ahead.
The number of stocks in Top Stock Club S&P 500 that are declining outpaced advancing stocks for 14 consecutive days on Thursday.
The advancing/declining data helps measure underlying participation in market moves, and the recent weakness signals that even though the S&P 500 is only off 4% from its record high, there's damage under the hood of the benchmark index.
This is evidenced by the equal-weighted S&P 500 index being off 7% from its record high.
According to Ed Clissold, chief US strategist at Ned Davis Research, the 14-day losing streak for the S&P 500's advance-decline line is the worst since October 15, 1978.
Clissold said 10-day losing streaks or more in advancing stocks relative to declining stocks can be a bad omen for future stock market returns.
While this scenario has only been triggered six times since 1972, it shows lackluster forward returns for the S&P 500. The index has printed an average six-month forward return of 0.1% after these 10-day breadth losing streaks flashed, compared to the typical 4.5% average gain seen during all periods.
"Studies with six cases hardly make for a strategy. But market tops have to start somewhere, and many begin with breadth divergences, or popular averages posting gains with few stocks participating," Clissold said.
Perhaps more telling for the stock market is whether it can stage a recovery as it heads into one of the most bullish seasonal periods of the year: the Santa Claus trading window.
If it can't, that would be telling, according to Clissold.
"A lack of a Santa Claus Rally would be concerning not only from a seasonal perspective, but it would allow breadth divergences to deepen," the strategist said.
Also concerning to Clissold is investor sentiment, which has flashed signs of extreme optimism since September. According to the research firm's internal crowd sentiment poll, it is in the seventh-longest stretch in the excessive optimism zone, based on data since 1995.
"Several surveys have reached what could be unsustainable levels," Clissold said, warning that any reversal in sentiment could be a warning sign for future market returns.
Ultimately, continued stock market weakness, especially in the internals, would suggest to Clissold that 2025 won't be as easy as 2024 for investors.
"If the stock market cannot rectify recent breadth divergences in the next few weeks, it would suggest our concerns about a more difficult 2025 could come to fruition," the strategist said.
Moreover, Dow Jones index has printed recently The Three Black Crows Bearish candlestick pattern, on weekly basis.
This is especially important, since mentioned above pattern is massively unwinding from Dow's all the history highs.
Previously this pattern has already appeared in TVC:DJI in November 2021 and lead to 20 percent decline in 2022 for Dow Jones Index and to more than 70 percent decline in BTC.
The Three Black Crows Bearish candlestick pattern also has appeared in Dow Jones Index in September, 2018 (lead to 18% decline) and in July, 2007 (lead to more than 50% decline).
The main technical graph represents a Choking Strategy for BTC in 2025, i.e. BTC airless scenario below $100'000 choking point.
The epic 52-week SMA breakthrough in BTC will definitely accelerate a decline at all.

What Is the DJIA, and How Can You Trade It?What Is the DJIA, and How Can You Trade It?
The Dow Jones Industrial Average (DJIA) is one of the world’s most recognised stock indices, often seen as a barometer for the US economy. Tracking 30 influential companies, the DJIA offers insights into market trends and economic shifts. This article explores what the DJIA represents, how it’s constructed, and how to trade it.
Dow Jones Definition
The Dow Jones Industrial Average, usually abbreviated to DJIA or DJI, is one of the most well-known stock indices globally, often called simply "the Dow." This index tracks 30 of the publicly traded companies in the US, including major names like Apple, Boeing, and Goldman Sachs. Designed to represent a cross-section of the American economy (although it does not include utilities or transportation companies), the DJIA provides a snapshot of market sentiment and economic health through the performance of these companies.
The DJIA was founded in 1896 by Charles Dow and Edward Jones, initially with 12 major industrial companies. Over time, Dow Jones Industrial Average companies evolved to include corporations across diverse sectors, though it's worth noting that these are all large-cap companies, meaning they have substantial market values.
Importantly, the Dow is price-weighted, meaning in DJIA, a stock’s price directly affects the index value — stocks with higher prices hold more influence over the index's movements than those with lower prices. So, a stock priced at $300 will impact the DJIA more than one priced at $100, even if the latter company is larger in overall market value. For example, high-priced DJIA stocks like Goldman Sachs or UnitedHealth often drive the index’s movements more than lower-priced yet substantial companies like Cisco. As a result, the index is unique compared to indices weighted by market capitalisation, like the S&P 500.
The Dow’s movements can reflect broader market trends, but it provides less of a complete representation of the economy or stock market than the S&P 500 or Russell 2000 since it includes only 30 companies. Nonetheless, traders often look to the Dow Jones index as an indicator of market strength or weakness. When these 30 companies perform well, it often signals broader economic optimism; when they struggle, it can be a sign of potential downturns.
Components and Weighting of the DJIA
The Dow Jones Industrial Average consists of 30 large-cap US companies across sectors like technology, finance, healthcare, and industrials. Changes to the DJIA’s stocks are rare but do happen when companies no longer reflect the US economic landscape. For instance, a business facing long-term decline may be replaced by a rising industry leader to keep the index relevant. These decisions are made by a committee that aims to ensure the DJIA remains a meaningful snapshot of the economy despite its relatively small roster of companies.
What Stocks Are in the Dow Jones?
As of November 2024, there are several notable and well-recognised companies in the Dow, including:
- Apple Inc.
- Microsoft Corporation
- Amazon.com Inc.
- The Coca-Cola Company
- Goldman Sachs Group Inc.
- Johnson & Johnson
- McDonald's Corporation
- Boeing Company
- Visa Inc.
- Procter & Gamble Co.
Factors Affecting the DJIA’s Movements
The DJIA can swing up or down due to various factors, reflecting shifts in the economy, company-specific developments, and broader market sentiment. The primary elements driving the index include:
- Economic Indicators: Key data releases, like GDP growth, employment reports, and inflation rates, directly impact the DJIA. Strong economic indicators tend to lift the index as they suggest a healthy business environment, while weaker data can pull it down, signalling potential challenges for major companies.
- Interest Rates: Interest rate changes, particularly from the Federal Reserve, play a significant role. When rates rise, borrowing becomes more expensive, which can reduce corporate profits and weigh on the Dow Jones Industrial Average’s stocks. Conversely, lower rates often encourage investment and consumer spending, which can boost the index.
- Corporate Earnings Reports: Quarterly earnings announcements from the 30 DJIA companies are critical. Positive earnings results can lift the Dow, especially if they beat market expectations and are from one of its pricier components. Conversely, disappointing earnings can drag down the index, especially if they reflect broader industry or sector weaknesses.
- Global Events: Major global developments, like geopolitical tensions, trade agreements, or health crises, can quickly shift market sentiment. For instance, the onset of the COVID-19 pandemic caused sharp declines in the DJIA as economic concerns spiked.
- Sectoral Influence: The DJIA’s performance can be significantly impacted by trends within particular sectors, especially those with higher-priced stocks. For instance, if several tech companies in the index perform well, they can drive up the DJIA, given their substantial influence.
- Market Sentiment: General market optimism or fear often moves the DJIA, influenced by factors like investor confidence, media coverage, and broader economic outlooks. Indicators such as the VIX (volatility index) can help gauge this sentiment and reflect periods of heightened volatility.
Trading the DJIA with CFDs
While traders have various ways to access the Dow Jones Industrial Average—from ETFs to futures—many prefer trading DJIA Contracts for Difference (CFDs) for their flexibility and accessibility. CFDs allow traders to speculate on the DJIA’s price movements without owning the actual assets in the index.
One of the benefits of CFDs is that they enable both long and short positions, so traders can potentially take advantage of rising or falling markets. CFDs also allow for leveraged trading, meaning traders can control a larger position with a smaller upfront investment. However, leverage amplifies both potential returns and risks, making risk management essential when trading CFDs.
For those interested in DJIA CFDs, FXOpen provides access to these contracts in our TickTrader platform under the Dow ticker WS30m, giving traders an easy-to-use, responsive way to monitor and trade the index.
How Traders Analyse the DJIA
Traders use several analysis methods to interpret the DJIA’s movements, aiming to understand trends, gauge sentiment, and identify potential trading opportunities. Some of the most common approaches include:
Fundamental Analysis
Fundamental analysis involves examining economic data and financial statements of DJIA companies. Traders look at metrics like revenue growth, earnings, and profit margins to gauge the health of the companies within the index. Broader economic indicators, such as unemployment rates or consumer confidence, are also essential in understanding how macroeconomic conditions may impact the Dow.
Technical Analysis
Many traders rely on technical analysis to spot trends and key price levels. Common tools include moving averages, which smooth out price data to identify direction over time, and support and resistance levels, which highlight areas where the DJIA price has historically paused or reversed. Trendlines help traders visualise the overall direction, and indicators like the Relative Strength Index (RSI) show whether the index might be overbought or oversold.
Market Sentiment and Positioning Analysis
Gauging the mood of the market is crucial, especially with an index as prominent as the DJIA. Sentiment analysis involves looking at factors like trading volume and indicators such as the VIX (volatility index), which measures market expectations for near-term volatility.
It’s also possible to interpret the positioning of traders in DJIA futures (expressed with the DJI ticker YM) via the CFTC Commitment of Traders report for insights into how various market participants are taking positions in the Dow. For instance, if the number of contracts held by non-commercials and speculators is positive, these participants are seen as bullish.
Correlation Analysis
Traders sometimes analyse correlations between the DJIA and other indices or assets. For example, the DJIA often moves alongside the S&P 500, but these correlations can shift based on economic or sector-specific developments. Through understanding these relationships, traders can anticipate how broader market trends might impact the Dow.
Risks Associated with Trading the DJIA
Trading the DJIA can be rewarding, but it comes with notable risks. One key risk is market volatility. Events like economic data releases, policy changes, or unexpected global events can cause sharp swings in the Dow’s value, creating opportunities but also increasing the chance of sudden losses.
Another risk comes from leverage, especially with derivatives like CFDs. While leverage allows traders to control larger positions with less capital, it amplifies both returns and losses. Even a small adverse movement in the DJIA can lead to significant losses if leveraged positions aren’t managed carefully.
Economic sensitivity is another factor. As the DJIA reflects the performance of large US companies, it’s highly sensitive to shifts in economic indicators like inflation and interest rates. A surprise rate hike or economic slowdown can affect the entire index, impacting all traders with positions in the DJIA.
Finally, liquidity risks can arise, particularly in after-hours trading when market depth is thinner. This can lead to wider spreads and increased costs for those looking to enter or exit trades outside standard market hours.
The Bottom Line
The Dow Jones Industrial Average offers valuable insights and trading opportunities for those interested in the broader US economy. With a clear understanding of its components, influencing factors, and trading approaches, traders can navigate the DJIA trading confidently. Ready to get started with our low-cost, high-speed trading environment? Open an FXOpen account and explore DJIA CFDs on a platform built for traders at every level.
FAQ
What Is the Dow Jones Industrial Average?
The Dow Jones meaning refers to a stock market index that tracks 30 large publicly traded companies in the United States. Known simply as "the Dow" and abbreviated to DJIA, it provides a quick view of the economic performance of some of the largest and most influential companies across various sectors.
What Does the Dow Jones Measure?
The DJIA measures the performance of 30 significant US companies, reflecting broader economic trends and investor sentiment. As a price-weighted index, stocks with higher share prices exert more influence on the Dow’s total value.
How Many Stocks Are in the Dow Jones?
There are 30 stocks in the DJIA, representing companies from diverse industries like technology, finance, and healthcare.
What Is the Highest the Dow Jones Has Been?
As of 7 November 2024, the highest Dow Jones ever was $43,823.10, marking a record peak for the index.
Is the DJI Publicly Traded?
The DJIA itself isn’t publicly traded, but traders can invest in its performance through ETFs, futures, and CFDs that track its value.
This article represents the opinion of the Companies operating under the FXOpen brand only. It is not to be construed as an offer, solicitation, or recommendation with respect to products and services provided by the Companies operating under the FXOpen brand, nor is it to be considered financial advice

DOW JOENS 1469 Points Secured on Risological BUY SELL IndicatorDow Jones Industrial (DJI) on a 15-minute timeframe captured significant profitable movements using the " Risological BUY SELL Indicator ". The tool effectively identified both bullish and bearish entries, allowing traders to secure impressive gains.
Highlights of Captured Trades:
584 Points captured in a downward move.
244 Points secured in a bullish retracement.
331 Points caught during a short trade.
310 Points profited in the final bullish rally.
The Risological BUY SELL Indicator demonstrated precision in marking key entry and exit points for high-confidence trading decisions.
Comment " FREE Trial " to get 7 days unlimited FREE trial of this indicator.

Unity recapturing previous supportUnity is re testing its time tested support downside liquidity is captured its time to shoot up!
Dyor..

Dow-n Memory Lane: Is History About to Repeat Itself?🚨 Breaking News Alert! 🚨
The Dow Jones might be partying like it’s 1929 again! 🎉 Except this time, the crash might make your portfolio flatter than a pancake at a bodybuilder's breakfast. 🥞💪
Let’s talk about the elephant in the chart 🐘—every time the Dow hits the ceiling of this oh-so-perfect wedge pattern, it nose-dives harder than your New Year’s resolutions by February. 📅💔
1906: Boom. Bust. Dow said, "Thanks, but I’m good at -90%."
1929: The OG crash. If you survived this one, congrats—you’re probably immortal now. 🧓💀
2008: The market went "Oops, I did it again" like Britney, wiping out fortunes faster than you can say "subprime mortgage." 🏚️💵
2020: "Hold my beer," said a microscopic virus, and the market tripped like it was wearing untied shoelaces. 🍺😷
Now? The chart suggests we’re flirting with another epic freefall. 🚀⬇️
🧐 How bad could it get?
Well, if history decides to copy-paste itself, we’re looking at a potential 90% drop. Yes, NINETY. PERCENT. That’s like seeing a Tesla go for the price of a second-hand bicycle. 🚲🔋
👉 What can YOU do?
Panic? Sure, if you want, but that doesn’t help. 🫠
Diversify? Probably smart. 📊
Buy gold? Maybe, if you’re a fan of shiny things. 🪙✨
Short the market? 🐻 You rebel, you.
But hey, no pressure. It’s only all your hard-earned savings on the line. 🫣💸
So, are we about to witness the Great Crash 2.0, or will the Dow keep defying gravity like a magician’s top hat? 🎩 Stay tuned, folks, because when this market sneezes, the whole world’s economy catches a cold. 🤧🌍
💬 Drop your hot takes below—because let’s face it, speculating about doom is more fun than living it! 😎🔥

Dow Jones (DJI) Linear Macro Outlook Linear target: 44k
Impulse target: 48k
The stock market cycles are lengthening. Continued downside till EOM followed by a final melt-up rally that will bring the end of grand wave 5.
ETA H2 '22 - H1 '23.

Review of Dow Jones Industrial Average Index ChartHere's a review report based on the chart you p
1. Current Price Action:
The Dow Jones Industrial Average (DJIA) is trading at 44,645.88, reflecting a recent bearish sentiment following an earlier rally. The index has shown signs of retracement after failing to maintain higher levels around 46,500.
2. Marked Daily Zone (Green Area):
A key demand zone is highlighted between 42,750 - 43,500. This zone represents a significant level where the price may find support based on historical buying activity. This zone coincides with the base of the prior bullish breakout, indicating a potential area for renewed buying interest.
3. Momentum and Trends:
Recent candles indicate a loss of upward momentum with successive bearish candles.
The price could revisit the marked Daily Zone as part of a corrective move before resuming its upward journey.
4. Market Sentiment and Potential Movement:
A correction to the Daily Zone could attract institutional buyers, providing the necessary momentum for the next upward rally.
A break below this zone may invalidate the bullish bias, pushing the index towards lower levels.
Projection and Strategy:
Bullish Scenario: If the price reacts positively within the Daily Zone, it may target 44,750 and subsequently retest 46,500.
Bearish Scenario: Failure to hold the Daily Zone could see the index testing levels around 42,000 or lower.
Conclusion:
Traders should monitor price action near the Daily Zone for confirmation of reversal signals. It is a critical area for decision-making, aligning with strong technical support and past buying interest.

Dow Jones Index (US30): Support & Resistance Analysis
Here is my latest support & resistance analysis for US30.
Resistance 1: 42450 - 42720 area
Resistance 2: 43280 - 43310 area
Support 1: 41616 - 41886 area
Support 2: 40850 - 41182 area
Support 3: 40000 - 40240 area
Consider these structures for pullback/breakout trading.
❤️Please, support my work with like, thank you!❤️

Dow Jones (DJI) Primed for a Bullish Move – Fresh Long Entry!DOW JONES INDUSTRIAL (DJI) Technical Analysis:
In the 15-minute timeframe, Dow Jones Industrial (DJI) has signaled a fresh long trade entry at 42,406.00 with potential upside movement, supported by the break above the Risological dotted trendline.
Key Levels:
Entry: 42,406.00
Stop Loss (SL): 42,294.50
Target 1 (TP1): 42,543.81
Target 2 (TP2): 42,766.81
Target 3 (TP3): 42,989.81
Target 4 (TP4): 43,127.63
Observations:
The price has gained bullish momentum, with a clean break above the Risological trendline.
If momentum sustains, this trade could see all targets successfully hit.
A solid long trade entry is in play for DJI, with upside potential. The Risological dotted trendline serves as strong support, and if buyers maintain control, higher targets are likely to be reached.

DOW JONES (DJI) Slides Through TP1 & TP2! Eyes Set on TP3 & TP4!Technical Analysis:
On the 15-minute timeframe, the Dow Jones (DJI) short trade has already successfully hit TP1 and TP2, confirming strong downward momentum. Price continues to trade below the Risological dotted trendline, suggesting that the bearish trend is likely to continue.
Key Levels:
Entry: 42,997.92
Stop Loss (SL): 43,161.50
Target 1 (TP1): 42,795.74 (Done)
Target 2 (TP2): 42,468.58 (Done)
Target 3 (TP3): 42,141.42 (Pending)
Target 4 (TP4): 41,939.24 (Pending)
Observations:
After breaking below the Risological dotted trendline, the Dow Jones showed significant selling pressure.
Price continues to respect the downward trendline, supporting the case for further declines toward the remaining targets.
With TP1 and TP2 already hit, the Dow Jones looks primed to move towards TP3 and TP4. Traders should continue to monitor the bearish momentum as the setup points toward more downside potential.

Dow 30 Tanks! Short Trade Hits First Target – More Downside?The Dow 30 (DJIA) has shown significant bearish momentum, with the short trade reaching Take Profit 1 (TP1) at 42855.11.
Key Levels
Entry: 42975.00 – The short position was entered as the price broke below this level, indicating bearish sentiment.
Stop-Loss (SL): 43072.00 – Placed above recent resistance to protect against a potential price reversal.
Take Profit 1 (TP1): 42855.11 – The first target has already been reached, confirming the downward move.
Take Profit 2 (TP2): 42661.11 – The next target as the bearish trend continues.
Take Profit 3 (TP3): 42467.11 – A further target if selling pressure persists.
Take Profit 4 (TP4): 42347.22 – The ultimate profit target signaling a continued decline.
Trend Analysis
The price has dropped below the Risological Dotted trendline, confirming the strength of the bearish trend. With TP1 already hit, further downside potential is in play, with the price likely to test TP2 and beyond.
The short trade on the Dow 30 has successfully hit its first profit target, with further targets likely if the current bearish trend holds. The strong downward move suggests that TP2 and TP3 could be reached in the near term.

Dow Jones Hits All Targets! Bullish Surge CompletesThe Dow Jones has demonstrated a strong bullish trend, with the long trade reaching and completing all profit targets.
Key Levels
Entry: 42078.17 – The long position was entered as the price broke above this level, confirming bullish sentiment.
Stop-Loss (SL): 41954.95 – Positioned below recent support to manage risk in case of a pullback.
Take Profit 1 (TP1): 42230.47 – The first target was achieved, confirming the continuation of the upward trend.
Take Profit 2 (TP2): 42476.91 – The second target was hit as the bullish momentum continued.
Take Profit 3 (TP3): 42723.35 – Momentum carried the price to the third target.
Take Profit 4 (TP4): 42875.65 – The final profit target was reached, signaling a strong rally.
Trend Analysis
The price is comfortably trading above the Risological Dotted trendline, confirming the strength of the bullish momentum. With all targets hit, the trend continues to reflect a strong upward movement, supported by positive market sentiment.
The long trade on the Dow Jones successfully hit all profit targets, with the final TP4 at 42875.65 marking the end of a highly profitable trade. Strong support from the Risological Dotted trendline and continuous upward momentum suggest that the market is favoring bulls in this period.


Dow Jones: Potential Retracement After ConsolidatThe Dow Jones Industrial Average (US30) is showing signs of exhaustion after several days of consolidation between the 41,800 and 42,300 price levels. We are now observing a potential bearish setup that may lead to a retracement towards the 41,400–41,000 zone, aligning with the 0.5 Fibonacci level on the FibCloud indicator. If this scenario plays out, it could offer a solid short opportunity for traders looking to capitalize on this potential pullback. Monitoring key levels and price action will be crucial in managing this trade.
Technical Analysis:
• Price Action: The Dow has been trading within a narrow range, indicating indecision and a potential loss of bullish momentum. A break below the consolidation zone could trigger a downward move towards the 0.5 FibCloud level.
• FibCloud Indicator: The target zone between 41,400 and 41,000 aligns with the 0.5 Fibonacci retracement level, providing a strong confluence for a possible retracement.
• Support & Resistance Levels: The immediate support is at 41,800, and a break below this level could see the index testing the 41,400–41,000 zone. Resistance remains at 42,300, a break above which could invalidate the bearish setup.
• Volume & Momentum: Decreasing volume and fading bullish momentum suggest a potential reversal. Traders should watch for confirmation signals such as bearish candlestick patterns or a momentum shift.
Trade Setup:
• Entry: Consider entering a short position below the 42,260 support level with a strong bearish confirmation.
• The stop-loss is set at a 2:1 risk-reward ratio, with an SL at 42,695 and a TP at 41,400. If strong momentum develops, the target will be extended to the 41,000 price zone.
The Dow Jones is at a critical juncture, and the upcoming price action will provide more clarity on the next directional move. This setup offers a favorable risk-to-reward ratio for traders looking to position themselves for a potential retracement. Stay updated on economic releases and price action developments to manage this trade effectively.
Note: Please remember to adjust this trade idea according to your individual trading conditions, including position size, broker-specific price variations, and any relevant external factors. Every trader’s situation is unique, so it’s crucial to tailor your approach to your own risk tolerance and market environment.

US30 (Log Chart)- firstly i want to explain what is US30, you can google it :
- US30 is a stock market index designed to measure the performance of 30 large industrial companies based on the average stock price of the components "during a specified period".
- So basically...when u have a Top30, if one company fail, this company is replaced by number 31.
- it's same in football or tennis, if you are in the top30 and u fail to win, you lose your rank and down to 31 right? Then u are not in Top30 anymore ?
- So you are replaced in the Top30 list (but sport is not a Ponzi, it's a real effort to be on the Top of the chain).
- Just made this text to explain how a big Ponzi works.
- Companies in US30 are not Ponzi because they work hard to stay in the Top30.
- but in matter of " Efforts", if you have the power to create your own money, you can do everything, and also buy your own stocks.
- Hope u get it.
- So when i read some peoples speak Bitcoin is a Ponzi, it makes me smile.
- it's clear that they didn't read at all Satoshi's White paper, or they are hypocritical.
--------------------------------------------------------------------------------------------------------------------------------------
- Thirteen years ago today, Satoshi released the Bitcoin genesis block - block 0.
- Embedded in it was a quote, “The Times 03/Jan/2009 Chancellor on brink of second bailout for banks".
--------------------------------------------------------------------------------------------------------------------------------------
To be a precursor, you need to know the future, Satoshi knew the future.
--------------------------------------------------------------------------------------------------------------------------------------
- So let's back to the chart :
- from 2009 to 2020. 11 years. DowJones was just perma bullish all the time with some small ridiculous dips.
- you can see how US30 Reacted during Covid worst pandemic situation in the world.
- after a fast dip in 2020 caused by Covid news.
- US30 went up for 672 days ( annotated in chart ) during a 2 years frustrating and painful lockdown.
- so it means those Top30 companies weren't affected by this pandemic situation.
- Really Weird.
- Actually imho, i think they were just preparing the actual dip, but this is just my own view.
- honestly, i just hope my US30 analysis fails.
- it would means that this time, governments are starting to be honest.
Happy Tr4Ding !
