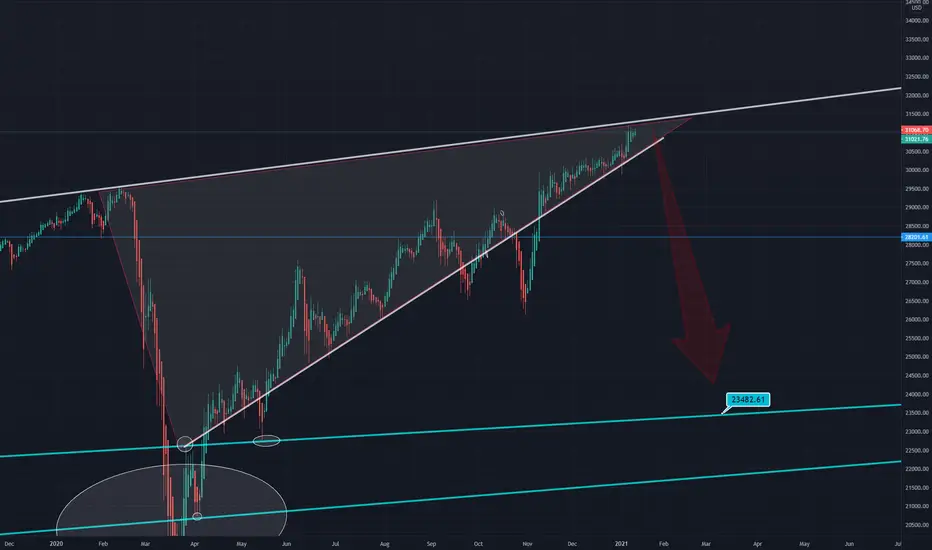
DOW Update 1st of February 2021 Greetings all,
The chart i am posting here is very basic analysis - as you can see, there is no major complicated technical analysis going on here (that is for sure). However, i thought i would share what i see (based on the daily time frame).
I am looking forward to seeing if support here holds (or not).
Best wishes and stay safe.
bazzman78tv
Dowjonesindustrial

US30 REBOUND EXPECTED AS PER NEW CHANNEL 4h DOWJONES INDUSTRIALUS30 REBOUND EXPECTED AS PER NEW CHANNEL 4h DOWJONES INDUSTRIAL

DJIA - SHORT; On its way to test the pandemic lows?!Likely!
As it happens, the Dow's trajectory is in perfect agreement with the Gold / Copper Ratio's price level projection!
Pure coincidence??... Not likely.
Here is that "famed" ratio (... and Yes, it still does work!);


Dow Tech Idea I think, the market break the pattern then start bull runs above the pattern.
So guys, we are Let's see🙄

YM30 Dowjones industrial average LONG signalSpiking channel breakout , (FLAG) . Pretty easy to see..

DOW - Increased chances for a correctionOur updated charts.
Lot's of fundamental analysis in the background (CPI coming up)
Dow Jones , just some information I am not a pro in other markets than crypto. But I expect a crisis in 2021 or 2022 at the latest, currently clear signs of a bubble (Tesla) that has to burst.


US30USD 2021 Jan 06 Midweek Update
US30USD 2021 Jan 04 Week
Per analysis over the weekend on weakness appearing, market has showed its intention, seeing
a magnificent sell on 04 Jan, presenting buy opportunities.
This looks like a re-accumulation
Resistant3 = 30934
Resistant2 = 30800 - 30825
Resistant1 = 30622 - 06662
Support1 = 29893 - 30003
Support2 = 29420 - 29465
Hit the LIKE button if you find this useful. OANDA:US30USD

DJI 90 year-old Dow Jones index hints at correctionGlobally, Dow Jones industrial index has been on the growth for almost 90 years since the Great Depression.
Ironically, World War II launched an industrial boom in the United States that pushed the index up.
It took 30 years and increase in 10 times of the DJI value before a more or less significant correction took place in 1973 , and the oil crisis can be called the main driver.
The next corrections came again 30 years later: the crash of the Dotcoms of the 00s and the financial crisis of 2008-2009 , which should already be in the minds of most readers.
And now, not a simple 2020, closed with the Japanese candle "hanging man" , which can be regarded as the first bearish signal.
The collapse of the index in the spring 2020 through the first wave of coronavirus, and then its rapid growth amid subsidies to the population and the economy, formed a large shadow under the body of the candle.
How long will the economy be supported by the US printing press, will vaccination have an effect, or maybe something else will happen, we do not know...
But according to candle analysis, if the next candle behind the Hangman opens lower , then many traders may want to consider selling.
It's very interesting how the trades will open in 2021!
You will say that journalists refer more to the DJI index , and traders are guided by the S&P 500 (by the way, Tesla shares were added to the index a week ago) and you will probably be right. The Dow index has been calculated since the 19th century and is historically very important, but in 1957 appeared a competitor S&P 500.
All the same, the S&P 500 index, which includes the value of shares of 500 companies, more realistically shows the mood of the modern market than the Dow Jones industrial index, which includes only 30 companies.
We have added the S&P 500 to the chart below and what do we see? Another "hanging man" or Hangman.
By the way, it's not bad enough, historically they work out Fibo levels on the indices , everyone can find something that he likes.
Write in the comments, your expectations for 2021

US30 technical and fundamental correction.US30 has to make a correction before moving upwards again. My target is 28122. Good luck!

Dow Jones: Awaiting Confirmation for Diagonal PatternIn the 240-minute chart, the Diagonal pattern is formed in the V wave, to get the confirmation for the downtrend as well as this pattern, the price needs to cross the range of 29722. The initial target of this downtrend is around 28900 area, (according to the Diagonal pattern target)

DOW Trading Under ATH | New Years WedgeAfter seeing the DOW hit ATH last week, it looks like it could continue sideways for the next week or so as we approach the holiday season.
I'm watching $29,820 as weekly support and $29568 as Monthly support. Looking toward the upside, we've tested the $30,325 range as ATH twice in the last week, confirming it as a strong level of resistance. I'll be watching this wedge moving into the week as we watch for a breakout.
As the vaccine is distributed nationally and globally, we could aim to expect a continuation up that is unless we see negative news about this pandemic or vaccine. We also need to remember that Biden will be making his transition into the White House on January 20th, 2021.
God Bless America


DOW JONES INDUSTRIALS PREPARING FOR A BIG MOVE UP?decision zone.
breakup can be very agressive.
stop > if breaks down & daily closes.

HOW TO TRADE THE DOW-JONES(US30) INDUSTRIAL PROFITABLY.IN THIS VIDEO, I EXPLAIN MY METHOD OF TRADING THE US30 AND HOW TO PREVENT BEING VICTIM TO FAKEOUTS TO THE DOWNSIDE, USING FIB-RETRACEMENTS AND THE PARABOLIC SAR INDICATOR.
US30 IS NOW AT AN ALL-TIME HIGH, AND AS THE PERFECT INVESTORS STATE "BUY LOW SELL HIGH" , PLEASE LET ME KNOW WHAT YOU THINK OF MY ANALYSIS IN THE COMMENT SECTION AND LEAVE A LIKE.
INDICATORS USED FOR TRADING US30
> PARABOLIC SAR FOR CONFIRMATION
> MACD FOR TREND REVERSAL
> MOMENTUM FOR KNOWLEDGE OF WHEN TO ENTER
> RSI TO SPOT REVERSALS
> FIB RETRACEMENTS TO PREVENT FALLING FOR "FAKE-OUTS"
> STOCHASTIC OSCILLATOR TO SPOT TREND REVERSALS
IF YOU ARE NEW TO TRADING THE US30, PLEASE BACKTEST THIS STRATEGY USING A DEMO-ACCOUNT!
THANK< AND DROP A FOLLOW FOR FURTHER ANALYSIS.

US30 07/28/2020Trading the US30 market this week might be a little tricky but here is my personal opinion of what I think the market will do.
I see a new resistance area forming around 26725 and that leaves a possibility of the market breaking the channel's support area at 26393 and being Bearish down till 26093 (which will be my Stop Loss for this trade) before the bulls try to buy back into the market and push price up.
Personally, I believe that if this happens then it is only a short reversal as I expect Price to break the 26725 resistance area and go Long till 26892 which will be my Take Profit 1 and also a possible future resistance area . I'm going to Close some positions in Profit at that point and continue to ride the Uptrend through the Consolidation at Take Profit 1's resistance area until it breaks and shoots up to 27170 which will be my Take Profit 2 .
I expect the resistance at 27170 to be quite strong but I also plan to Hodl some position through it because I believe Price may still go up to 27546 which will be my Take Profit 3 for this trade.
Warning!!!
US30 is a very volatile and shifty market and may no go according to analysis. Please stay away from this trade if you're a new trader or your account doesn't have large enough equity to handle draw-downs or losses on this trade. This is my personal opinion on the market behavior and what I think will happen in the future for the particular market and is only shared for educational purposes. I recommend you always back-test before taking any trades given through analysis, always re-analyse to reduce your chances of losing a trade. Also, make sure to use appropriate lot size recommended for your account and equity size. Good Luck!

US30 Long 12/09/2020I expect to see a pushback to the resistance area and see price break through the consolidation to go for a long. This is my personal belief for what I believe the market will do, kindly double check and re-analyze before taking a trade with this analysis. And be careful with Volatile Markets. Good Luck!


DOW JONES LONG TERM - LONG TERMI think the US30 still has a great upside to complete its wave five.
Please leave a like or share your ideas below.

DOWJones Next week!Dow Jones is looking Bullish for next week so lets all get to it! :) Have a great week all!
