Dowjonesindustrial

Dow Sell position active. Target down to 24k area where we seeDow Sell position active. Target down to 24k area where we see I have been playing harmonic setups, Dow short sell downto 24k would be nice for a stop and reverse last one worked well as it approaches a double 76.8% support area. Current trade I have a hard stop above 27150 incase some spike before heading my work... R.R makes sense for allowing for such r.r (for me). any way this is my own drivvle and dont expect anyone to follow my stupid advice!! to be reading it just my own opinions of lines on screens


US30 19/07/2020 for 20/07/2020... There are various ways our Trading week could start for US30.
My analysis would be that we could see a possible rise of US30 over the weekend and then have a retest when the market open on Monday 20/07/2020. I think US30 will be in consolidation through the evenings on Sunday 19/07/2020 when the market opens because the sellers will get in and try to push price down.
Personally I'll stay away from the market through the storm on Monday morning and look for a good opportunity to get back in Long if the market happened to dip over the weekend, I think the Bulls have the Potential to push the market through to 27500 but for now we are definitely going to experience some Storm at this Major area of resistance.
For those who held their positions through the weekend, I believe price is going to climb to 26904 in about 7hrs from our Week's closing point 26635 which will serve as my new Entry for this analysis. That will be my Take Profit 1 closing 264 pips but you can also choose to keep your Take Profit at 26980 for 334 pips.
I don't expect to see a clean break so I'm going to hodl my second position through the possible retest to our Entry point at 26635 and the consolidation at the 26980 (TP) area which may last for about 3 hrs. Then I expect to see a quick rise to my second Take Profit at 27165 closing 185pips in less than 3hrs. Leaving the total trade time to approximately 15hrs and closing 500+ pips in total by my analysis.
As we know, US30 is very shifty and volatile. Market may drop to 26635 for a retest which will be a very sensitive area because the Bears might win a temporary break and pull price further down to 26380 which I intend to Hodl through if this happens, for this reason I've set my Stop Loss to 26194.
I advice you to trade with caution. Use proper risk management of not more than 2% and avoid Greed. Secure positions half way in profit and if your equity is frail please either stay away or trail. I personally recommend new traders and low equity traders to stay away from the market until the calm at about after Lunch hour on Monday.

US30 Intraday - High volatility today Expected red gapup openingUS30 Intraday - High volatility today - Expected gapup opening
BEARISH DIVERGENCE: DOW and 10-day SMA of CBOE PUT-CALL RATIOThe plot of the 10-day SMA (Simple Moving Average) of the INVERTED CBOE TOTAL PUT-to-CALL Ratio against the TVC:DJI - Dow Jones Industrial Average.
We can see that from the all time Highs back in Feb to the latest lower highs, the 10-day SMA of the INVERTED PUT-to-CALL Ratio keeps making higher highs even though the Dow is making lower highs.
The higher the INVERTED Put-to-Call ratio goes it is indicative of more Calls being bought for every Put being bought.
We note that bullish sentiment has reached extremes not reached in almost 20 years----- EVEN THOUGH THE DOW PRICE keeps making lower highs.
This is indicative of bullish sentiment extremes that is a contrarian indicator pointing to lower prices ahead for the Dow and the end of the Bear market rally (from the March lows) being close at hand.
I believe the Dow's Bear Market rally ended on June 8th.
Since then we have had one wave 1 from June 8th to June 15 and since then have traced out a 3-wave ABC corrective wave 2 retracement which should be either at an end or will be at an end with another minor high in the next 1-3 trading days.
Risk-Reward favors a change in trend due to such Bullish sentiment extremes and the safer trade is the SHORT side.
Cheers!
Cyrus

Dow Jones US30 Long term ( My idea) i think Dow jones Bullish target about 37000 idk how xD but lets see my target on chart now
Use Risk management i prefer black line price line :)
- Volume
-Trend analysis

SP500 still has room to the upside before declineNot much has changed in the stock market. We are still in the same range. Based on the rejection we got last week, we can expect SP500 to test 32xx range (possibly even higher to form a double top near 3400). Advanced Decline Line broke higher than it was at the beginning of this year. That is bullish for the short-term. Based on cycles, we can expect trend reversal to the downside after July 20. Intraday trading is still the best idea for SP500 traders.

DJI down to 24202DJI just broke down the 25800 level which is a strong one especially after going sideways since mid-June, all of this will probably lead to more sell-offs in the upcoming sessions.
This's purely from a technical point of view, but yet this assessment is also heavily supported by earnings session that's about to hit.
A rally is probable after hitting the target of 24202. and that's IF it did.

#DJIA #DOW #DOWJONES 30 #Short #BearishShark #HarmonicPatternA bearish shark pattern seems to be maturing on the 30 minute chart.
Entry @pprox 26287.42
T.P. 1 @pprox 25957.00
T.P. 2 @pprox 25619.46
S.L. @pprox 26389.64


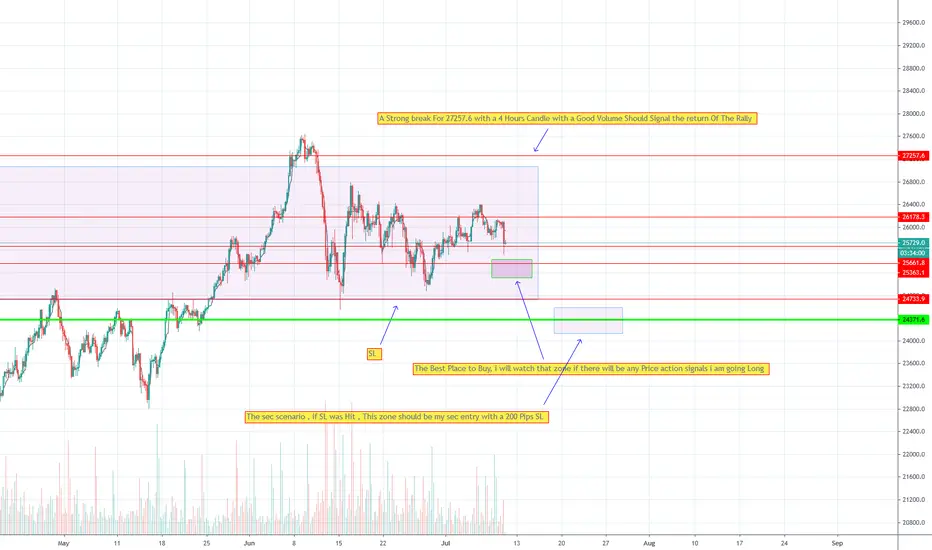
DJ30 Long Idea , Zones analysisWhen Technical Analysis Says Start Worrying and go short there where you shoud be smart and find Zones where big Players are waiting to buy .
Good Luck .
Dow Jones Bearish Setupif we see breakdown than price almost retest at the breakdown and going down is actual low coming

US30 BUYHello traders! US30 is ready to hit 26300. Its a very nice 300 points Target. Set stop loss below support.
This is same strategy that i am using for GOLD, I hope it will also give promising result like Gold.
Don't Forget to Hit the like button if you find it helpful and informative and follow to catch every wave correctly and remember to share ideas.
Previous analysis

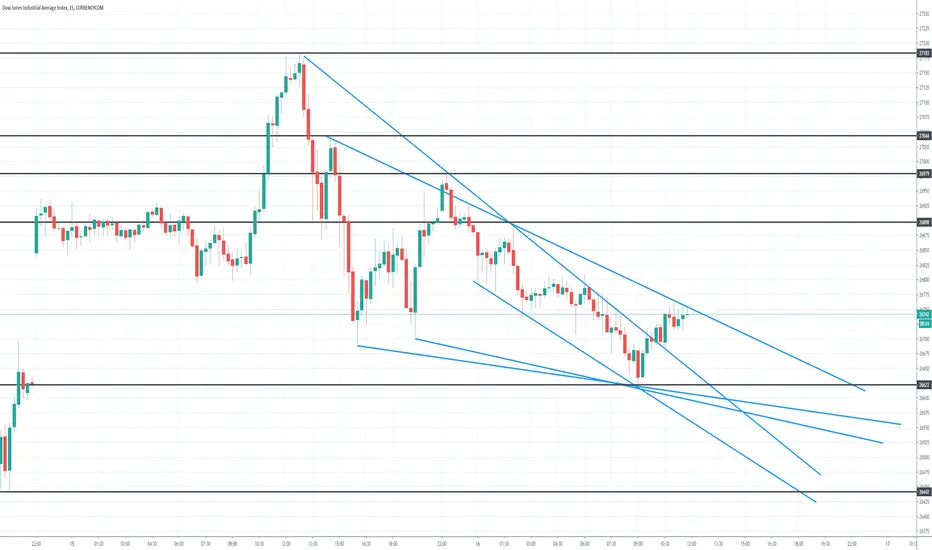
US30 INTRADAY SIMPLE 15MIN CHART -Follow trend-line and breakoutUS30 INTRADAY SIMPLE 15MIN CHART , Follow trend-line and breakout - Happy Trading...!!!

DOW 15MIN TIME FRAMEHello traders, here is the analysis from our team :
We need a pullback above 25945 before entry.
Let us know in the comment section below if you have any questions.😉

Dow Jones (DJIA) - Levels of ReferenceTVC:DJI in a slight downtrend but taking support from fib region.

Dow Futures: Strong Move to Open Sunday: Eyeing $26,000Will look at a scalp long if $26,005 breaks will layer profits in from 50 to 200 points as there was a strong move opening up on Sunday.
I have stop/buys orders in place. Please keep in mind this is not a long and my order will not be executed until $26,005 breaks (if it never does that is ok) I will cancel my order.
About me:
I keep trading as simple as possible. Will not give my method but will give you entries.
Don't get greedy. Take profits quick when in green.
Let's make money together!

US30 shortDow Jones Industrial Average Index - US30- For short ..TP1 and TP2 are the yellow levels..SL UP the red trend..

Dow Jones US Stock Market (Is US-China trade deal over?)View On Dow Jones US Stock Market (23 June 2020)
Is US-China trade deal over?
It doesn't really matter. Market Makers will eat retail traders anyway.
Why? It is because retail traders usually buy into a pipe dream such as 1:5 Risk: Reward ratio with 30 pips SL in the hope to get 150 pips TP.
This is exactly just happened. The Market just made a blip on the early Asian session to eat both long and short positions with tight stop loss (SL).
The Morale of the story: Always Watch You Risk Management and Trade Expectation.
As for Dow Jones, I see 25k as good support while 26300 as a good resistant.
We shall see more movement as the week develops.
Let's see.
DYODD, all the best and read the disclaimer too.
Feel Free to "Follow", press "LIKE" "Comment".
Thank You!
Legal Risk Disclosure:
Trading foreign exchange or CFD on margin carries a high level of risk, and may not be suitable for all investors.
The high degree of leverage can work against you as well as for you.
Before deciding to trade foreign exchange you should carefully consider your investment objectives, level of experience and risk appetite.
The possibility exists that you could sustain a loss of some or all of your initial investment and therefore you should not invest money that you cannot afford to lose. You should be aware of all the risks associated with foreign exchange trading, and seek advice from an independent financial advisor.
DISCLAIMER:
Any opinions, news, research, analyses, prices or other information discussed in this presentation or linked to from this presentation are provided as general market commentary and do not constitute investment advice.
Sonicr Mastery Team does not accept liability for any loss or damage, including without limitation to, any loss of profit, which may arise directly or indirectly from use of or reliance on such information.

