DOW JONES hit its 1W MA50, 1st time since the U.S. elections!DJIA hit the 1W MA50 (red trend-line) for the first time since November 02 2020 and the U.S. elections. At the time, this was the final bottom of the post COVID Channel Up, the index never saw this level again and the strong 2021 rally started.
Besides the 1W MA50, Dow also made a direct hit on the Higher Lows (bottom) trend-line of the long-term Channel Up that started early in 2021. The 1D RSI also just entered its long-term Support Zone, which provided 3 out of 3 accurate buy signals before.
As long as this pattern holds, the next long-term target and Higher High for Dow Jones is the 1.236 Fibonacci extension (TP just below at 37000).
--------------------------------------------------------------------------------------------------------
** Please support this idea with your likes and comments, it is the best way to keep it relevant and support me. **
--------------------------------------------------------------------------------------------------------
Dowjonessignals

Dow Jones analysis As I mentioned in previous chart of DJI closing below 36000 will trigger strong selling.
You can see in the current chart that the index treded multiple time below 36000 but did not close even a single day.
Just wait for one closing below 36000 and get ready for a big red candle.

DOW JONES on the short-term buy zoneDow hit today the 1D MA50 (blue trend-line) for the first time since December 22. Within the 2021 Channel Up, this is a symmetrical support level both on RSI terms and from a price perspective with the Support Zone being within the 1D MA50 and the 1D MA100 (green trend-line). The sequence resembles a lot the July 08 - 19 fractal. The bottom was achieved exactly when the Ichimoku Cloud started to squeeze. I treat this as a short-term buy opportunity with a 37100 Target (0.236 Fibonacci extension).
--------------------------------------------------------------------------------------------------------
** Please support this idea with your likes and comments, it is the best way to keep it relevant and support me. **
--------------------------------------------------------------------------------------------------------

Dow Jones (Over Bought) Shorting chance Jan 2021Hi
This index seems to be over bought to us as it is recovering from the Corona pandemic Crisis and the way it has rallied, we may have a chance to short it at its correction or so called retracement.
we can see bearish divergence of Price and MACD and combining this flow with Price Action Analysis it gives us more confluences of a down fall and a trend reversal or at least a retracement or market correction
we have specified some support levels which can be used as some target areas and some trend lines as the most fall levels
truly speaking we don't have any concrete fundamental reasoning behind such a fall but some how we can relate it to the upcoming chaos in the USA political and FinTech industry and giant MNCs who can be an other reason for an other crisis...
please bring some reasoning for this fall if you have any in mind...

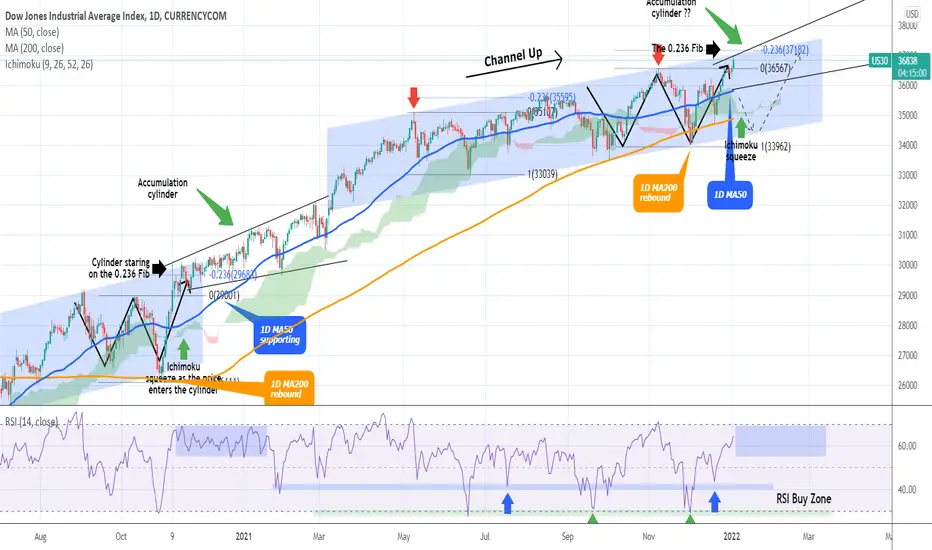
DOW JONES could enter an accumulation cylinder if the MA50 holdsEverything went according to plan since my last update on Dow Jones as we accurately caught the December 20 bottom and today the 37000 target has been almost hit, so it might be a could idea to book medium-term profits:
I have to update our outlook now as a new pattern may emerge as per the late 2020 price action. That is an Accumulation Cylinder (as per Livermore's speculative model) that technically leads to a new High. The technical condition for this to arise is for the 1D MA50 to hold. In fact there are so far many similarities with November 09 2020, which was when the last Accumulation Cylinder took place:
a) The price is near the 0.236 Fibonacci extension. It was at that level that the rise stopped, the price took a relief break but the 1D MA50 held and the cylinder started.
b) The Ichimoku Cloud squeezed right before the Cylinder started.
c) Both rises that preceded the Cylinder started on a 1D MA200 (orange trend-line) rebound
d) Both were at the end of a long-term Channel Up.
e) The sequence that completed the Channel Up and started the Cylinder was a Zig Zag Higher Highs/ Higher Lows displayed by the bold black arrow.
On the other hand, if the 1D MA50 fails, we should most likely see an extension of the Channel Up. In that case Dow should hit at least the 1D MA200. Basically the most optimal buy entry in the past 6 months within the Channel Up has been the 1D RSI's Buy Zone (green zone).
--------------------------------------------------------------------------------------------------------
** Please support this idea with your likes and comments, it is the best way to keep it relevant and support me. **
--------------------------------------------------------------------------------------------------------
DOW JONES hit the 1D MA200. Buy fractal spotted.Dow Jones has had a very sharp two-day pull-back, which hit today the 1D MA200 (orange-trend-line). That came off an Inverse Head and Shoulders pattern (IH&S) that continues to resemble that of June - July. With the 1D RSI hitting the Symmetrical Support level of the July 19 low which initiated the strong rebound to the 0.236 Fibonacci extension, I expect the same sequence to be replicated and hit 37000 by the end of next month.
--------------------------------------------------------------------------------------------------------
** Please support this idea with your likes and comments, it is the best way to keep it relevant and support me. **
--------------------------------------------------------------------------------------------------------


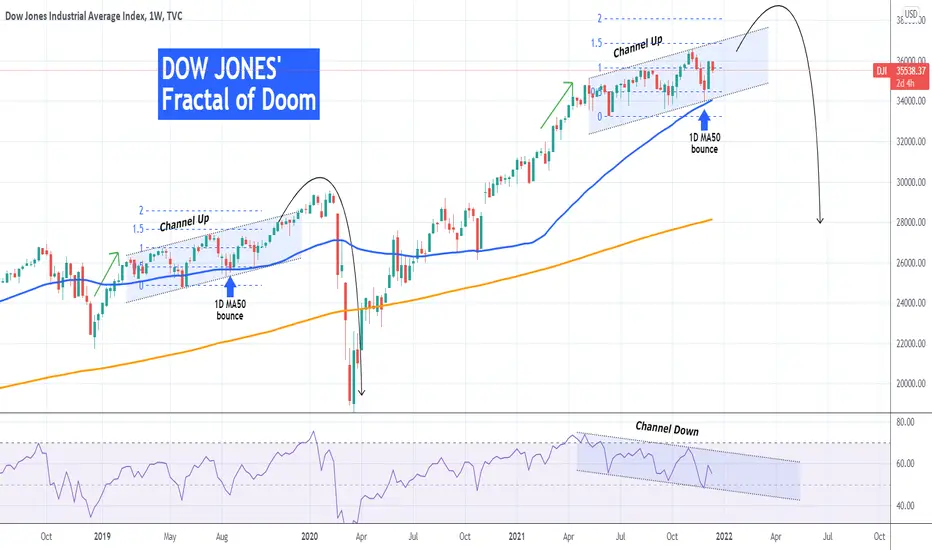
DOW JONES and the fractal of DOOM it should avoidDow Jones has been trading inside a Channel Up since the Q2 of 2021 a time during which I have been bullish buying every Higher Low within the pattern. This hasn't changed, especially after it recently made a strong rebound exactly on the 1W MA50 (blue trend-line), which during long-term uptrends is typically the major Support.
However with this analysis I want to bring to your attention, a technical possibility based on the charts, which shows that DJI's long-term bullish trend may not have more than another quarter left before a major correction occurs.
As you see on this chart, which is on the 1W (weekly) time-frame, while the index has been on this Channel Up (Higher Lows and Higher Highs), its very RSI indicator has been trading on a Channel Down (Lower Highs and Lower Lows) for the same time-span. This constitutes a Bearish Divergence and technically indicates that the dominant trend (i.e. the uptrend) has been losing its earlier strength.
Now we come to the major part of the analysis. On top of that Bearish Divergence, which is alarming on its own, the last time a similar Channel Up has been spotted was from February to November 2019. As you see there is almost a perfect symmetry between the two both in terms of the Fibonacci retrace and extension levels, as well as the bounce on the 1D MA50 and below the 0.5 Fib at the exact same spot on the Channel Up pattern.
This correlation suggests that, assuming the pattern replicates almost the same way, when the Channel Up breaks to the upside (i.e. above its top/ Higher Highs trend-line), a top might form soon after (a month or so), and as the index will get massively overbought, a sharp quarterly correction may follow. Now of course back in Feb-March 2020 the sole driver/ catalyst behind this massive correction was the COVID pandemic outbreak and an event like that can't be repeated that soon, however the markets tend to find and capitalize on any fundamental catalyst they can find at a given time in order to fulfil a long-term re-occurring pattern.
What do you think? Should this ring a bell early on for the global stock markets or not?
--------------------------------------------------------------------------------------------------------
** Please support this idea with your likes and comments, it is the best way to keep it relevant and support me. **
--------------------------------------------------------------------------------------------------------
DOW JONES may give more buy opportunities on this patternThis is an update to my most recent Dow Jones idea that gave the buy signal on the bottom of the Channel Up a week ago:
The index has been rallying aggressively since then and now faces the first important Resistance (black dashed line). This may be an Inverse Head and Shoulders pattern similar to the June one. That has given two buy opportunities on the 1D MA50 (blue trend-line)/ 0.5 Fibonacci retracement level and the 0.618 Fibonacci retracement level before the final rally of that phase towards the 0.236 Fibonacci extension.
If you didn't catch the bottom buy already, be on the look out for those potential buy opportunities.
--------------------------------------------------------------------------------------------------------
** Please support this idea with your likes and comments, it is the best way to keep it relevant and support me. **
--------------------------------------------------------------------------------------------------------
Dow Jones: Lowwwww!❎❎❎For a moment, the Dow looked like it was serious about rising again. However with the current movement, the course is developing in our predicted direction. We expect the course to turn around at 33518 points and surge again. An alternative breakout has a probability of 35%.
Happy weekend!

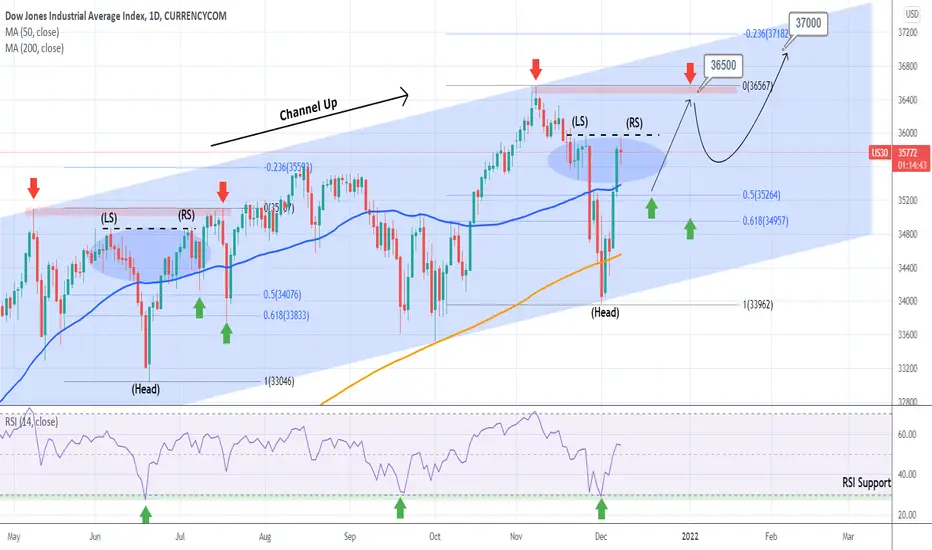
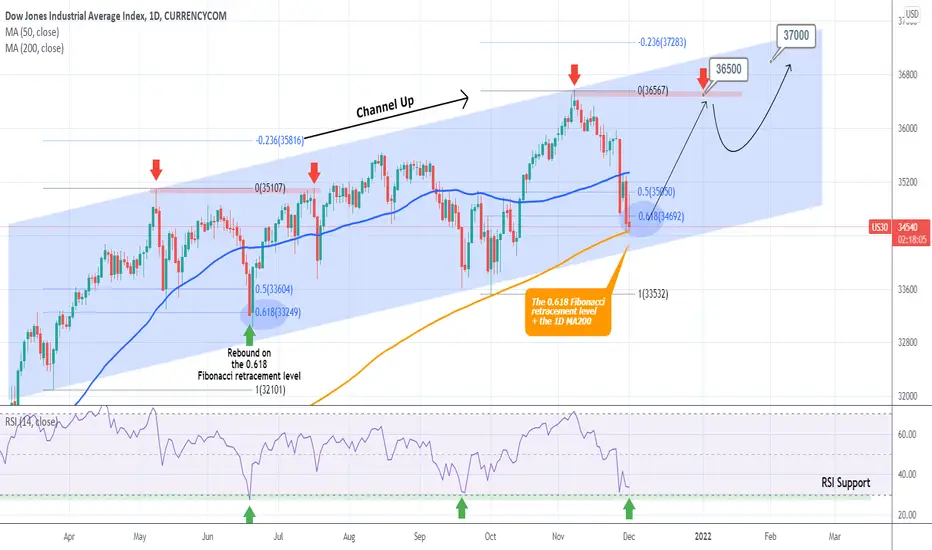
DOW JONES Buy opportunity on the 1D MA200 and 0.618 FibPattern: Channel Up on 1D.
Signal: Buy as the price reached both the 0.618 Fibonacci retracement level as well as the 1D MA200 (orange trend-line). The last parameter to fulfil is the RSI Support, so allow margin for one last low at the bottom of the Channel Up.
Target: 36500 (Resistance and All Time High) and 37000 in extension (Higher High of the Channel Up).
--------------------------------------------------------------------------------------------------------
** Please support this idea with your likes and comments, it is the best way to keep it relevant and support me. **
--------------------------------------------------------------------------------------------------------
DOW JONES approaching the 1D MA50Following the new top on the Higher Highs trend-line of the multi-month Channel Up, the index got rejected and has been pulling back since. It is approaching the 1D MA50 (blue trend-line) which serves as a technical medium-term Support. If it holds then I expect a strong rally towards the 0.236 Fibonacci extension setting a personal target at 37000. See how the 1D RSI is also near its multi-month Symmetrical Support.
--------------------------------------------------------------------------------------------------------
** Please support this idea with your likes and comments, it is the best way to keep it relevant and support me. **
--------------------------------------------------------------------------------------------------------

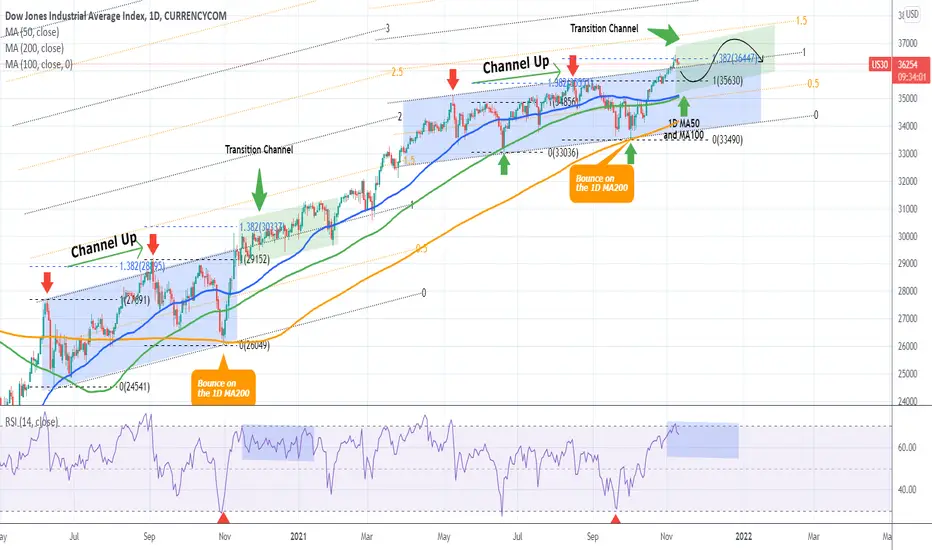
DOW JONES entering a transition Channel as in late 2020.This is not the first time I bring forward the ideal of Dow Jones following this 2020 fractal:
As you see from my October 01 idea above, this fractal comparison accurately projected the bottom of the Channel Up (blue) and the subsequent rally that followed. This time I am expanding this idea on the Fibonacci scale, as DJI broke above the Channel Up and hit the 1.382 Fibonacci extension from the bottom.
On November 09 2020, the price also broke above its Channel Up (blue), hit the 1.382 Fib extension and then entered a new (green) Channel Up, which I call transitional as it took the index from the first Channel Up (blue) towards the higher extension levels of the Fibonacci Channel in early 2021.
During that time the RSI (always on the 1D time-frame) turned sideways, indicating this Transition phase more clearly. I am expecting a similar process until the end of the year, meaning a pull-back towards the 1D MA50 (blue trend-line) is possible but as long as it supports, we are more likely to see prices above 37000 at the end of the year.
--------------------------------------------------------------------------------------------------------
Please like, subscribe and share your ideas and charts with the community!
--------------------------------------------------------------------------------------------------------
Dow Jones: Rock'N'Roll 🤘🤘🤘The Dow Jones is extending its gains and solidifies its position north of the mark at 35777 points. The index should not cross this line - for now. In total, we expect the course to further increase and reach areas above 36958 points. After that, we expect a fall towards 35822 points.
Happy trading!

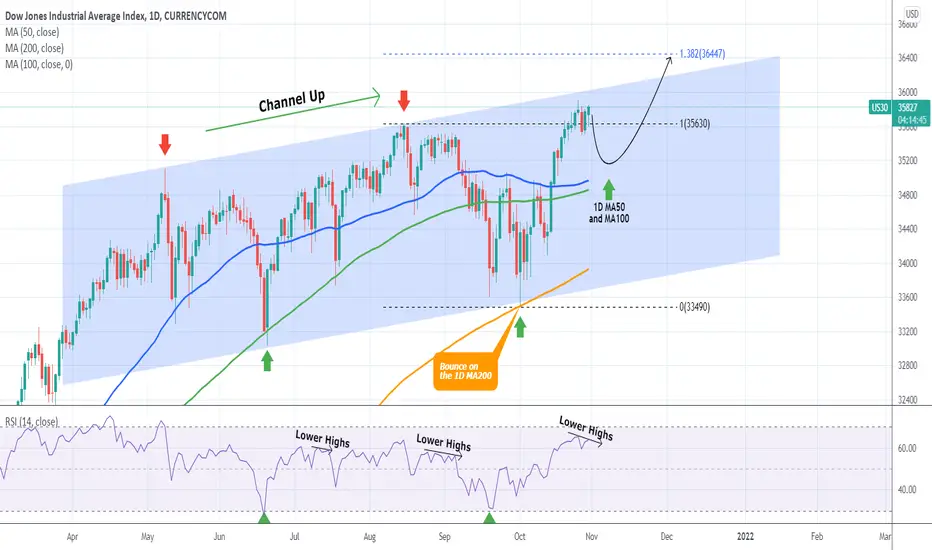
DOW JONES Top of the Channel Up. Pull-back possible.It's been a while since I updated my Dow Jones thesis. The most recent one (Oct 13) was on the short-term 4H time-frame, where I identified a buy signal on this Inverse Head and Shoulders pattern:
The longer-term one though was last updated on October 1 and this is where I come back to today as well:
As you see, the bounce on the 1D MA200 gave a perfect bottom buy signal and the 35900 target has been achieved. Even though the long-term target is the 1.382 Fibonacci extension (36,450), the price is trading very close to the Channel Up with the 1D RSI on Lower Highs. This RSI formation has been recently seen on tops with the price correcting afterwards to the 1D MA50 (blue trend-line) and the 1D MA100 (green trend-line). On this index, it is best to wait for such contact before targeting the eventual 1.382 Fib extension.
--------------------------------------------------------------------------------------------------------
Please like, subscribe and share your ideas and charts with the community!
--------------------------------------------------------------------------------------------------------
Dow Jones: Good Boy! 🐶🐶🐶The Dow Jones has been a very good boy ever since the low of the yellow wave 2. Currently, the surge should continue until somewhere around 35822 points. After completing a small correction, we expect the course to increase once again.
Push it to the limit!

DOW JONES Buy SignalPattern: Inverse Head and Shoulders on 4H.
Signal: Buy as the price is close to completing the Right Shoulder and is on the 0.382 Fibonacci retracement level.
Target: 34700 which is the 0.786 Fibonacci retracement level just below the Lower Highs trend-line.
--------------------------------------------------------------------------------------------------------
** Please support this idea with your likes and comments, it is the best way to keep it relevant and support me. **
--------------------------------------------------------------------------------------------------------

Dow Jones bullish or bearish ?Dow Jones have to break 35044 to make sure back on bullish track. but, it seems like not today for bullish. today candles close made sandwich bearish candles.

DOW JONES hit 1DMA200 for the 1st time since the US elections!Dow Jones is trading within a Channel Up that reached today its Higher Lows trend-line (bottom). But perhaps the most important development is that in doing so, it hit the 1D MA200 (orange trend-line) for the first time since October 30 2020 (the U.S. elections)! That alone is a strong buy signal itself but consider also the following:
* The RSI bounced on the 30.000 level on September 20 which has marked price bottoms on June 18 2021, October 29 2020 (in the post COVID crash era). Also it has been rising since on Higher Lows.
* The pattern resembles the June - October 2020 Channel Up. The price hit the 1D MA50 (blue trend-line), 1D MA100 and 1D MA200 in the same order and manner.
Based on the Fibonacci extension model, I am setting a target at 35900 by late October - early November.
** Please support this idea with your likes and comments, it is the best way to keep it relevant and support me. **
--------------------------------------------------------------------------------------------------------
!! Donations via TradingView coins also help me a great deal at posting more free trading content and signals here !!
🎉 👍 Shout-out to TradingShot's 💰 top TradingView Coin donor 💰 this week ==> Vergnes
--------------------------------------------------------------------------------------------------------

Dow Jones: Good Boy! 😎😎😎Who is a good boy? The Dow Jones is! Here, the top was perfectly hit and the following correction also evolves as planned – so far. We expect the course to drop below 34034 points and then attack new all-time highs.
Let’s gooooo!

Dow Jones Index completed its 5% correctionDow Jones broke the first main support line on 34600 and reached to the second one on (33600-33700) zone. Touched it two times but didn't break it.
35600 was the highest point then it started its correction. It almost completed its 5% correction when touched 33600.
A strong bullish movement based on inflation rate, and monetary policies is most likely possible.

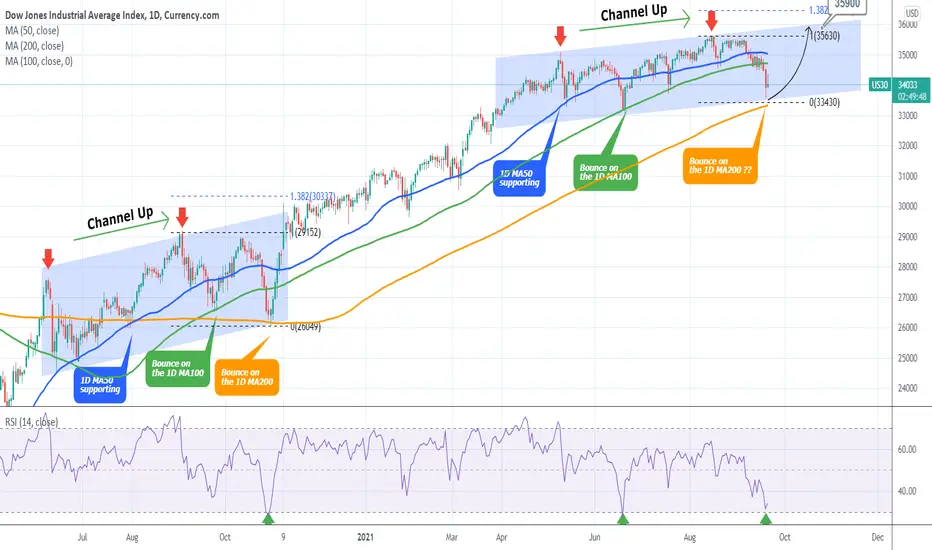
DOW JONES near the 1D MA200/ first time since October 2020!Dow Jones is trading within a Channel Up that has recently broken below the 1D MA100 (green trend-line). This is the first time in two months that is giving the first strong buy signals:
* The RSI is near the 30.000 level which has marked price bottoms on June 18 2021, October 29 2020 (in the post COVID crash era).
* The price is approaching the 1D MA200 (orange trend-line), with the last contact dating back to October 30 2020 (the line held and issued an aggressive rally post US-elections).
* The pattern resembles the June - October 2020 Channel Up. The price hit the 1D MA50 (blue trend-line), 1D MA100 and 1D MA200 in the same order and manner.
Naturally the market is waiting for Fed's confirmation tomorrow before it engages aggressively on high volume but this is the time technically to start considering a buy entry again. Based on the Fibonacci extension model, a target of 35900 seems very plausible.
** Please support this idea with your likes and comments, it is the best way to keep it relevant and support me. **
--------------------------------------------------------------------------------------------------------
!! Donations via TradingView coins also help me a great deal at posting more free trading content and signals here !!
🎉 👍 Shout-out to TradingShot's 💰 top TradingView Coin donor 💰 this week ==> Vergnes
--------------------------------------------------------------------------------------------------------
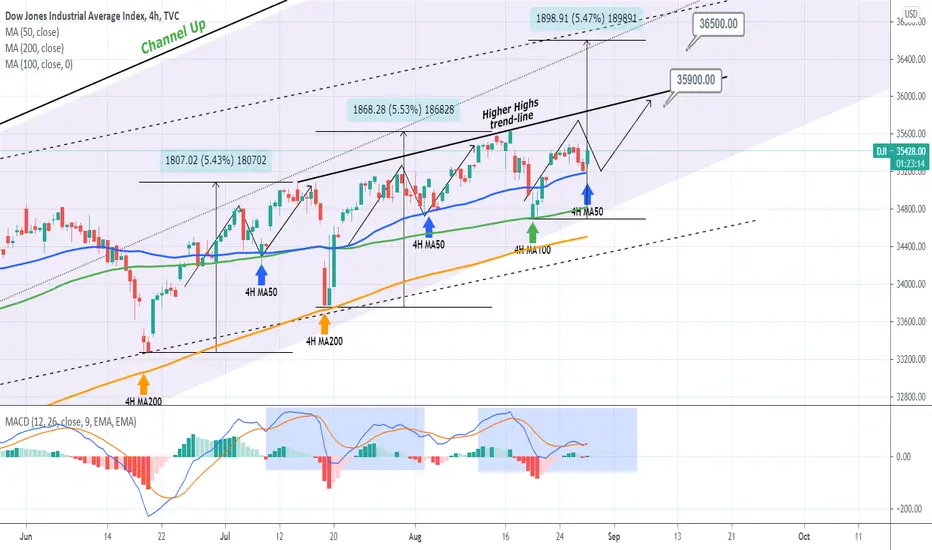
DOW JONES pattern to 36000Pattern: Channel Up on 4H.
Signal: Buy as the price made a rebound on the 4H MA50 (blue trend-line).
Target: 35900 lower risk (just below the Higher Highs trend-line) or 36500 higher risk (a roughly +5.50% extension top from the MA100 low).
** Please support this idea with your likes and comments, it is the best way to keep it relevant and support me. **
--------------------------------------------------------------------------------------------------------
!! Donations via TradingView coins also help me a great deal at posting more free trading content and signals here !!
🎉 👍 Shout-out to TradingShot's 💰 top TradingView Coin donor 💰 this week ==> nevada999
--------------------------------------------------------------------------------------------------------