NZDUSD Trend Continuation Trade 60We have entry signal on 60m timeframe: LLLC with RSI being overbought.
Nice downside potential of 100+ pips.
If I hit Target1 then I will trail stops to Target2.
Stop Loss is above resistance level of previous outside return.
Downside

Short on DXYShort on DXY. No faith in the USD. I personally think we are ready for the crash. Price action is indicating huge sells
on USD . Enjoy the fall :)
Risk Reward
Target 1: 1:1.25
Target 2: 1:2
Target 3: 1:3.8

Short on EURGBPI believe that we are temporarily bearish on EURGBP. We are not ready to fully decide whether or not to say that we are in a trend reversal, but
from what I see, it is a possibility. Price has been respecting the .8850 Montly Level/Resistance. If we break the strong level of .8750. We may be in
store to see a trend reversal. We've already broken the monthly and weekly ascending trend line so anything is possible. Targets are shown on chart.
Safe Trading
Risk Reward:
Target 1: 1:6
Target 2: 1:3.5

Short on EURGBPI Am short on EURGBP. I feel at the monthly level .8800, we have broken to the upside because of the false breakout due to news. To me that was just noise and manipulation, and we have broken back under monthly resistance. I got in last night but I am posting my current analysis and prediction on this pair.
Risk Reward
First Target: 1:2
Second Target: 1:5
I do believe we can come back to our second target.
-Trade Safe

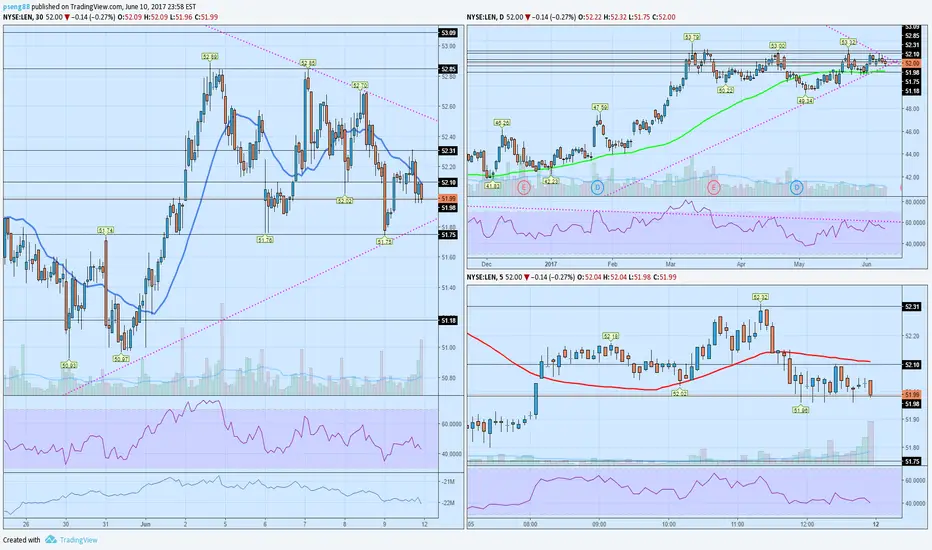
$len losing momentum/distribution higher time frame is showing range bound price action- negative divergence in rsi
closer look at mid time frame shows the transition from a range expansion to range contraction and selling volume pressure being applied along with negative momentum
lower time frame shows price action in that same range contraction apply pressure to the support area with multiple retest
looking for alignment across all timeframes to tilt to the bearish side where theres is the least resistance to the downside
first level to 51.7x area and then down to 51.1x
$tsla pullback swing tradehigher timeframe is in uptrend with a weakening trend strength which means to resort to the oscillators
intermediate timeframe is showing a strong uptrend with a flattening short term moving average- indecision/potential consolidation
price action is telling me that there is a resistance at the 341.6x area with the triple pinbars
MACD is declining and starting to show downward momentum alongside the rsi
looking to a swing trade to the downside for an quick option trade to first profit target at .618 extension on lowertime frame of 338.0x area
and next profit target level at 335.5x area which on the intermediate timeframe would show a nice shallow pullback in the countertrend
setting stop tight if trade goes in other direction quickly- at 342.8x area


More Downsidewaiting on conformation of this 1hr consolidation break pass 4h support . expecting more downside forming new LL

USDJPY SHORT IDEAUSDJPY will hit the daily trendline and I am watching for a short potential. Looks very promising like the USDCHF triple top that formed and did the exact same a couple weeks ago.

WAITING FOR FLAG TO SELL 1.2875 - .2895Flag is developing and triangle is breaking. Looking for Pound weakness or Dollar strength to move this pair down.
Only thing that I don't like it that it's already Thursday and Im probably going to have to carry this trade into the
weekend. Looks good so far. Let's see how this flag develops and looking to take it down to 1.2720 - .2700
Just waiting for entry at this point. Let's see if we get one on the 1h or 15m

AUDUSD Loses Downside Momentum Following Significant Break AUDUSD broke decisively lower yesterday but follow through lacked today with the exchange rate showing only a marginal decline as of the European close.
Support at 0.7500 in the pair is seen as significant as it had held it higher since the middle of January. As the pair was confined to a range during this time, yesterday’s break of support signals a range break with measured move targets at 0.7280.

Adobe Trend Reversal or Buy Opportunity?
Adobe (ADBE) exploded upwards on Friday, March 16th after reporting their earnings. At the same time, a huge reversal bar formed on the daily chart with the close at $126.94. The following trading day’s bar closed just below the low confirming a possible reversal of a pretty massive uptrend the stock has been under over the last months. Not to mention, Adobe and Microsoft (MSFT) have announced a joint venture in customer engagement and marketing, as well as an Adobe announcements of new cloud services. The cloud services could become a new commercial source of revenue, especially with Adobe’s niche in the creative marketplace as opposed to cloud service providers like Amazon’s (AMZN) AWS.
But is it time to go short and sell? Well, for now, yes, or with less capital risk, fade the reversal. Fundamentals for the company are strong, with growth showing in the long term. But our strategy is a swing strategy to take advantage of lower risk opportunities. This trade with a stop loss above the high of the reversal bar at $130.30 is definitely not the lowest risk of them all, but a credit spread might suffice before a high potential for bullish continuation in the long run.
If you’re an options player like myself or a straight underlying trader, then here’s a few sets of trades depending on your investment style.
1) Short the stock
Entry: any price today
Stop: $130.31 on market close
Trail it after two more days of closing bars until breakeven. If the trend has started in the downward direction, trail it to our middle moving average and follow it until the bulls take over
2) Credit Spread
Sell X Call, 21 Apr 17 Exp, 130 Strike
Buy X Call, 21 Apr 17 Exp, 135 Strike
Max Profit: ~13% Return on Risk/Investment
3) Stay on the sidelines, and wait for a buy signal fractal for medium/longer term trade
Buy X Amount of Calls, 20 Oct 17 Exp, 115 Strike
Again, from a technical standpoint, we currently rate Adobe (ADBE) a Sell in the short term, but the bullish uptrend has a high likelihood of continuing in the medium to longer term due to the fundamental outlook and growth opportunities for the company.
Until our next article.

Faked the EURO BULLS?Hold previous structure. "Last wick standing"...
Could imagine break of lower trend line for more downside momentum on $EURUSD.


SP500 IndexThe rally from the 2240 to 2400 level is now exhibiting signs of a top. Yesterday's risk off has not seen any pull back and bears seem to be in control. FX market movements confirm the turnaround and we should now see a move to 2280 as the first target with potential sell-off of 10% down to 2125. Worse case, I see a 15% correction before regaining upside momentum; however, the additional 5% may come as a wick/candle.

Elliott Wave Analysis: CADJPY Could Be In For A ReversalAs you might know, we are looking higher on stocks based on Elliott Wave structure after only three waves of decline on E-mini S&P500 from 2400 highs. So more upside on stocks is normally bearish for Japanese yen, in risk-on environment. At the same time we see Oil prices in bullish mode as well which can be supportive for the Canadian dollar. What all that said, CADJPY can be an interesting pair in the coming sessions and days. Not only because of those market correlations, but also because of the wave structure which shows wave C) down to be an ending diagonal; this is a reversal pattern which can already be pointing to the upside if we consider five waves up on 30min chart.

GBPUSD: BuyThere are a few buy setups. I am looking for this pair to retest the high before a move down. Therefore I will be trailing my stops instead of taking traditional targets.

After-earnings $MAT Credit Spread Bearish Trade*WE'VE ACCIDENTALLY PUBLISHED PRIVATE IDEAS*
From a trade earlier this month, we traded a credit spread opportunity to the downside on Mattel ($MAT). Check out our articles for more about this trade as well as our trades on $TWTR and $WYNN this month.

EURUSD start fallingEURUSD is going to start falling or never. We are now heading to March US debt ceiling and French election One of the Candidate Marine Le Pen launched her presidential campaign, promising to put France first by freeing it it from the “tyrannies” of globalisation, Islamic fundamentalism and the European Union. If French election is favour Le Pen, EURUSD will cascade down. further more, UK will start Brexit in March so Europe is full of uncertain.
Moreover, the Greece debt problem will be due on July this year. Although Greece has suffer along and have achieve Fiscal surplus for 1% of GDP, some IMF offical still insist Greece have to achieve fiscal surplus of 3.5% in 2018 in order to get aid.
Weekly Chart of EURUSD is showing a rebound to previous support line and also 20 week moving average and hit resistance. Stochastic is showing overbought means it is a bit difficult to get further rally. if EURUSD break below 1.05 then it will open up the way to parity.

Star Downward TrendI'm a beginner in Technical Analysis and would like feedback from others.
Looking at STAR I believe a short-term down trend will take place. I've drawn trend lines and use the 5/10 SMA to determine the trend. I'm unsure of the hammer but after some resurgence the downward price action should continue.
Feedback is excellent please leave some!


Who else was in this Trade ?This was a nice trade but i forgot to post it since i was away, anyways i was in when we got a "D" im in profit hope i will post next time trades on time so anyone can join

Will it move down yes it willAs you can see it fits perfect the analysis i shorted it and will see profits for sure if not i have a tight stop loss
