IM BEARISH ON NVIDIA WITH A TARGET OF $55.00. HERE IS WHY:NVIDIA (NVDA) Known for their GPUs, recently has experienced a decline in asset price. Trump tariff's may have been a bearish news catalyst, but do the technicals show a bigger bearish picture?
1 Day chart: While the RSI recently signaled oversold conditions, the RSI line looks to be crossing down the RSI based moving average. Furthermore the 200 Day EMA and 65 Day EMAs appear to be forming a death cross. DMI is still indicating bearish, and the ADX is still above 20.
With recent political news, the tech company has been working on bolstering their U.S based production. But with inflation cooling (6 month low) , I believe many high performing blue chip stocks may see a dip as traders and institutions price in deflation, new news and political events.
My opinion on a target is $55.00 , and there is significant open interest on long puts for this price that are expiring in the coming months.
Will NVIDIA pull out of this downtrend? Or will it become a great value buy for investors?
Disclaimer: Not financial advice.
Downtrend

Dow Jones Update: Downside Pressure PersistsI currently estimate that the Dow Jones is in the early stage of wave B of wave (B), as indicated by the black label. This suggests that the index may continue its correction, potentially testing the 38,200–39,186 area before rebounding to challenge the resistance zone around 40,791 and possibly filling the gap between 41,173 and 41,629.
However, under the more bearish scenario (red label), the selling pressure on the Dow Jones remains significant, which may result in the formation of wave , leading to a deeper correction below the 36,611 level.

DXY – Key Level Broken, More Downside Ahead?Hello Folks , Long time no see .
The US Dollar Index (DXY) just broke below 106.5, and things are getting interesting. The trend has been weakening, and price is now sitting at a crucial zone.
📌 Here’s what I’m watching:
107.66 is the big resistance. If price can reclaim it, bulls might have a chance.
105.48 & 104.46 are the next major support levels.
👀 My Take:
If we stay below 106.5, I expect more downside towards 105.4 and maybe 103.3. If price bounces and reclaims 107, I’ll reconsider.
What’s your view? More downside or a bounce coming? Drop your thoughts below! 🚀🔥
🚨 Disclaimer:
Just sharing ideas here—this isn’t a trade advice . Everyone sees the market differently, and the goal is to improve our analysis, not tell anyone what to do. At the end of the day, your trades are your call, your responsibility. Trade smart! 🚀📊

XOM - Bearish in 4 months more DOWNTREND
The price of XOM has gone too far with the MA200. It will have to return to the MA200 as soon as possible if it does not want to crash.
Let's take a look at its price on the WEEK frame. MA50 and MACD support bearish.
On the DAY frame, the volume decreased, the price movement was low, the candles were very weak. The possibility of continuing the downtrend is very high.
Price target up: $105.94.
Price now: $104.56 (11:15 AM, 04.16.25).
Price target down: $98.00/ $91.84.
The price history will repeat itself as in Q4 2023.
IMO amateur trader.

BA - downtrend continuesIn chart week frame, MA50/ MA200, MACD show downtrend for MA continues.
Strong support at $121.02.
The pattern head and shoulders not completed so downtrend continues to $121.02 (maybe on middle of June).
Now price: $155.52.
IMO amateur trader.

USD-JPY Risky Short! Sell!
Hello,Traders!
USD-JPY is trading in a
Downtrend and the pair
Is making a local pullback
But will soon hit a horizontal
Resistance level of 144.700
From where we will be
Expecting a further
Bearish move down
Sell!
Comment and subscribe to help us grow!
Check out other forecasts below too!
Disclosure: I am part of Trade Nation's Influencer program and receive a monthly fee for using their TradingView charts in my analysis.

Bitcoin will continue to fall inside downward channelHello traders, I want share with you my opinion about Bitcoin. If we look at the chart, we can see how the price entered to downward channel, where it once declined to the channel's support line, which coincided with the resistance level and seller zone. Next, the price some time traded inside this area and even little declined below, but then it turned around and in a short time rose to the resistance line of the channel and made a fake breakout, after which it made a correction. Bitcoin long time traded inside seller zone and then broke 82000 level and declined to support level, which coincided with buyer zone. Then it made upward movement, after which it turned around and declined back to 75000 level. Recently, BTC bounced and started to grow, but in my mind, Bitcoin can rise a little more and then continue to decline inside a downward channel. Bitcoin will break the support level and fall to the 71800 support line of the channel, where my TP is located. Please share this idea with your friends and click Boost 🚀

HelenP. I Bitcoin may rebound from resistance zone and fall moreHi folks today I'm prepared for you Bitcoin analytics. After a strong rejection from the second resistance zone between 86700 and 87900 points, Bitcoin lost its bullish momentum. The price attempted to hold within the range but failed to break above the trend line, which has consistently acted as dynamic resistance. This trend line marked the turning point once again, pushing BTC down with increased selling pressure. The price then sharply declined, breaking below the first resistance zone between 78200 and 79500, which is now acting as resistance. This level was previously tested multiple times, making it a key barrier. After breaching this zone, the price dropped even lower and reached the 77000 area, where it found temporary support and began a minor bounce. Currently, Bitcoin is trading just below the resistance zone and remains under the trend line. Sellers are still in control, and the recent bounce looks weak compared to the prior impulse down. Given the rejection from resistance, the position relative to the trend line, and continued bearish pressure, I expect BTC to resume its decline toward 70000 points, which is also my goal. If you like my analytics you may support me with your like/comment ❤️

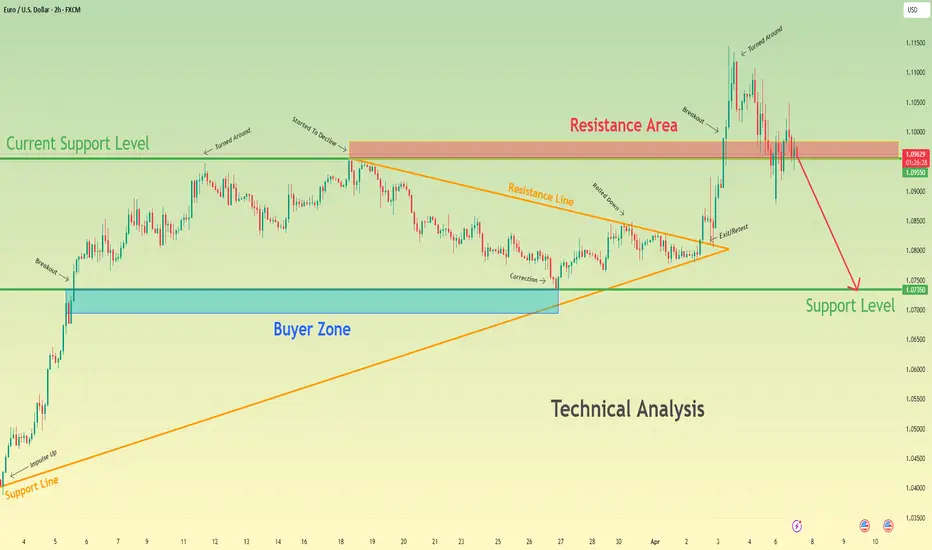
Euro will break current support level and drop to 1.0735 levelHello traders, I want share with you my opinion about Euro. Recently, the price completed a pennant pattern, which resulted in a breakout to the upside. This breakout, however, didn’t gain much ground - the movement quickly lost momentum inside the resistance area between 1.0955 - 1.0985 points, where Euro sharply turned around. The reversal from this zone wasn’t unexpected, considering this level had already acted as resistance earlier. What followed was a clean break below the current support level at 1.0955 points, which shifted the market structure back to bearish. Now the price is trading lower, and the bearish impulse looks set to continue. My expectation is a further decline toward the support level at 1.0735, which also aligns with the buyer zone between 1.0695 - 1.0735 points. This level may act as the next potential area of interest where buyers could attempt a defence. The invalidation of local support, weakness after the breakout, and strong supply reaction from resistance all point to a high probability of continuation down toward TP 1 - 1.0735 level. Please share this idea with your friends and click Boost 🚀
$ANET $65 target support from resistanceHi, got a bit of resistance here around the $73-$75 zone from previous times ago and currently and atop a bearish sentiment uncertain market environment. Will be looking to short to the $65 zone. $63 is a plausible target.
wsl

BTC: FVG Filled – Room for Further Downside?#BTC didn’t reach the major demand zones below but gave us a minor bounce and filled the Fair Value Gap (FVG).
Now that the FVG is filled, the chart looks ready to continue the move down into stronger support areas.
Stay locked in—follow me so you don’t miss the next key levels. 📉✅

US100 Downtrend Analysis & Key LevelsAfter analysing the US100 chart, the index has been trading within a downtrend channel since Friday, February 21, 2025. After dropping to 19,131, it attempted a recovery but faced strong resistance at 19,957, leading to a decline. As the saying goes, “ Follow the trend—the trend is your friend. ” Given the ongoing downtrend, US100 may continue to decline toward the next strong support level at 18,489.
Ensure you adhere to proper risk management for long-term success.
Happy Trading

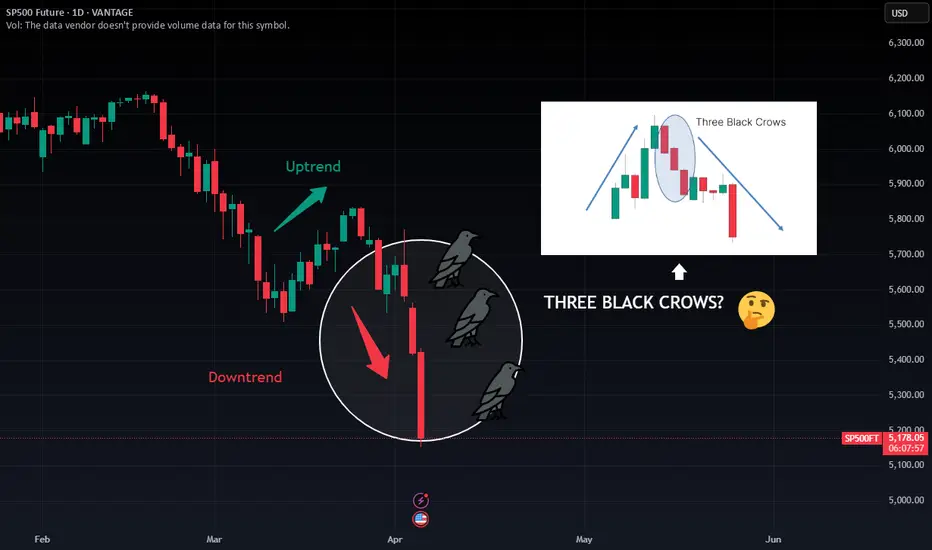
Are These the Three Black Crows Signaling More Pain Ahead? The S&P 500 has just printed three consecutive long-bodied red candles following a brief uptrend. This classic "Three Black Crows" formation could be a powerful bearish reversal signal—one that historically hints at a deeper correction on the horizon.
📊 What does this pattern mean?
Appears after an uptrend or rally.
Consists of 3 bearish candles closing near their lows.
Suggests strong seller control and trend reversal potential.
🔍 Current context:
The S&P is already under heavy pressure from macroeconomic and geopolitical concerns.
This pattern adds further bearish sentiment, especially if we see continued follow-through on volume.
🚨 If confirmed, we could be looking at the continuation of a larger downtrend. But remember: confirmation is key. Watch closely how price reacts in the next 1–2 sessions.
🧠 Do you see this as a real warning—or just a pause before the next leg up?
#SP500 #ThreeBlackCrows #CandlestickPatterns #BearishSignal #TechnicalAnalysis
AUDUSD Potential SellsFX:AUDUSD is definitely interesting rn. I can see AU selling to the 0.6200 area based of H4/Daily head & shoulders pattern. If price breaks daily support/head & shoulders neckline, then that'll give me more confirmation to look for sells.

Dow heading below $40k?Based on two important measured moves -- the double top AND the bear flag -- they both point to below $39k. If so, then I would not be surprised to see the 382 Fibonacci level around 36K-37k get tagged.

USD/JPY 4H Analysis – Potential Bearish RetestThe USD/JPY pair has been in a clear downtrend, trading within a descending channel for an extended period. Recently, price action has broken above the channel, but it is now facing resistance around the 150.35 level.
Retest Zone: The pair is currently retesting the broken trendline, and if it fails to sustain above this level, a rejection could lead to further downside.
Bearish Expectation: If the price fails to reclaim 150.35, a move towards the 147.00 support zone is likely.
Confirmation: A strong bearish candle from this level could indicate a reversal, confirming the downward move.
Traders should watch for price action signals at the retest level before making decisions.

Bitcoin (BTC/USD) – Bearish Rejection from Supply ZoneThis chart represents a technical analysis of Bitcoin (BTC/USD) on the daily timeframe, highlighting key levels of resistance, support, and potential price movement. It indicates a bearish rejection from a supply zone, which suggests that BTC may experience further downside pressure.
Key Components of the Chart:
📌 1. All-Time High (ATH) + Resistance Zone (~$110,000 - $115,000)
This is the highest price level Bitcoin has ever reached on this chart.
It acts as a strong resistance zone, meaning sellers are likely to step in if the price approaches this level again.
📌 2. Supply Zone (~$88,000 - $90,000)
The supply zone is an area where selling pressure is high.
BTC attempted to break above this zone but got rejected, leading to a sharp decline.
This rejection confirms that bears are in control, pushing the price downward.
📌 3. Stop Loss (~$95,629)
This level represents the point where a bearish trade would be invalidated.
If BTC breaks above this level, it could indicate a shift in momentum toward bullish territory.
📌 4. Current Price Action (~$83,444)
BTC is currently trading below the supply zone, showing weakness.
The recent lower high formation suggests a continuation of the downtrend.
📌 5. Take Profit (TP) Level (~$65,969)
This is the target level for a potential bearish move.
The $65,969 level has acted as major support in the past, meaning buyers may step in here.
If BTC reaches this level, it could either bounce back up or break lower, leading to further downside movement.
📌 6. Major Support Level (~$45,000 - $50,000)
If BTC breaks below the $65,969 support, the next major support zone is around $45,000 - $50,000.
This area is historically significant and could provide a strong buying opportunity.
Trade Plan & Strategy:
🔴 Bearish Bias:
The rejection from the supply zone signals a continuation of the downtrend.
A short position can be considered if BTC fails to break above the supply zone again.
🎯 Trade Setup:
Entry: Around $85,000 - $88,000 (if BTC retests the supply zone and gets rejected again).
Stop Loss: Above $95,629 to protect against an unexpected bullish breakout.
Take Profit (TP): Around $65,969, targeting the next major support level.
Conclusion:
BTC is showing signs of a bearish continuation, with strong resistance at the supply zone.
A potential move toward $65,969 is likely if selling pressure continues.
If BTC breaks below this key level, a further decline toward $45,000 - $50,000 could happen.
⚠️ Disclaimer : This is not financial advice. Always conduct your own research before making trading decisions. 🚀📉

HelenP. I Bitcoin can drop of resistance line of wedge to $77800Hi folks today I'm prepared for you Bitcoin analytics. A few days ago, the price surged to 99000 before pulling back to the resistance level, which aligned with the resistance zone. Then, BTC broke through the 89500 level, traded below it for a while, and continued its decline toward the support level, which coincided with the support zone. Following this move, Bitcoin started trading inside a wedge pattern and quickly made a strong upward impulse from the support zone, reaching 94900 and breaking the resistance level once again. However, it soon corrected, dropping back below this level, and after attempting to recover, it failed. BTC then began to decline and, in a short time, fell to the support zone, where it reached the trend line. After bouncing off this level, it started to rise again, eventually making a correction to the support level before continuing its upward movement inside the wedge. At this point, I expect BTCUSDT to reach the resistance line of the wedge before reversing and dropping to the trend line, breaking the support level. Based on this, my goal is set at 77800, which coincides with the trend line. If you like my analytics you may support me with your like/comment ❤️

EURNZD Potential declineHello traders, we have a downward wave and a correction pattern. Another downward wave is expected.

US30 Rebounds from Key Support – Bulls Eyeing New HighsKey Support & Trendline Confluence:
The price recently bounced off the long-term ascending trendline, which has been a strong support level since late 2023.
The 38.2% Fibonacci retracement level ($40,205) provided additional confluence for a potential reversal.
Resistance Levels & Breakout Potential:
Immediate Resistance: $42,000 – A break above this level could confirm a bullish continuation.
Major Target: $45,065 – If momentum sustains, this all-time high could be tested soon.
Bullish Scenario:
A successful breakout above $42,000 could lead to an accelerated move toward $45,065 and beyond.
The trendline’s support indicates that bulls remain in control, and the recent rebound suggests renewed buying interest.
Risk Management & Confirmation:
Bullish confirmation: Sustained price action above $41,500 with strong volume.
Invalidation level: A breakdown below $40,000 could indicate a potential trend reversal.
Conclusion & Strategy:
Short-Term: Monitor price action around $42,000 for breakout confirmation.
Mid-Term: Expect a bullish move toward $45,000+ if the trendline holds.
Long-Term: If price breaks all-time highs, further upside potential is possible.
🚀 Bullish Confirmation Above $42,000 | ⚠️ Caution Below $40,000

BITCOIN MARKET ANALYSIS: CRASH OR NEXT BIG MOVE?BITCOIN MARKET ANALYSIS: CRASH OR NEXT BIG MOVE
Expert Insights and Key Trends
Is Bitcoin poised for a significant downturn or a major upward swing? In this in-depth analysis, we examine:
- Current Market Trend: A thorough review of Bitcoin's present market trajectory.
- Critical Support and Resistance Zones: Identification of key levels that may influence future price movements.
- On-Chain Analysis and Whale Movements: Expert analysis of on-chain data and whale activity.
- 2024 Bitcoin Price Prediction: Insights from industry experts on Bitcoin's potential price trajectory.
Stay Informed, Stay Ahead
Whether you're a trader or long-term investor, this analysis provides crucial information to help you navigate the Bitcoin market.

SOLVUSDT → Retest of resistance in a bearish trendBINANCE:SOLVUSDT is strengthening within a neutral range, which is formed amid a downtrend. Cryptocurrency market quickly sells off potential after Sunday's news
Bitcoin is back to the selling zone, under the 90K area. A subsequent decline in the flagship could negatively impact the entire market.
SOLV is forming a range of 0.044 - 0.0292. The price is strengthening and tends to the zone of interest and liquidity. Against the background of key preconditions (downtrend, weak market, absence of driver, falling bitcoin) we can assume that the coin has no potential for further growth and the current maneuver may end up with a false break of resistance followed by a fall.
Resistance levels: 0.0436, 0.0439, 0.0494
Support levels: 0.0369, 0.0345
From the opening of the session, the daily ATR will be exhausted by the time resistance is reached, thus there will be no potential for resistance breakout. High probability of a bounce from 0.0436-0.0439 with the purpose of further fall to the key zones of interest located below.
Regards R. Linda!

DOW New LowAs per my view DOW is going down side in near future , this is totaly based on price action and Astro based .
